Why Sugar Mill Effluent Needs a Dedicated Treatment Plant
A sugar mill's wastewater stream will choke a municipal-style sewage treatment plant within hours of the campaign start. Raw influent from crushing, clarification, and (where present) molasses distillery operations carries COD of 3,000–8,000 mg/L, BOD of 1,500–3,000 mg/L, total suspended solids (TSS) of 500–3,000 mg/L, pH of 4.0–6.5, and temperatures of 40–60°C — roughly 10× the organic load and 2× the temperature of domestic sewage. The three main sources feeding the ETP are imhoff overflow from the sugar house (juice clarification, vacuum pan washings), condenser cooling water bleed with entrained sugar and bagasse fines, and distillery spent wash (if the mill runs captive ethanol production), which can arrive at COD of 80,000–150,000 mg/L. Bagasse washing effluent adds fibre and pith, while boiler blowdown contributes high total dissolved solids (TDS) and sulphates.
The visible signature of untreated mill effluent — a deep brown colour and persistent foaming — comes from melanoidin compounds, residual molasses, and finely divided bagasse. These compounds resist conventional biological oxidation and bleach UV disinfection across the polishing stage. A properly designed multi-stage sugar mill effluent treatment plant addresses these extremes through staged screening, equalization, anaerobic pretreatment, aerobic polishing, and tertiary filtration. Full-scale evaluations of operating ETPs have demonstrated COD removals of 97% and BOD removals of 95% on influent of 5,102 mg/L COD and 1,988 mg/L BOD (Baraniya & Jodhi, 2018), confirming that engineered systems — not lab-scale algal experiments — are the reliable path to compliance.
Sugar Mill Effluent Characteristics: 2026 Influent Parameters
Process selection starts with a full mass balance across every waste stream entering the ETP, not just the combined flow to the biological stage. A mill that ignores the spent wash stream will oversize its equalization tank and underdesign its anaerobic reactor; a mill that ignores cooling water bleed will dilute the organic load to the point where DAF polymer consumption is wasted. The table below summarizes typical influent ranges across the five streams a 2026 sugar mill ETP must handle.
| Parameter | Imhoff effluent | Floor washings | Bagasse wash | Boiler blowdown | Distillery spent wash |
|---|---|---|---|---|---|
| COD (mg/L) | 3,000–6,000 | 2,000–5,000 | 4,000–8,000 | 200–600 | 80,000–150,000 |
| BOD (mg/L) | 1,500–2,500 | 800–2,000 | 2,000–3,500 | 50–150 | 40,000–60,000 |
| TSS (mg/L) | 500–2,500 | 1,000–3,000 | 2,000–5,000 | 100–400 | 8,000–15,000 |
| pH | 4.5–6.5 | 5.0–7.0 | 4.0–6.0 | 9.0–11.0 | 3.5–4.5 |
| Temperature (°C) | 45–60 | 30–45 | 40–55 | 50–70 | 80–100 |
| Total nitrogen (mg/L) | 40–80 | 30–60 | 50–100 | 5–15 | 1,500–3,000 |
| Total phosphorus (mg/L) | 10–30 | 5–20 | 10–25 | 2–5 | 300–600 |
| Sulphate (mg/L) | 50–200 | 30–100 | 40–150 | 200–800 | 3,000–8,000 |
Three points drive the design from this table. First, spent wash dominates the mass load — at COD of 80,000–150,000 mg/L and TDS of 60,000–120,000 mg/L, even a small flow from a captive distillery will swamp equalization if blended directly. Most 2026 designs segregate spent wash into a high-rate anaerobic reactor (UASB or IC) sized on its own load, and only the overflow mixes with the general mill stream. Second, the temperature spread (30–100°C across streams) forces cooling before biological treatment — anaerobic methanogens lose activity above 40°C, and aerobic nitrification drops sharply above 45°C. Third, campaign season (typically 4–7 months) concentrates the flow; equalization must be sized to buffer diurnal peaks of 1.5–2× the daily average without bleeding hot liquor to the biological stage.
Stage-by-Stage Process Design: From Screening to Polishing
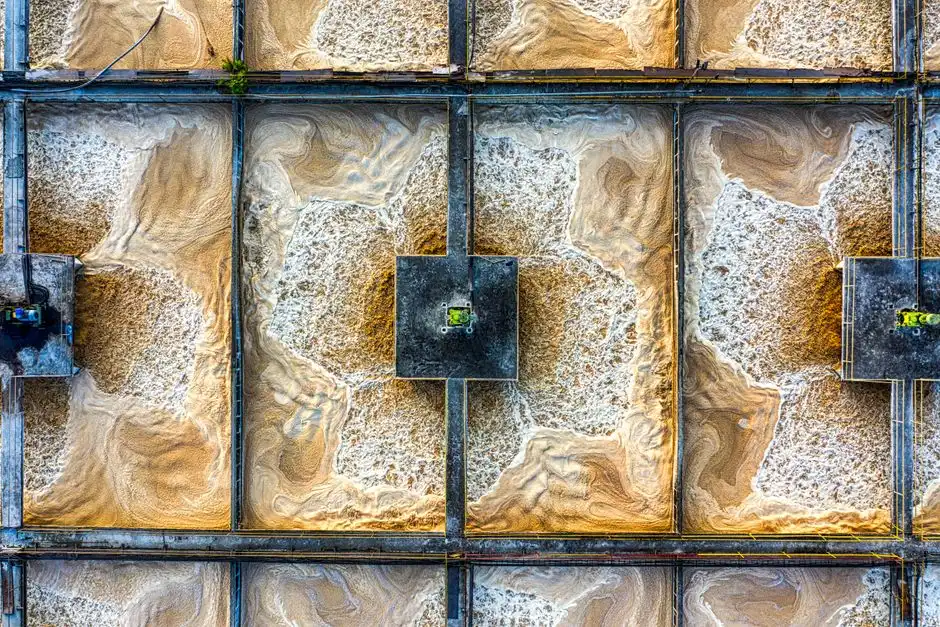
The treatment train below is the configuration most commonly specified for a 2026 sugar mill ETP handling combined imhoff, bagasse wash, and condensate flows, with optional distillery integration. Sizing values come from full-scale operating data across Indian, Brazilian, and Southeast Asian installations.
| Stage | Equipment | Key design parameters | Typical removal / output |
|---|---|---|---|
| 1. Screening & grit | Rotary bar screen, grit chamber | 6–10 mm openings, 0.3 m/s approach velocity | Removes bagasse, fibre, large debris |
| 2. Equalization | Equilization tank, cooling tower, pH correction | 8–24 h HRT, temperature ≤40°C, pH 6.5–7.5 | Buffers flow, load, pH, temperature |
| 3. Primary clarification | Dissolved air flotation (DAF) with polymer dosing | 4–6 m/h hydraulic loading, 25–35% recycle ratio | 60–80% TSS, 20–30% COD removed |
| 4. Anaerobic treatment | UASB or IC reactor (high-rate) | HRT 12–48 h, upflow 0.7–1.0 m/h, mesophilic 35–37°C | 70–85% COD removal, 0.30–0.45 m³ biogas/kg COD |
| 5. Aerobic biological | ASP or MBBR + secondary clarifier, or MBR | HRT 8–24 h, MLSS 3,000–5,000 mg/L (ASP) or 8,000–12,000 mg/L (MBR) | 80–95% COD, 90–95% BOD |
| 6. Tertiary polishing | Sand/multi-media filter, optional RO, ClO₂ disinfection | TSS ≤5 mg/L, turbidity ≤2 NTU post-filter | Meets reuse or discharge limits |
| 7. Sludge handling | Plate and frame filter press or screw press | Cake solids 22–28% DS, polymer dose 3–6 kg/t DS | Landfill or compost feedstock |
Stage 1 protects the rest of the train. A rotary bar screen with 6–10 mm openings strips bagasse and cane fibre before they reach the pumps. Stage 3 DAF is where the bulk of suspended solids and a meaningful slice of COD come out — an industrial DAF system sized at 4–6 m/h hydraulic loading with 25–35% recycle and polymer flocculation typically removes 60–80% of TSS before any biological load is applied. Stage 4 is the energy-recovery centre: a UASB or IC reactor running 12–48 h HRT delivers 70–85% COD removal and produces 0.30–0.45 m³ of biogas per kg of COD destroyed, which most 2026 mills pipe directly to a boiler or CHP unit. Stage 5 closes the organic load — an MBR membrane bioreactor system using submerged PVDF modules at 0.1–0.4 μm drives residual COD below 50 mg/L and TSS below 5 mg/L in a single step, removing the need for a separate secondary clarifier. Stage 7 closes the mass balance: a plate and frame filter press dewatered biological and float sludge to 22–28% dry solids for off-site disposal or co-composting with press mud.
Process Flow Comparison: Standard ASP vs Hybrid MBR for Sugar Mill ETP
The single biggest process decision in a 2026 sugar mill ETP is whether the aerobic stage ends in a conventional clarifier (ASP) or a membrane bioreactor (MBR). The choice drives footprint, effluent quality, and CAPEX by 30–50%, and it should be locked in before equipment RFQs go out. The table below compares both on the five axes a procurement team will be asked to defend.
| Criterion | Conventional ASP + clarifier | MBR (submerged PVDF) |
|---|---|---|
| Effluent COD | 80–120 mg/L | <50 mg/L |
| Effluent TSS | 10–30 mg/L | <5 mg/L |
| Footprint | 100% baseline | 40–60% of ASP |
| MLSS tolerance | 3,000–5,000 mg/L (sludge settle limits) | 8,000–12,000 mg/L (membrane decouples retention) |
| Operator skill required | Moderate (clarifier, sludge wasting, RAS) | Higher (membrane cleaning, integrity testing) |
| Indicative CAPEX (per m³/day capacity) | USD 700–1,200 | USD 1,400–2,200 |
The decision rule is straightforward. Specify MBR — specifically a submerged membrane module with 0.1 μm PVDF flat-sheet or hollow-fibre elements — when the treated water feeds cooling tower make-up, boiler-feed pre-treatment, or cane washing, because the reuse loop demands TSS below 5 mg/L and turbidity below 2 NTU. Specify conventional ASP when the mill has access to cheap land, discharges to a municipal sewer or a large receiving water body, and only needs to meet BOD below 30 mg/L and COD below 250 mg/L. A 2026 hybrid is also common: ASP followed by a small tertiary MBR polishing step on a slipstream, capturing most of the reuse benefit at lower membrane area. For broader context on membrane economics, the 2026 MBR market data segment confirms industrial MBR pricing has dropped roughly 8–12% year-on-year as Chinese and Indian module capacity has scaled.
Equipment Selection and Sizing for Each Treatment Stage
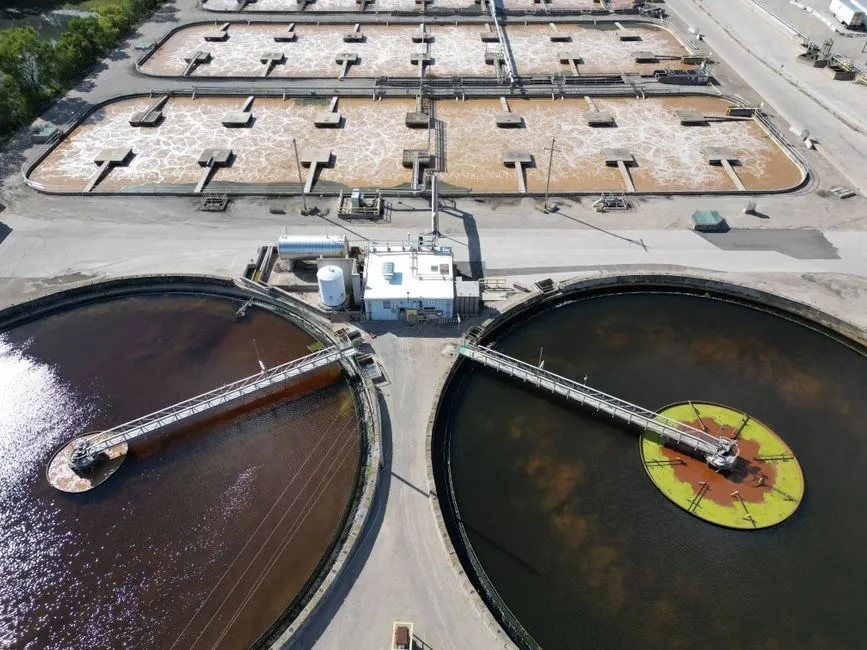
Translating the process flow into a bill of quantity is where most ETP projects slip on either over-specification or under-engineering. Five equipment decisions carry 80% of the weight.
For the DAF stage, size on hydraulic loading of 4–6 m³/h per m² of effective surface area, with micro-bubble generation at 25–35% recycle ratio. The industrial DAF covers 4–300 m³/h in 13 standard models, which lets a 500–2,000 m³/day mill select a unit without custom tank fabrication.
For the anaerobic reactor, hydraulic retention time is the controlling variable: 12–24 h for moderate COD (5,000–10,000 mg/L combined stream) and 36–48 h for high-strength or distillery-integrated streams. Upflow velocity must stay in the 0.7–1.0 m/h window to retain the granular sludge blanket — exceeding 1.2 m/h risks washout, dropping below 0.5 m/h risks channeling and dead zones.
For the MBR module, use 0.1 μm PVDF flat sheet or hollow fibre with a design flux of 15–25 L/m²·h. Submerged configurations consume 10–20× less energy than cross-flow tubular systems. Plan a backwash cycle of 8–15 minutes and a chemical clean-in-place every 3–6 months with 1,000–2,000 mg/L NaOCl. For aerobic alternatives, the MBBR engineering guide covers carrier-media sizing when suspended-growth systems are preferred over membranes.
For sludge dewatering, a plate and frame filter press targeting 22–28% dry solids is the default for biological + DAF float sludge. A screw press becomes economic when feed solids are below 2% DS and throughput is moderate (under 20 m³/h), but it tops out around 20–22% DS and struggles with oily or fibrous sludge.
For chemical dosing, a PLC-controlled chemical dosing skid handling polymer, coagulant, NaOH for pH correction, and antifoam cuts installation time on remote mill sites and gives the operator one HMI to manage instead of four separate dosing pumps.
2026 Cost Benchmarks and Compliance Targets
Capital and operating cost ranges for a 2026 sugar mill ETP are wide because the biological configuration drives the biggest swing. A 500–2,000 m³/day plant with conventional ASP and no anaerobic pretreatment lands at USD 1.2–2.0 million in CAPEX. Adding high-rate anaerobic (UASB or IC) pushes CAPEX to USD 2.0–3.0 million, but the biogas offset typically returns USD 80,000–150,000 per year in fuel savings — payback inside 4–5 years. The MBR hybrid with anaerobic pretreatment and reuse-quality polishing tops the range at USD 3.0–4.5 million, justified only when the mill is water-constrained or faces tight discharge consent.
OPEX for a 2026 sugar mill ETP runs USD 0.18–0.45 per m³ treated. Aeration energy is the single largest line item (40–55% of OPEX), followed by polymer dosing (10–15%), sludge disposal (8–12%), and membrane replacement (5–10% for MBR plants). Energy recovery from anaerobic biogas typically offsets 20–30% of aeration cost. Across major sugar-producing jurisdictions, the compliance numbers to anchor an RFP against are: India CPCB discharge of 30 mg/L BOD and 250 mg/L COD for inland surface water (full breakdown in the India CPCB discharge limits 2026 reference); EU BAT-AEL for the food sector at COD 25–100 mg/L depending on receiving water; and Brazil CONAMA 430 at 60 mg/L BOD for receiving waters. Mills that achieve reuse quality can supply 30–50% of total mill water demand from treated effluent — the largest single cost-avoidance lever in the business case, often larger than the avoided discharge fine.
Frequently Asked Questions
What is the typical COD of sugar mill wastewater? Combined mill influent runs 3,000–8,000 mg/L COD during campaign. The range widens to 2,000–150,000 mg/L when individual streams are measured — bagasse washings sit at the high end, while boiler blowdown and cooling bleed are below 600 mg/L. Design the equalization tank on the blended value, not the worst stream.
Can sugar mill wastewater be treated biologically? Yes. Two-stage anaerobic (UASB or IC) followed by aerobic (ASP, MBBR, or MBR) reliably achieves 95–97% COD and 90–95% BOD removal on full-scale mill effluent (Baraniya & Jodhi, 2018). The anaerobic stage is essential for high-strength streams — aerobic-only systems cannot handle the load economically.
What is the best biological treatment for distillery spent wash? High-rate anaerobic — either UASB or IC reactor — is the standard 2026 configuration. HRT of 36–48 h, mesophilic temperature, and biogas recovery offset most of the operating cost. Post-anaerobic polishing in ASP or MBR brings residual COD below regulatory limits.
How much does a sugar mill ETP cost in 2026? CAPEX for a 500–2,000 m³/day plant runs USD 1.2–4.5 million depending on configuration: ASP-only at the low end, anaerobic + MBR + reuse polishing at the high end. OPEX sits at USD 0.18–0.45 per m³ treated.
Can treated sugar mill effluent be reused? Yes. After MBR + multi-media filtration + disinfection, the polished water meets cooling tower make-up and cane washing specs. With RO added, it can feed low-pressure boilers. Most 2026 mills target 30–50% reuse of total water demand from the ETP.