Why Sugar Mill Wastewater Needs a Dedicated Dosing System
A sugar mill ETP in-charge who has chased melanoidin color breakthrough across the clarifier weir for the third shift running already knows the answer: a biological reactor alone will never polish that stream to the 250 mg/L COD and 100 mg/L TSS limits set under the CPCB sugar industry discharge norms. Raw sugar mill wastewater typically enters the ETP at COD 2,787 ± 1,552 mg/L (per MDPI full-scale data, 2021), with a BOD/COD ratio of ~0.5, so the biodegradable fraction is roughly 1,300 mg/L BOD but the residual 1,500 mg/L is recalcitrant color and high-molecular-weight organics. Three characteristic streams hit the equalization basin: imbibition and diffuser water at 60–70 °C carrying the highest COD load, condenser cooling bleed-off at lower COD but high volumetric flow, and intermittent floor/equipment wash water with bagasse-fine spikes. Color sits between 1,500 and 4,500 Pt-Co units, pH ranges 4.5–7.0 (sour in the morning after a wash, alkaline after a lime spill), and TSS routinely exceeds 800 mg/L because of bagasse carry-over. Without a purpose-built sugar mill wastewater chemical dosing system upstream of the clarifier, the downstream UASB or MBBR is asked to do two jobs it was never sized for: flocculate colloidal color and mineralize soluble COD. The dosing skid absorbs the first job so the biology can focus on the second.
Dosing Chemistry: Lime, Polyaluminum Chloride, and PAM
The dosing chemistry stack for a sugar mill ETP is a three-chemical sequence plus pH trim and nutrient top-up. Lime (Ca(OH)₂ as a 5–10% slurry) is the foundation chemical: a 1.0–3.0 g/L dose lifts the equalization-tank pH into the 9.5–11.0 window, which hydrolyzes melanoidin chromophores, precipitates sulfides, and drops 30–50% of the color bodies out as a calcium-organic floc. Polyaluminum chloride (PAC, 10–18% Al₂O₃) is the workhorse coagulant, dosed at 100–400 mg/L into a coagulation tank 30–60 s downstream of the lime injection point. The high pH converts the Al(III) species to polymeric hydroxide complexes that sweep colloidal color and TSS; expected performance is 60–80% color removal and 40–60% TSS removal across the primary clarifier. Anionic polyacrylamide (PAM, 10–18 million Dalton molecular weight, supplied as a 0.1–0.3% solution) at 1–5 mg/L acts as a flocculation aid — the long anionic chains bridge PAC micro-flocs into settleable macro-flocs sized 2–5 mm. After the clarifier, sulfuric acid (H₂SO₄, 10%) or CO₂ sparging trims pH back to 6.5–7.5 before the biological stage, and urea plus DAP corrects the BOD:N:P ratio if the equalization basin dilutes nutrients below 100:5:1 — typical N dose 15–30 mg/L as N, P dose 3–6 mg/L as P.
| Chemical | Form | Dose (mg/L or g/L) | Target pollutant | Injection pH | Expected removal |
|---|---|---|---|---|---|
| Lime Ca(OH)₂ | 5–10% slurry | 1.0–3.0 g/L | Color, sulfides, partial COD | 9.5–11.0 | 30–50% color, 15–25% COD |
| PAC (10–18% Al₂O₃) | Liquid | 100–400 mg/L | Colloidal color, TSS | 9.0–10.5 | 60–80% color, 40–60% TSS |
| Anionic PAM (10–18 M Da) | 0.1–0.3% solution | 1–5 mg/L | Floc bridging | 9.0–10.5 | Stronger floc, faster settling |
| H₂SO₄ (10%) | Liquid | 50–200 mg/L | pH trim to biology | 6.8–7.2 (downstream) | Protects biomass |
| Urea + DAP | Solid / liquid | 15–30 mg/L N, 3–6 mg/L P | Nutrient balance | 6.8–7.5 | BOD:N:P = 100:5:1 |
Process Flow: Where Each Chemical Injects in the ETP
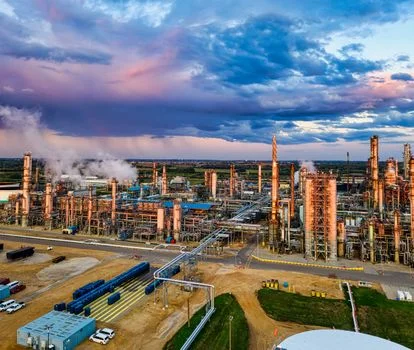
Injection order is not optional — most under-dosed mills inject PAM first or skip the equalization buffer and the floc never forms. The correct sequence runs in five steps. Step 1: Equalization tank, 6–8 h HRT, with lime dosing on a flow-paced loop to lift pH to 9.5–11.0. The high pH does the heavy lifting of melanoidin destruction, which is why lime goes first and alone. Step 2: Coagulation tank, 2–5 min HRT, fitted with an in-line static mixer (G > 500 s⁻¹) for PAC injection — PAC must follow the lime by at least 30 s of residence, otherwise aluminum hydroxide forms the wrong species and dose efficiency drops 20–30%. Step 3: Flocculation tank, 15–25 min HRT, with slow paddle mixing at 10–20 rpm (G = 50–80 s⁻¹) and PAM injection at the inlet; PAM must never contact raw wastewater or any zone with shear above 100 s⁻¹ or the polymer chains scissor and lose bridging capacity. Step 4: Primary clarifier, lamella plate or conventional hopper-bottom, 2–4 h HRT and surface loading 1.0–1.5 m³/m²·h, which removes 60–80% of TSS and 40–60% of COD. Step 5: pH correction ahead of the biological reactor using sulfuric acid with a pH feedback loop targeting 6.8–7.2 — for plants with strict reuse targets, CO₂ sparging is preferred because it adds no TDS to the downstream polishing or color-removal train.
Dosing System Hardware: Pumps, Tanks, Mixers, and PLC
Translating the chemistry table into a procurement spec is the engineer's next step, and the hardware list below can be copied straight into a datasheet or RFQ. Diaphragm metering pumps — mechanical or hydraulic actuated, with PVDF heads for acid and PAC service and SS316 for lime slurry — are sized at 1.5–2× calculated duty so the pump runs in its efficient 30–70% stroke range; typical capacity per pump head is 10–500 L/h, and a 50 m³/h mill normally runs two pumps per chemical (duty + standby). Chemical storage tanks are HDPE or XLPE, 1–5 m³ per chemical, UV-stabilized, with calibration marks, top-mounted mechanical mixers for lime and PAC, and a bunded concrete pad sized for 110% containment per CPCB hazardous-storage guidelines. Mixers are top-entry gear-driven for tanks up to 5 m³ (mild-steel rubber-lined for lime, PP or FRP for PAC and acid); side-entry mixers are reserved for larger working tanks. Instrumentation includes an inline self-cleaning pH probe on the lime dosing loop, an optical TSS probe on the clarifier effluent, a magnetic flow meter on the raw wastewater line, and float or capacitive level switches on every storage tank. The PLC skid is the brain: an Allen-Bradley CompactLogix or Siemens S7-1200 with 4–8 analog inputs, 4–6 VFDs on the chemical pumps, an HMI showing live dose rates and trends, and Modbus TCP to the plant SCADA. A pre-engineered, factory-tested skid-mounted PLC chemical dosing system arrives on a common base frame with calibrated tanks, pre-piped pumps, and a tested program — the on-site work is reduced to power and water connections over 1–3 days.
| Item | Spec | Sizing rule (per 50 m³/h train) | Material |
|---|---|---|---|
| Metering pump (lime, PAC, PAM, acid) | Diaphragm, 10–500 L/h | 1.5–2× calc duty; duty + standby | PVDF head (acid/PAC), SS316 (lime) |
| Storage tank | 1–5 m³ each | 7-day chemical inventory | HDPE / XLPE, UV-stabilized |
| Tank mixer | Top-entry, gear-driven | 0.5–1.5 kW per tank | MS rubber-lined (lime), PP/FRP (PAC, acid) |
| pH probe | Inline, self-cleaning | 1 on lime loop, 1 on clarifier effluent | Glass body, PTFE junction |
| TSS probe | Optical, 0–5000 mg/L | 1 on clarifier effluent | SS316 body, sapphire window |
| Magnetic flow meter | DN50–DN150 | 1 on raw wastewater line | PTFE liner, SS electrodes |
| PLC skid | CompactLogix / S7-1200 | 4–8 AI, 4–6 VFD outputs | Powder-coated MS enclosure, IP54 |
Dose Control Strategies: From Manual to Closed-Loop PID

Open-loop dosing — timer-based or flow-paced only — is the cheapest control strategy and the most expensive in chemical OPEX. On a sugar mill stream with influent swings of ±40% over a single shift, an open-loop PAC pump will over-dose 30–50% during low-load hours and under-dose during wash-water spikes, which is exactly when color breaks through. The minimum viable control for the lime loop is feed-forward on raw water flow plus a pH trim signal at the equalization outlet; this alone typically cuts lime consumption 10–15% versus open-loop. The recommended control for the PAC and PAM pair is PID closed-loop on clarifier-effluent pH and TSS, where the controller adjusts stroke length to hold a TSS setpoint of 150–250 mg/L — HydropureWater field data from 2025-11 retrofits shows this loop reduces PAC consumption 15–25% and stabilizes effluent quality. For mills chasing zero-liquid-discharge or strict color reuse targets, a trim loop on residual color or UV254 in the polishing stage auto-adjusts coagulant dose on a slower 20–30 min time constant, layered on top of the TSS loop. The control architecture is hierarchical: flow-paced base dose, pH/TSS PID in the middle, color or UV254 trim on top.
Cost, OPEX, and a Sizing Worked Example
CAPEX for a four-chemical dosing skid sized for 50 m³/h sits in the $18,000–$45,000 range in 2026, depending on pump brand (Grundfos, LMI, or Milton Roy) and PLC tier (CompactLogix at the top end, S7-1200 mid, click PLCs at the low end). OPEX per cubic meter of treated wastewater breaks down as: lime $0.03–$0.09, PAC $0.02–$0.06, PAM $0.005–$0.015, sulfuric acid $0.005–$0.02, and power plus maintenance $0.01–$0.03 — total chemical and utility OPEX of $0.07–$0.23/m³. Worked example for a 50 m³/h Indian sugar mill running 20 h/day through a 150-day crushing season: daily throughput is 1,000 m³, seasonal throughput is 150,000 m³, and dosing OPEX lands at $10,500–$34,500 per season; CAPEX pays back in under 2 seasons once non-compliance penalties, reduced biological-stage energy, and lower sludge dewatering OPEX after the clarifier are factored in. The single biggest ROI driver is biological-stage protection: chemical pre-treatment cuts aeration energy 20–35% in an MBBR or downstream ASP and increases UASB loading capacity 30–50% by stripping out the recalcitrant color load that would otherwise poison the biomass.
Frequently Asked Questions
What is the best coagulant for sugar mill wastewater? Polyaluminum chloride (PAC) at 100–400 mg/L paired with anionic polyacrylamide at 1–5 mg/L; a lime pre-dose of 1–3 g/L raises pH to 9.5–11.0 to hydrolyze melanoidin color bodies before coagulation.
How much lime is required per m³ of sugar mill wastewater? 1.0–3.0 kg of Ca(OH)₂ per m³, depending on raw pH and color load, controlled by an inline pH loop with setpoint 10.0–10.5 at the equalization outlet.
Can a sugar mill ETP run without chemical dosing? No, not for raw influent above 2,000 mg/L COD and 1,500 Pt-Co color; biological stages alone cannot meet CPCB discharge limits of 250 mg/L COD, 30 mg/L BOD, or 100 mg/L TSS without coagulation-flocculation pre-treatment.
What is the payback period for a chemical dosing skid in a sugar mill? Typically 1–2 crushing seasons at 50 m³/h, driven by reduced biological-stage OPEX (20–35% aeration energy), lower sludge volume, and avoided SPCB non-compliance penalties.
Are sugar mill dosing systems skid-mounted and pre-wired? Yes, 2026 systems ship fully assembled on a common base frame with calibrated tanks, pre-piped metering pumps, a factory-tested PLC program, and HMI; site work is limited to power, water, and chemical connections over 1–3 days.