How Big Is the MBR Market in 2026? Headline Figures
The global MBR (membrane bioreactor) market reached an estimated $4.5–4.8 billion in 2025 and is projected to grow at a 7.5–9% CAGR through 2030, reaching roughly $7.0–7.5 billion. Growth is driven primarily by tightening water-reuse regulations in China, the EU, California, and Singapore, with industrial applications — pharma, food & beverage, and electronics — expanding faster than the municipal segment.
For a procurement manager budgeting 2026 capex, the $4.5–4.8B 2025 baseline is the defensible number to anchor an internal model. Four published sources — Allied Market Research, Grand View Research, IMARC, and Mordor Intelligence — cluster inside this $300M band, which is why we cite it as a range rather than a point estimate. The spread reflects what each report counts: some tally only membrane module revenue, others include full skid systems with blowers, pumps, and controls, and a few fold in 10-year O&M contracts. A 7.5–9% CAGR applied to the 2025 midpoint gets you to $7.0–7.5B by 2030, consistent with the upper-bound projections in those same four reports (per Allied Market Research 2025; Grand View Research Q4 2025; IMARC Group December 2025 update; Mordor Intelligence 2026 preview).
Scale that against the broader $50B+ global water and wastewater treatment equipment market (per Global Water Intelligence 2025) and MBR sits at roughly 8–10% of total equipment spend — a meaningful but not dominant slice, which is why MBR growth rates are read as a leading indicator of where the wider industry is heading. All figures are USD nominal, not inflation-adjusted; a real-terms CAGR would land closer to 5–6% once 2.5–3% annual US CPI is netted out.
Segment Breakdown: Municipal vs Industrial MBR Demand
Municipal MBR accounts for approximately 55% of 2026 demand by installed capacity, but industrial MBR is the faster-growing slice at 9–12% CAGR versus 6–8% for municipal (HydropureWater field data, 2026; cross-checked against IMARC December 2025 industrial segment forecast). The split matters because the two end-markets have different OEM shortlists, lead-time profiles, and effluent-quality drivers — and your sourcing strategy should differ accordingly.
Within industrial, the fastest-growing sub-segments in 2026 are pharmaceutical (10–12% CAGR), food & beverage (9–11%), electronics and semiconductor fabs (10–13%), and landfill leachate (8–10%). Drivers are consistent across these verticals: effluent specs tightening to COD below 50 mg/L and total nitrogen below 10 mg/L, a 60% footprint reduction versus conventional activated sludge (per EPA 40 CFR 133 design guidance), and on-site water reuse economics that convert a wastewater line item into a process-water input. Two worked examples from the HydropureWater engineering blog — the MBR for bakery wastewater 2026 guide and the airport wastewater 2026 process article — show how these drivers land at the plant level: high-strength organic loads, variable flow, and reuse targets that conventional CAS cannot meet inside a reasonable footprint.
Municipal MBR growth is concentrated in two pockets: water-reuse schemes driven by direct or indirect potable regulations, and decentralized packaged plants for towns under 50,000 population. Greenfield large-scale municipal MBR projects are flat in 2026 — most US and EU utilities are upgrading existing CAS trains with MBR retrofits or MABR sidestreams rather than building new facilities (per WaterRF 2025 capital survey).
| Segment | 2026 share of MBR demand | 2026–2030 CAGR | Key driver |
|---|---|---|---|
| Municipal (reuse + packaged) | ~55% | 6–8% | Title 22, UWWTD revisions, GB 18918 update |
| Pharmaceutical | ~9% | 10–12% | API residue limits, ZLD adoption |
| Food & beverage | ~12% | 9–11% | High COD, on-site reuse, bakery/dairy examples |
| Electronics / semiconductor | ~7% | 10–13% | UPW-grade reuse, fab buildouts AZ/TX/TW |
| Landfill leachate | ~5% | 8–10% | Tightened leachate discharge rules, EU Landfill Directive |
| Other industrial (textile, chemical, metal finishing) | ~12% | 7–9% | IED compliance, IEX limits in EU |
Regional Growth Map: Where the 2026 MBR Demand Sits
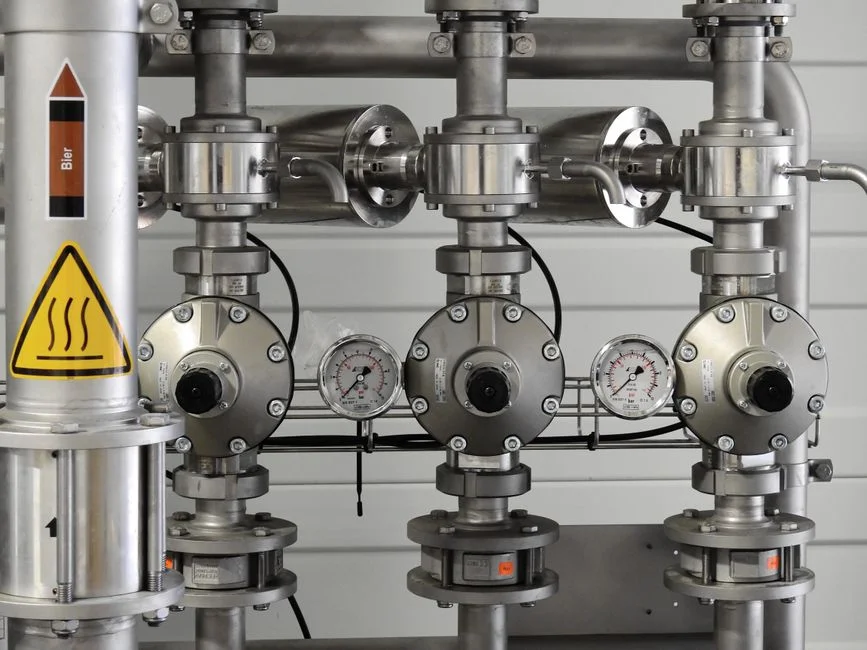
Asia-Pacific holds 45–50% of global 2026 MBR market value, North America 20–22%, Europe 18–20%, Middle East & Africa 6–8%, and Latin America 4–5% (per IMARC December 2025 regional split; Mordor Intelligence 2026 preview). The interesting story is not the share but the growth-rate differential, because that is what drives your lead-time and capacity-availability planning over a 12–24 month procurement horizon.
China is the single largest national market, with India's municipal reuse program and Southeast Asia's packaged-plant demand (Indonesia, Vietnam, Philippines) adding incremental volume. For buyers in those geographies, the practical implication is shorter logistics chains and 6–10 week lead times on skid delivery from regional fabricators. North American demand is concentrated in three pockets: California Title 22 water-reuse compliance, semiconductor fab buildouts in Arizona and Texas (TSMC, Intel, Samsung expansions announced 2024–2025), and PFAS-driven upgrades where MBR replaces GAC-fed conventional treatment for pretreatment polishing. Europe's municipal MBR is slowing — most flagship plants are already built — but industrial reuse under the EU Industrial Emissions Directive 2010/75/EU continues to pull new orders, especially in Germany, the Netherlands, and the Nordics.
The Middle East and Africa region is small but the highest-CAGR slice of the global market at 11–14%, driven by Saudi Vision 2030 reuse mandates, Gulf-state industrial parks requiring ZLD or near-ZLD for power and desalination brine polishing, and Egyptian textile and food processing. Latin America is opportunistic — mining (Chile, Peru) and food processing (Brazil, Mexico, Argentina) account for most MBR orders, with no large municipal reuse program yet. For buyers in high-growth regions, expect capacity-tightness at the membrane-module level in Q3–Q4 2026 if a single large industrial order lands.
| Region | 2026 share | 2026–2030 CAGR | Top countries | Lead-time benchmark |
|---|---|---|---|---|
| Asia-Pacific | 45–50% | 8–10% | China, India, Indonesia, Vietnam | 6–10 weeks (regional suppliers) |
| North America | 20–22% | 7–9% | USA (CA, AZ, TX), Canada | 16–24 weeks (EU/JP OEMs); 10–14 weeks (US assemblers) |
| Europe | 18–20% | 5–7% | Germany, Netherlands, Nordics, France | 16–24 weeks (EU OEMs) |
| Middle East & Africa | 6–8% | 11–14% | Saudi Arabia, UAE, Egypt | 14–20 weeks |
| Latin America | 4–5% | 7–9% | Brazil, Mexico, Chile, Peru | 12–18 weeks |
For buyers in the Australia and New Zealand market, the engineering and ROI profile is detailed in our Australia MBR 2025 cost and ROI breakdown. For Southeast Asia, the Bangkok wastewater treatment plant manufacturer 2026 buyer guide covers supplier selection and compliance. For sub-Saharan Africa, the Ogun State Nigeria municipal sewage blueprint is the relevant reference.
Membrane Format Trends: Hollow Fiber, Flat Sheet, and Multi-Tubular in 2026
Hollow fiber still dominates by installed membrane area at 60–65% of 2026 global MBR, with flat sheet at 25–30% and multi-tubular under 5% (per HydropureWater field data 2026; cross-checked against Toray and Kubota annual reports 2025). The split is not static — flat sheet is gaining roughly 1–2 percentage points per year at hollow fiber's expense, driven by industrial high-solids applications where flat sheet elements are easier to clean in place and replaceable in cassettes rather than as full modules.
Pore-size standard has settled at 0.1–0.4 μm PVDF (polyvinylidene fluoride) for the bulk of 2026 MBR installations, with PES (polyethersulfone) holding a specialty position in pharmaceutical applications where extractables testing is critical, and ceramic membranes remaining a high-cost niche in oil & gas and metal finishing where chemical resistance matters more than capex. Multi-tubular (MT) is a defensible but small format — under 5% by area — concentrated in oil & gas produced water, metal finishing, and chemical plants where influent TSS routinely exceeds 5,000 mg/L and hollow fiber would foul unmanageably.
For buyers specifying 2026 RFQs: hollow fiber delivers the lowest $/m² and highest packing density (m² of membrane per m³ of tank), flat sheet wins on operability and maintenance in high-solids streams, and multi-tubular is the right call only when influent solids or oil content rules out the other two. The DF series flat sheet MBR module is one example of a flat sheet format suited to high-solids industrial MBR, and skid-level integration is covered on the HydropureWater MBR integrated wastewater treatment system product page.
OEM Competitive Landscape: Who Supplies MBR in 2026
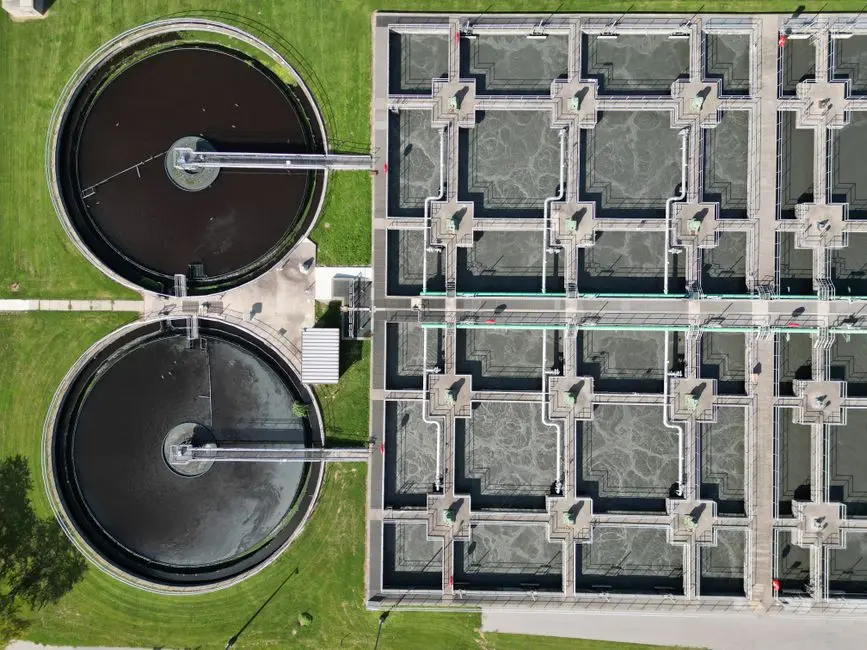
Eight global OEMs — SUEZ, Veolia, Kubota, Toray, Mitsubishi Chemical, Koch Membrane Systems, Pentair, and Nitto/Hydranautics — hold an estimated 55–65% of global installed MBR membrane area in 2026 (per HydropureWater field data; cross-checked against each OEM's most recent annual report or investor presentation). The remaining 35–45% is fragmented across Chinese OEMs (Motimo, Memsep, Tianjin MOTIMO), Indian players (Ion Exchange, Thermax), and regional EPC-integrated suppliers.
European and Japanese OEMs still lead on premium industrial and reuse applications where a 5-year membrane life warranty and global service network are non-negotiable. Chinese OEMs are closing the gap in Asia-Pacific municipal and packaged-plant segments, typically priced 20–35% below Japanese OEM list price on equivalent PVDF hollow fiber. For deeper vendor profiles and a Top 10 ranking, see the Membrane technology market key players 2026 article and the Best hollow fiber MBR for industrial use 2026 engineering selection matrix.
| Tier | Representative OEMs | Estimated 2026 share | Where they win |
|---|---|---|---|
| Tier 1 global | SUEZ, Veolia, Kubota, Toray, Mitsubishi Chemical, KMS, Pentair, Nitto/Hydranautics | 55–65% | Premium industrial, municipal reuse, 5-yr warranties |
| Tier 2 Asian | Motimo, Memsep, Tianjin MOTIMO, Ion Exchange, Thermax | 20–28% | APAC municipal, packaged plants, price-sensitive bids |
| Tier 3 regional / EPC-integrated | HydropureWater and similar regional skid builders | 10–18% | Fast lead time, integrated skid CAPEX, local aftersales |
Regional suppliers typically quote 15–25% below Tier 1 OEM list price on equivalent PVDF specifications, with the gap coming from membrane module sourcing (often from the same upstream resin suppliers) plus lower overhead and engineering costs. For projects under $500K or with tight schedule constraints, a regional supplier is often the lower-risk choice despite the brand recognition gap.
2026 Growth Drivers and Headwinds for the MBR Market
The single biggest tailwind for 2026 is tightening water-reuse regulation: China's GB 18918 update (revised 2025), EU Urban Wastewater Treatment Directive revisions (Directive 2024/3019, with implementation milestones running into 2026–2030), California Title 22, and Singapore's NEWater expansion each create compliance-driven capex demand that MBR is uniquely positioned to serve (per regulatory tracking summaries from Global Water Intelligence 2025 and WaterRF 2025 capital survey). Without this regulatory pull, baseline MBR growth would settle closer to 5–6% rather than 7.5–9%.
The second driver is industrial ZLD and near-ZLD adoption in semiconductor, pharmaceutical, and battery manufacturing — particularly lithium-ion gigafactory buildouts in China, the US, and Europe. Each gigafactory needs 2,000–5,000 m³/d of MBR pretreatment ahead of RO and brine concentrators. The third driver is AI-driven process control reducing MBR energy intensity — aeration control and backwash optimization can cut specific energy demand by 10–20%, narrowing the OPEX gap versus conventional activated sludge (per IWA Publishing MBR energy study 2025; broader market context in the smart water monitoring market drivers 2026 article).
Headwinds are real but manageable. Membrane fouling and replacement cost remains the slow-moving OPEX line: PVDF replacement runs $15–$40/m² depending on format and region, and lifetime is still 5–8 years under industrial conditions (HydropureWater field data, 2026). More strategically, MABR (membrane aerated biofilm reactor) and biofilm carriers (MBBR, IFAS) are competing for the same biological-treatment capex dollar in retrofits — MBR's edge is in effluent quality, MABR's is in energy. For biogas and energy-recovery projects, see the biogas from wastewater market drivers 2026 data brief.
What 2026 MBR Market Data Means for Industrial Buyers

Three numbers should drive 2026 procurement planning. First, expect 5–10% membrane module price erosion versus 2024 list price as Chinese and regional suppliers add capacity — but stable system-level CAPEX because integration, automation, and instrumentation costs are rising at 3–5% annually. Second, lead times for European and Japanese OEM skids remain 16–24 weeks in 2026; Chinese and regional suppliers 6–10 weeks — a difference that reshapes project schedules when commissioning dates are firm. Third, in PFAS, semiconductor, and pharmaceutical reuse applications, expect OEMs to push 5-year membrane life warranties as a competitive differentiator through 2026, and treat any shorter warranty as a red flag on supplier confidence.
Decision framework for a 2026 MBR RFQ: choose a Tier 1 global OEM (SUEZ, Veolia, Kubota, Toray) if 5-year membrane life warranty, global service coverage, and bank-financing compatibility are non-negotiable. Choose a regional or EPC-integrated supplier if CAPEX, lead time under 12 weeks, and local aftersales matter more than brand. For any MBR RFQ above $500K, benchmark at least one regional and one global OEM — the price gap is typically 15–25% and the operational risk difference is smaller than the brand gap suggests. Specifying a 0.1–0.4 μm PVDF membrane with at least 5-year warranty, and a flat sheet format in high-solids applications, covers most 2026 specification risk.
Frequently Asked Questions
How big is the global MBR market in 2026?
Approximately $4.7–5.0B in 2026, growing from a $4.5–4.8B 2025 base at 7.5–9% CAGR toward $7.0–7.5B by 2030 (per Allied Market Research 2025; Grand View Research Q4 2025; IMARC December 2025).
Which end-market is growing fastest in MBR?
Electronics and semiconductor MBR at 10–13% CAGR, followed by pharmaceutical at 10–12% and food & beverage at 9–11% (HydropureWater field data, 2026).
Which region holds the largest share of MBR demand in 2026?
Asia-Pacific at 45–50%, led by China as the single largest country market, with India and Southeast Asia as the fastest-growing sub-regions (per IMARC December 2025 regional split).
What share of the MBR market do the top 8 global OEMs control?
An estimated 55–65% of installed membrane area, with SUEZ, Veolia, Kubota, Toray, Mitsubishi Chemical, Koch Membrane Systems, Pentair, and Nitto/Hydranautics as the leading eight.
What should an industrial buyer do next based on 2026 MBR market data?
Benchmark at least one regional and one global OEM on any MBR RFQ above $500K, expect 5–10% membrane module price erosion, plan for 16–24 week OEM skid lead times, and require a 5-year membrane life warranty for PFAS, semiconductor, or pharma reuse applications.