What Counts as Smart Water Monitoring in 2026 — and Why the Market Sizing Varies
Three nested scopes explain the USD 19.56B–33.4B spread in 2026 smart water monitoring market sizing, and industrial buyers need to recognize the difference before they commit capex to a category definition they don't actually own. At the narrowest end, the Smart Water Monitoring Devices segment is forecast to grow at 11% CAGR between 2026 and 2033 — that's the hardware slice most plant engineers actually purchase: probes, meters, RTUs, and analyzers. At the middle layer, Polaris values the full Smart Water Management market at USD 19.56B in 2026, expanding to USD 43.78B by 2034 at a 10.60% CAGR. At the widest layer, Future Market Insights counts the Smart Water Grid infrastructure stack at USD 33.4B in 2026, reaching USD 62.6B by 2036 at 6.5% CAGR. MarketsandMarkets lands between those two with USD 28.84B in 2026 growing to USD 52.15B by 2032 at 10.4% CAGR, and separately reports that the services sub-segment is the fastest-growing line at 11.7% CAGR.
The practical implication is that vendors selling a software-only analytics package will quote the USD 33.4B figure to inflate the addressable market, while a hardware OEM will quote USD 19.56B or smaller to make their installed base look larger. Polaris notes North America held 37.20% share in 2025, making it the dominant regional market for 2026 procurement decisions. Anchor your internal sizing to the devices-and-services slice you actually buy, not the full-stack grid TAM.
| Scope Definition | 2026 Value (USD) | Forecast | CAGR | Source |
|---|---|---|---|---|
| Smart Water Monitoring Devices (hardware only) | — | — | 11.0% (2026–2033) | Industry tracking, 2026 |
| Smart Water Management (full stack) | 19.56B | 43.78B by 2034 | 10.60% | Polaris Market Research, 2026-06 |
| Smart Water Management (alternate) | 28.84B | 52.15B by 2032 | 10.4% | MarketsandMarkets, 2026-07 |
| Smart Water Grid (infrastructure) | 33.4B | 62.6B by 2036 | 6.5% | Future Market Insights, 2026-06 |
The Six Demand Drivers Accelerating Smart Water Monitoring in 2026
Six distinct demand drivers are pushing industrial and municipal buyers toward monitoring upgrades in 2026, and each one translates to a different line item in your next capex request. The first driver is IoT and AI integration: per Polaris' 2026 industry analysis, AI now handles real-time quality and consumption monitoring, ML-based leak and contamination prediction, and allocation optimization — moving analytics from a quarterly report to a control-room function. The second is aging infrastructure and non-revenue water (NRW) loss, cited as a sustaining demand driver in FMI's 2026 Smart Water Grid report; typical NRW in older networks runs 20–40%, which is the kind of operating-cost line that justifies a sensor capex in a single budget cycle. The third is regulatory tightening — EPA water quality monitoring requirements in the US, the EU Water Framework Directive driving utility digitalization, and tighter Chinese discharge standards are all compressing compliance windows.
Driver four is smart-city capex: the Infrastructure Investment and Jobs Act (IIJA) is anchoring US regional growth at 6.8% CAGR, Japan's smart-city program integration sits at 6.7%, and K-water smart grid programs in South Korea support 6.6% — these are not separate markets, they are the funding pools your plant may compete against or piggyback on. Driver five is industrial water reuse partnerships, and the May 2026 Xylem-Dow expansion and the two 15-year Veolia-Mumbai contracts announced in February 2026 are proof that long-term digital monitoring is now embedded in industrial and municipal capex structures. Driver six is AMI smart-meter rollout — per FMI 2026, residential is the largest connection base at 39.2% and municipal authorities are the primary procurement channel at 41.7%, but industrial sites increasingly adopt the same AMI backbone for sub-metering and discharge accounting. Funding signals also confirm the conviction: AquaExchange raised USD 8M in March 2026 and Oxyle raised USD 17.4M in August 2025 to scale AI water quality and PFAS-linked smart monitoring respectively. For the engineering context on compliance reporting, see the 2026 NPDES and EU IED self-monitoring requirements guide and the wireless sensor network architecture for wastewater.
Translating 2026 Market Drivers into Industrial Equipment Specs
Each of the six 2026 market drivers maps to a concrete monitoring equipment line item that should appear in an industrial RFP, not as an option but as a baseline requirement. Driver one (IoT/AI) maps to multi-parameter IoT probes covering pH, ORP, conductivity, dissolved oxygen, turbidity, and nitrate, with on-device edge-AI inference for anomaly detection — FMI 2026 reports smart infrastructure at 34.6% share, evidence that the hardware layer is where the capex is landing. Driver two (NRW and aging infrastructure) maps to leak detection sensor networks plus AMI smart meters with real-time consumption monitoring; for an industrial site, this becomes inline flow meters on effluent streams and pressure transient sensors on intake lines. Driver three (regulatory tightening) maps to continuous online monitoring analyzers (CEMS-style) with auto-reporting to regulators — the same architecture covered in the self-monitoring compliance guide linked above.
Driver four (smart-city capex) maps to SCADA-modernized telemetry with cloud-native dashboards; the wireless sensor networks guide is a reasonable starting topology for an industrial plant retrofit. Driver five (industrial reuse partnerships) maps to digital-twin integration for reuse loops — the Xylem-Dow May 2026 deal is the new normal for industrial reuse monitoring, and the digital twin wraps around physical hardware such as MBR systems for industrial reuse and industrial RO systems. Driver six (AMI rollout) maps to AMI-compatible sub-meters at process boundaries — this is the metering layer that justifies tariff and reuse credits at the discharge point. Cross-reference the 11.7% services CAGR from MarketsandMarkets: budget for integration services, not just hardware, since the services line is growing faster than the hardware line. For a worked example of edge-AI control logic on a sewage train, see the AI process control guide and the digital twin architecture for wastewater plants.
| 2026 Driver | Equipment Spec Line Item | Typical Industrial Location |
|---|---|---|
| IoT/AI integration | Multi-parameter IoT probe + edge-AI inference | Equalization basin, aeration tank, RO permeate |
| Aging infrastructure / NRW | Inline flow meters + pressure transient sensors | Intake, effluent manifold, reuse loop |
| Regulatory tightening | Continuous online analyzers with auto-reporting | Discharge outfall, sludge dewatering |
| Smart-city capex funding | SCADA RTU + cloud-native dashboard | Plant-wide telemetry backbone |
| Industrial reuse partnerships | Digital-twin interface to MBR/RO/DAF | Reuse header, boiler feed, cooling makeup |
| AMI smart-meter rollout | AMI-compatible sub-meter | Process boundaries, discharge point |
Regional 2026 Outlook: Where Industrial Buyers Should Localize Their Specs
Regional growth rates diverge enough in 2026 that an industrial buyer should localize specs to the regulatory and funding tailwinds at the specific site, rather than copy a global template. In the USA, FMI 2026 reports 6.8% CAGR anchored by IIJA federal infrastructure funding and EPA water quality monitoring requirements; the binding spec language is NPDES self-monitoring rules, including discharge monitoring report (DMR) cadence and QA/QC protocols. In the EU, 6.4% CAGR is driven by the Water Framework Directive, and industrial buyers should reference EU IED BAT-AEL monitoring requirements in their specs — these are the binding reference values for online analyzers. Japan at 6.7% and South Korea at 6.6% reflect aging-infrastructure renewal and smart-city program integration, with K-water smart grid programs as the reference architecture for AMI-heavy industrial buyers.
Emerging markets are now writing 15-year digital water capex contracts: the Veolia-Mumbai deal announced February 2026 is the template for long-tenure procurement in India and Southeast Asia, and it is a relevant signal for any regional buyer evaluating total-cost-of-ownership models. China continues to tighten discharge standards, which keeps industrial water monitoring demand on an upward slope; buyers operating in or supplying into China should align specs to the GB-series standards (not EPA or EU equivalents) to avoid re-engineering at the commissioning stage. For broader market context that regionalizes these drivers, see the 2026 industrial wastewater treatment market sizing.
2026 Procurement Checklist: What Smart Water Monitoring Lines to Put in Your RFP
The following 10 line items translate the six 2026 drivers and regional tailwinds into a copy-paste procurement checklist for an industrial RFP:
- Multi-parameter IoT probes with edge-AI inference (pH, ORP, DO, conductivity, turbidity, nitrate) — specify edge inference latency under 5 seconds and OTA firmware updates.
- Inline flow meters and pressure transient sensors on intake and effluent streams — specify ±1% accuracy and 4–20 mA or Modbus output.
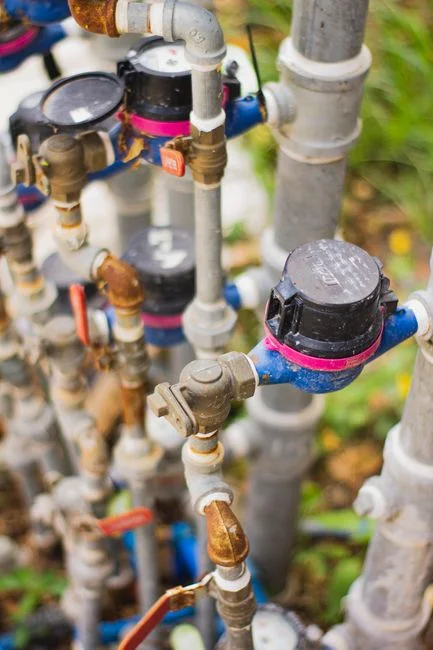
- AMI-compatible sub-meters at process and discharge boundaries — require multi-utility protocol support (LoRaWAN, NB-IoT, or equivalent).
- SCADA-modernized RTUs with cloud-native dashboard integration — see the SCADA and RTU architecture for industrial wastewater for a reference topology, and the PLC control guide for control-room integration.
- Continuous online monitoring analyzers for regulated parameters with auto-reporting capability to the regulator's data exchange format.
- Digital-twin interface to existing process equipment including MBR systems for industrial reuse, industrial RO systems, DAF pre-treatment with inline monitoring, and PLC-controlled chemical dosing.
- Cybersecurity and data-sovereignty clauses — increasingly a procurement gate in EU and US tenders, especially under NIS2 and CISA guidance.
- Integration services line item — budget against the 11.7% services CAGR from MarketsandMarkets rather than burying it in capex.
- Lifecycle and upgrade roadmap — 10–15 year contract structures are now the norm, per the Veolia-Mumbai deal.
- Open-protocol requirement (OPC-UA, MQTT) to avoid vendor lock-in as the market grows 10%+ annually.
Frequently Asked Questions
What is the size of the smart water monitoring market in 2026? Between USD 19.56B and USD 33.4B depending on whether you count the full smart water management stack (Polaris, 2026-06) or the smart water grid infrastructure layer (FMI, 2026-06); MarketsandMarkets sits in the middle at USD 28.84B (2026-07). The CAGR range across these three sources is 6.5% to 13.36%.
What are the top drivers of smart water monitoring adoption in 2026? Six: IoT/AI sensor integration, aging infrastructure and NRW reduction, EPA and EU regulatory tightening, smart-city capex (IIJA in the US, EU Water Framework Directive), industrial water reuse partnerships (Xylem-Dow, Veolia-Mumbai), and AMI smart-meter rollouts.
Which regions are growing fastest in 2026? USA at 6.8% CAGR (FMI, 2026-06), driven by IIJA funding and EPA requirements; Japan 6.7%; South Korea 6.6%; EU 6.4% under the Water Framework Directive.
What should industrial buyers specify in a 2026 RFP? Multi-parameter IoT probes with edge-AI inference, AMI/SCADA interoperability, continuous online analyzers with auto-reporting, digital-twin interfaces, and open-protocol requirements (OPC-UA, MQTT) to avoid lock-in.
What contract structures are emerging in 2026? Long-tenure deals: the two 15-year Veolia-Mumbai contracts (Feb 2026) and the Xylem-Dow industrial reuse expansion (May 2026) confirm that 10–15 year digital monitoring contracts are now the procurement norm, not the exception.