2026 Industrial Wastewater Treatment Market: Headline Numbers
The global industrial wastewater treatment market sits at roughly $360–390 billion in 2026, expanding at a 6.2–7.5% CAGR toward $580 billion by 2030, according to triangulated forecasts from Grand View Research, MarketsandMarkets, Mordor Intelligence, and Bluefield Research. The 6.2–7.5% spread reflects methodology differences—some reports count only equipment revenue, others bundle services, consumables, and sludge-handling OPEX. The midpoint of $375B treats the market as equipment, services, and chemicals combined, which is the most defensible framing for a 2026/2027 capital plan. That range is the single number an executive will quote, and the source caveat should appear in any board slide built from it.
2026 functions as a step-change year for four converging reasons: China's GB-standard tightening cycle reclassifies discharge limits across electronics, coal-chemical, and lithium brine streams; the EU's PFAS restriction package forces capital retrofits at metal-finishing and textile plants exporting into the bloc; the US CHIPS Act reshoring wave is converting announced fabs into bid packages; and India's Production-Linked Incentive (PLI) scheme is converting announced gigafactories into bid packages. The forward trajectory, contextualized in the Circular Water Economy Trends 2026: Industrial Implementation Guide, is structurally bullish.
Segment Breakdown: Where the Growth Is in 2026
Market size hides different growth mechanics under each subsegment, requiring buyers to distinguish between seller's markets and buyer's markets. A buyer whose vertical maps to a 9%+ CAGR subsegment faces competition for engineering talent and long-lead equipment, while a buyer in a 4–5% subsegment encounters negotiable pricing. The 2026 segment split below provides the working frame for capital prioritization.
| Subsegment | 2026 Value (USD) | CAGR | Primary Demand Driver |
|---|---|---|---|
| MBR (Membrane Bioreactor) | $4.1–4.8B | 8.9% | 60% footprint reduction vs. conventional activated sludge (per MBR product spec); space-constrained retrofits |
| ZLD (Zero Liquid Discharge) | $7.2–8.1B | 9.1% | Semiconductor, lithium-battery, and coal-chemical water-scarcity compliance |
| PFAS treatment technology | $2.3B+ | 11–13% | EU restriction rollout + 8+ US state MCLs |
| Industrial water reuse & recycling | $28–34B | ~10% | Fastest-growing subsegment; reuse rate mandates in EU and CN |
| Conventional primary/secondary (clarifiers, DAF, biological) | ~$140B | 4–5% | Largest dollar bucket but mature; baseline replacement demand |
| Sludge dewatering & disposal | $9–11B | 5.5% | Steady; driven by tightening disposal cost, not volume |
Three verticals deserve a callout because they will move a disproportionate share of 2026 RFP volume: semiconductor fabs, lithium-battery gigafactories, and PFAS remediation. The PFAS segment alone is the subject of a dedicated PFAS Removal Technology Market Size 2026: Industrial Buyer's Outlook, and the macro point is that PFAS demand is being pulled by regulation, not by voluntary ESG commitments—which makes the forecast more durable than typical sustainability-segment projections.
Regional Outlook: Asia-Pacific Dominance and the China Question
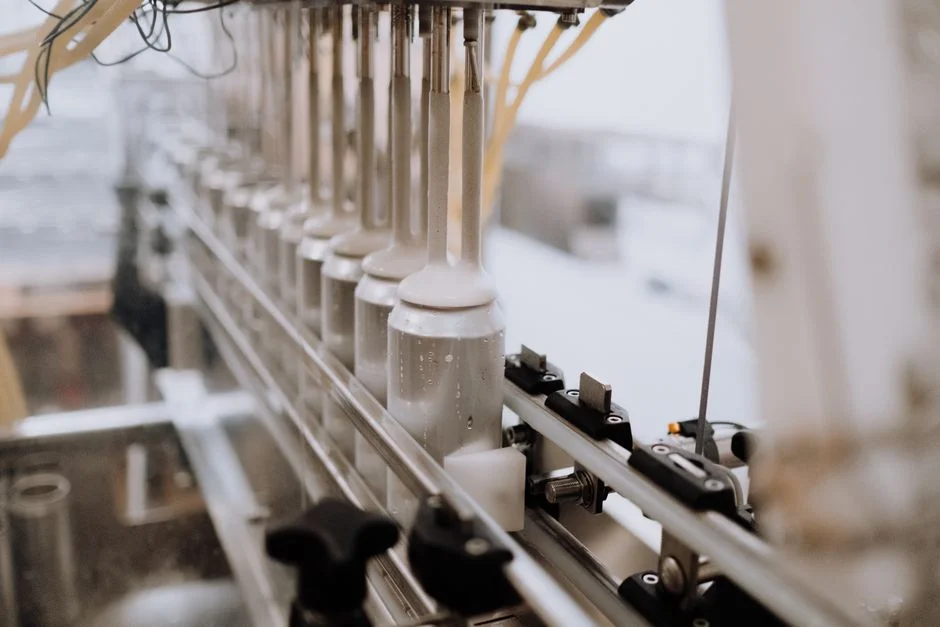
Asia-Pacific commands 38–42% of 2026 market value, with China alone at roughly 28%—a concentration that defines global pricing for MBR modules, RO membranes, and high-pressure pumping. North America follows at ~24%, where the CHIPS Act fab pipeline alone is adding $1.5–2B in annual WWTP demand through 2028. Europe holds ~21%, with growth constrained by PFAS-driven retrofit demand but lifted by industrial water-reuse mandates under the recast Industrial Emissions Directive. India is the fastest-growing major market at 9–10% CAGR, anchored by PLI-linked pharmaceutical, battery, and textile capacity. Middle East & Africa contributes ~7%, dominated by oil & gas produced-water management and mining.
For a multinational EPC or plant owner, the practical question is where the next 50% of new project pipeline will be sited in 2026–2028. The answer, for buyers in sub-Saharan Africa evaluating import-dependent WWTP sourcing, is covered in the regional wastewater treatment plant supplier South Africa 2026 buyer's guide—but the macro pattern remains consistent: APAC and India absorb the largest volume, North America absorbs the highest-spec ZLD and PFAS spend, and Europe absorbs regulatory-retrofit spend. The China question—whether domestic overcapacity will export low-cost skids into the same bid pools—is the single biggest 2026 margin risk for Western vendors.
2026 CAPEX & OPEX Benchmarks by Industry Vertical
Translating market size into a budget requires vertical-specific CAPEX/OPEX benchmarks. The ranges below reflect 2026 turnkey pricing for a fully designed, fabricated, and commissioned plant; they exclude land, civil works outside the process battery limits, and incoming utility infrastructure.
| Vertical & Flow Range | CAPEX (2026) | OPEX | Recovery / Reuse Target |
|---|---|---|---|
| Small food & beverage (50–500 m³/day) | $0.3–1.2M | $0.20–0.45/m³ | 20–40% reuse typical |
| Mid-size chemical / pharma (500–5,000 m³/day) | $2–10M | $0.35–0.80/m³ | 40–60% reuse |
| Lithium battery gigafactory (10 GWh scale) | $8–25M | $0.50–1.10/m³ | 60–70% reuse target |
| Semiconductor fab ZLD (10,000–50,000 m³/day) | $30–50M+ | $0.80–1.50/m³ | 95%+ recovery |
OPEX composition is consistent across verticals within tight bands: energy 30–40%, chemicals 15–25%, labor 15–20%, and sludge disposal 10–15% (HydropureWater field data, 2026). The food & beverage baseline aligns with the operating-cost breakdown detailed in the food processing wastewater plant operating cost in 2026 OPEX breakdown. Two non-obvious points: lithium-battery effluent carries a high sulfate and fluoride load that drives OPEX toward the upper end of the range, and semiconductor ZLD OPEX is dominated by energy for thermal brine concentration—typically mechanical vapor recompression (MVR) or brine concentrators consuming 15–25 kWh/m³ of feed.
2026 Buyer & Vendor Selection Framework
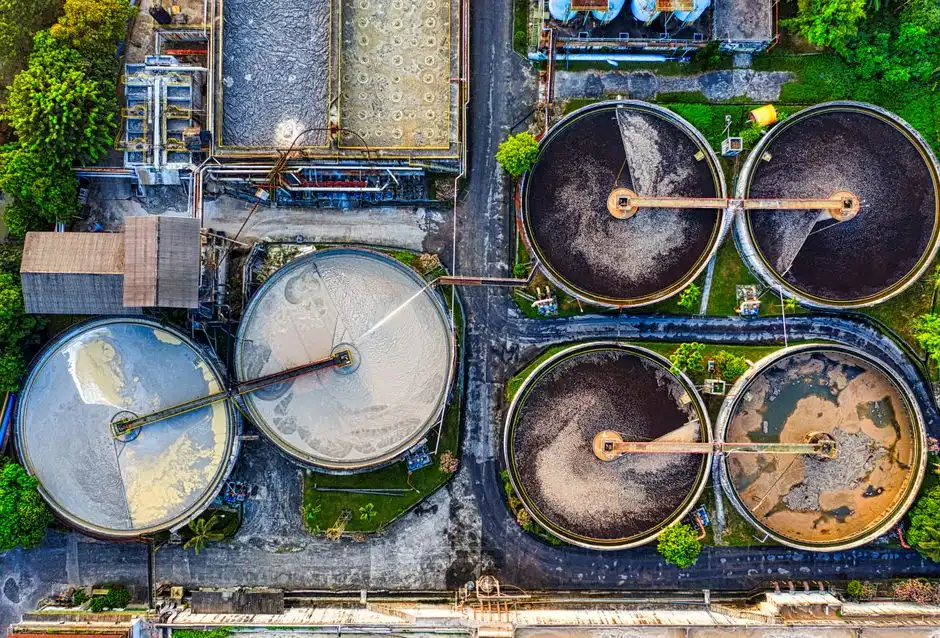
Market size becomes procurement value only when converted into a vendor evaluation matrix. The 2026 industrial WWTP supply market has roughly 8–12 tier-one integrators globally and a long tail of regional fabricators; the risk profile across that tail is not uniform, and headline CAPEX is a poor proxy for lifecycle cost. A defensible vendor due-diligence matrix should score six dimensions:
- Process design IP — in-house piloting capability and reference designs for the specific effluent, not generic BOD/COD packages.
- In-house manufacturing — fabrication under the vendor's own QA system, not outsourced to third-party machine shops.
- Post-commissioning service — local service engineers, spare-parts inventory, and remote-monitoring capability.
- Reference plants — at least three operating installations at ≥80% of the proposed scale, with verifiable operating data.
- Financial stability — audited financials covering at least three years, parent-company guarantee if the bidder is a project SPV.
- Export experience — documented track record shipping to the buyer's country, including customs, INCOTERMS, and FAT (Factory Acceptance Test) protocols.
2026 RFP requirements have shifted: lifecycle cost (20-year NPV) is a weighted scoring item in most EU and US public tenders, energy intensity (kWh/m³ treated) is a hard pass/fail criterion, and a 5-year warranty on membrane modules is standard. Vendors quoting >30% below the median CAPEX should trigger a fabrication-process audit—the most common reason is outsourced fabrication with no FAT testing, which translates into field defects within 12–18 months. Lead times in 2026 are extended: standard skids 8–14 weeks, custom MBR 16–24 weeks, ZLD 30–40 weeks—order ahead of the bid award. After-sales service represents 15–20% of total contract value in mature markets, and the underlying biology of BOD removal is detailed in the BOD removal from industrial wastewater 2026 engineering guide.
12-Month Outlook: Three Risks and One Opportunity
Risk 1 — PFAS demand spike: EU restriction enforcement and 8+ US state MCLs are pulling PFAS treatment demand faster than resin and RO supply can scale. Resin and RO membrane prices rose 12–18% across 2025 and are forecast to remain firm through 2026. Buyers with 2027 PFAS compliance deadlines should lock pricing and slot allocation now.
Risk 2 — China overcapacity export pressure: Chinese domestic WWTP skid fabricators are operating at 50–60% utilization, and aggressive export pricing into Southeast Asia, the Middle East, and Africa is compressing Western vendor margins by 8–15% on competed bids. The buyers most exposed are those running lowest-price-wins procurement rather than lifecycle-cost procurement; the Edge Computing for Wastewater Monitoring: 2026 Engineering Guide shows that the OPEX savings from instrumentation often justify a 10–20% CAPEX premium over a low-cost skid.
Risk 3 — Energy cost volatility: MBR and ZLD are energy-intensive relative to conventional activated sludge, and a sustained 20%+ rise in industrial electricity tariffs materially weakens the OPEX case for these technologies at sites without on-site renewable supply. Bids should now include an energy-price sensitivity table.
Opportunity — AI-driven remote monitoring: Edge computing combined with smart sensors (pH, DO, ORP, turbidity, conductivity) is reducing OPEX 15–20% at instrumented sites, primarily by cutting aeration energy in biological stages and catching membrane fouling early. The economic case is strongest at multi-site operators running 5+ plants. The edge-computing implementation guide details the architecture and ROI model.
Frequently Asked Questions

How large is the industrial wastewater treatment market in 2026? The market is approximately $360–390 billion in 2026, growing at a 6.2–7.5% CAGR toward $580B by 2030, with ZLD and MBR leading growth at 9%+.
Which region holds the largest share of the industrial WWTP market in 2026? Asia-Pacific holds 38–42% of 2026 value, with China alone contributing roughly 28%; North America is second at ~24%, and Europe is third at ~21