Why Bakery Wastewater Is a Special Case for MBR Design
Bakery effluent is not generic food-industry wastewater: a typical plant discharges BOD 1,500–4,500 mg/L, COD 2,500–8,000 mg/L, TSS 800–2,000 mg/L, and FOG 200–800 mg/L at pH 4–11 (CIP swings) and 25–45 °C, which makes it 6–18× stronger than municipal sewage at ~250 mg/L BOD. Production is batch-driven — dough mixing, oven condensates, wash-down, and clean-in-place chemicals all discharge in slugs rather than a steady diurnal curve, so a generic 24-hour equalization assumption underdesigns the equalization tank by a factor of two or more. Three membrane failure modes follow directly from this envelope: FOG blinding of the cake layer, starch gelatinization onto the membrane surface during hot CIP periods (gelatinization onset 60–70 °C, but residual gelatinous film forms at lower temperatures when starch-rich water contacts the membrane), and pH excursions from caustic CIP that crash nitrification if the biology is not buffered. Any MBR sized on municipal numbers will fail within weeks on this duty.
Bakery Wastewater Influent Characterization for MBR Sizing
Vendor RFQs and discharge permits both need a defensible influent table; the values below are sized to bracket normal operation and peak shift-end discharge. The BOD/COD ratio of 0.45–0.60 confirms the stream is highly biodegradable, so a conventional activated-sludge/MBR train works without advanced oxidation. FOG above ~100 mg/L will blind a submerged membrane, which is why DAF is treated as mandatory, not optional, in the next section. Bakery effluent is also frequently nitrogen-deficient relative to BOD (BOD:N often 60:1 or higher), so supplemental urea or ammonia dosing at 0.5–2 kg N per 1,000 kg BOD removed is common to sustain kinetics inside the MBR tank. For plants with butter-heavy or chocolate-coated product lines, the FOG ceiling can spike past 1,500 mg/L during wash-down, and pretreatment must be sized to that peak rather than the daily mean.
| Parameter | Typical range | Peak (shift-end) | Design implication |
|---|---|---|---|
| BOD₅ | 1,500–4,500 mg/L | 6,000 mg/L | Organic loading to bioreactor |
| COD | 2,500–8,000 mg/L | 12,000 mg/L | Sizing check; BOD/COD = 0.45–0.60 |
| TSS | 800–2,000 mg/L | 3,500 mg/L | Bar screen + DAF solids removal |
| VSS | 70–85% of TSS | — | Biodegradable fraction for MLSS/SRT |
| FOG | 200–800 mg/L | 1,500 mg/L | DAF required above 100 mg/L |
| Total nitrogen | 20–80 mg/L | 120 mg/L | Often deficient vs. BOD; may dose N |
| Total phosphorus | 5–25 mg/L | 40 mg/L | Generally sufficient; supplement if P-limited |
| pH | 4–11 | 2–12 (CIP) | Equalize + dose NaOH/H₂SO₄ to 6.5–8.0 |
| Temperature | 25–45 °C | 55 °C (oven wash) | Aeration tank cooling above 38 °C |
| Alkalinity | 150–400 mg/L as CaCO₃ | — | Buffer nitrification; supplement to ≥100 mg/L |
Parameter selection follows the MBR design fundamentals (CE-085): BOD and COD set the organic load, TSS/VSS drive pretreatment and ISS-in-MLSS calculations, N and P verify whether the stream is nutrient-sufficient for industrial waste, and alkalinity gates whether partial nitrification is even feasible. The FOG row is the one most often missed on generic food-industry MBR datasheets, and it is the single biggest reason bakery MBRs fail. For FOG removal and any associated phosphorus precipitation, a parallel reference on edible-oil wastewater FOG and phosphorus removal covers the chemistry in more detail.
Pretreatment Train: DAF, Grease Traps and Equalization Before the MBR
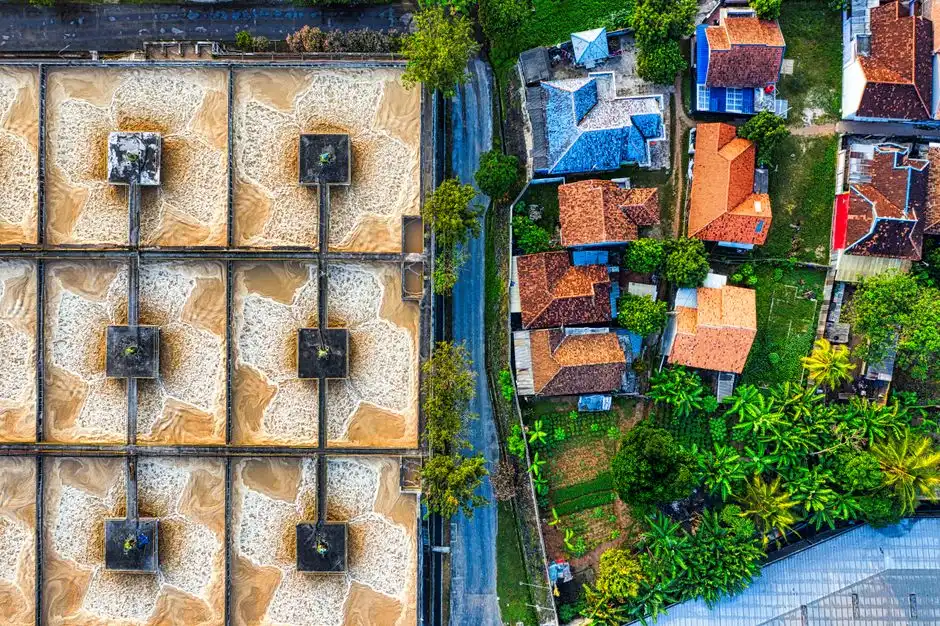
The pretreatment sequence is fixed by the failure modes above. A rotary mechanical bar screen at ≥2 mm aperture protects downstream pumps and the DAF from rags and packaging debris; a 24–48 h equalization tank with mechanical mixing and mild aeration buffers hydraulic and organic shock from batch discharges and prevents both solids settling and odor buildup, per the MBR fundamentals guidance on detention-tank mixing and aeration. The rotary bar screen feeds the equalization tank, which in turn feeds the upstream DAF unit sized to deliver FOG ≤50 mg/L and TSS ≤100 mg/L at a surface loading of 15–25 m/h, after which pH correction to 6.5–8.0 and nutrient dosing complete the feed conditioning. Skipping equalization is the most common engineering mistake on bakery MBRs: peak flux demand from an unbuffered dough-mix discharge can exceed 25 L/hr/m² for short periods, which the membrane cannot sustain and which collapses the cake layer, so a modified-distribution recirculation layout drawn from the full-scale bakery AD study is worth specifying at the headworks to flatten the feed curve.
Membrane Selection: Flat-Sheet PVDF vs Hollow-Fibre for Bakeries
Flat-sheet PVDF (0.1–0.4 μm, integrated coarse-bubble aeration box beneath each cassette) and hollow-fibre PVDF/PES (0.03–0.4 μm) are the two real options for submerged bakery duty. Five engineering axes determine the call: fouling tolerance to starch and FOG slugs, cleanability, packing density, air-scour energy, and replacement cost per m². Hollow-fibre has been proven on hydrocarbon-rich refinery wastewater (Al-Daura refinery, Arabian J. Sci. Eng. 2015), but refinery feed is steady-state; bakery feed spikes, and HF's tight fibre bundles trap sticky residues that backwash alone cannot dislodge. Flat-sheet panels in an aeration box keep the membrane surface continuously scoured by rising bubbles, so sticky films are stripped before they consolidate, and any panel can be lifted out, hosed down, and returned to service without draining the tank. The trade-off is packing density: flat-sheet sits at 80–120 m²/m³ versus 200–300 m²/m³ for hollow-fibre, so the aeration tank is larger. For bakery duty the fouling tolerance wins, and the recommendation is flat-sheet PVDF unless DAF pretreatment is already polishing FOG to <30 mg/L consistently. Quantitatively, flat-sheet submerged MBR runs at SADM 0.3 m³ air/hr/m² (per HydropureWater DF series datasheet, 2026), while external cross-flow HF needs 10–20× the specific energy — a 2–4 kWh/m³ gap that dominates OPEX.
| Criterion | Flat-sheet PVDF (e.g. DF series) | Hollow-fibre PVDF/PES |
|---|---|---|
| Pore size | 0.1–0.4 μm | 0.03–0.4 μm |
| Packing density | 80–120 m²/m³ | 200–300 m²/m³ |
| Air-scour SADM | 0.3 m³ air/hr/m² | 0.3–0.5 m³ air/hr/m² + cross-flow pump |
| Specific energy | 0.3–0.6 kWh/m³ permeate | 2–4 kWh/m³ permeate |
| Cleaning method | Relaxation + CIP; panel lift-out | Backwash + CIP; fibres cannot be inspected individually |
| FOG/starch tolerance | High (continuous air-scour) | Low–medium; requires tight DAF |
| Membrane life (bakery duty) | 7–10 years | 5–7 years |
| Replacement cost per m² | $80–$140 | $40–$80 |
MBR Process Design Calculations for a Bakery Plant
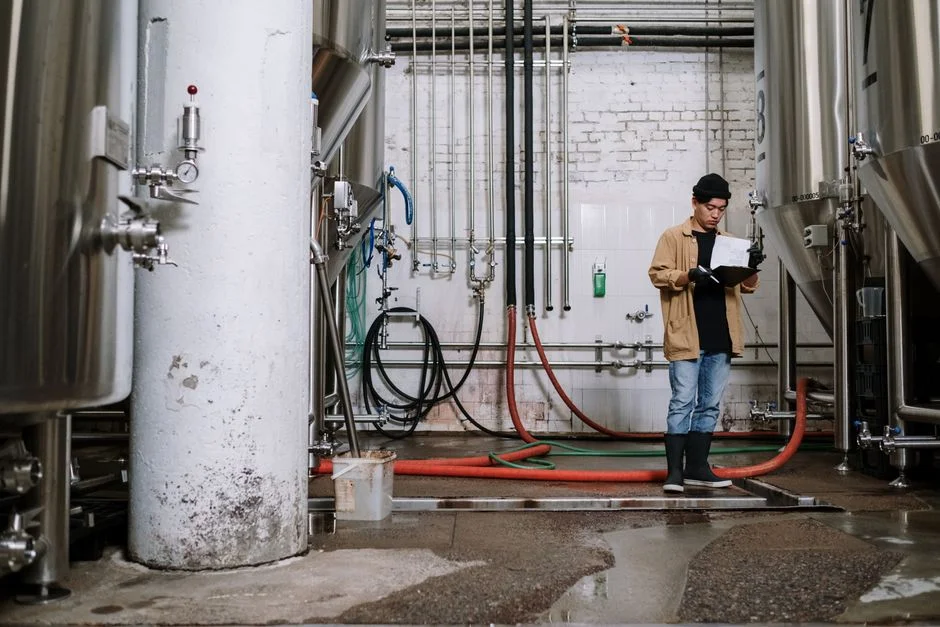
The standard MBR sizing chain (per CE-085) reduces to three equations: required membrane area A = Q ÷ J, module volume V = A ÷ φ, and scour-air flow Q_air = A × SADM, where Q is design flow, J is design flux, and φ is cassette packing density. Worked on a 500 m³/d bakery with J = 12 L/hr/m² and φ = 120 m²/m³, A = 500,000 L/d ÷ (12 L/hr/m² × 24 hr/d) = 1,736 m², V = 1,736 ÷ 120 = 14.5 m³ of submerged cassettes, and scour air = 1,736 × 0.3 = 521 m³/hr at the blower inlet. The biological envelope sits on top of that: MLSS 8,000–12,000 mg/L, SRT 20–40 days (long, so residual starch is mineralized rather than accumulating as unbiodegradable residue), HRT 6–10 h, F/M 0.05–0.15 kg BOD/kg MLSS·d, and dissolved oxygen 2–3 mg/L in the aeration zone. For partial nitrification on this COD-loaded feed, alkalinity must be held at ≥100 mg/L as CaCO₃; bakery effluent usually clears that bar naturally, but if NaOH is overdosed during pH correction alkalinity can drop and sodium bicarbonate supplementation at 1.5× the stoichiometric nitrification demand is the standard correction.
| Input | Symbol | Value |
|---|---|---|
| Design flow | Q | 500 m³/d (20.8 m³/hr) |
| Design flux | J | 12 L/hr/m² |
| Packing density | φ | 120 m²/m³ |
| SADM | — | 0.3 m³ air/hr/m² |
| Result: membrane area | A | 1,736 m² |
| Result: cassette volume | V | 14.5 m³ |
| Result: scour-air flow | Q_air | 521 m³/hr |
| MLSS | — | 8,000–12,000 mg/L |
| SRT | — | 20–40 days |
| HRT (aeration zone) | — | 6–10 h |
| F/M | — | 0.05–0.15 kg BOD/kg MLSS·d |
| DO (aeration zone) | — | 2–3 mg/L |
2026 CAPEX and OPEX Benchmarks for Bakery MBR Systems
Packaged bakery MBR systems in the 10–500 m³/d range run $280–$650 per m³/day of design capacity turnkey, including equalization, DAF, MBR cassettes, blowers, and PLC (2026 USD, HydropureWater project data). OPEX lands at $0.18–$0.42 per m³ treated, broken down as: aeration energy 45–55%, membrane cleaning chemicals 5–8%, membrane replacement amortized 15–20%, and sludge hauling 10–15%. PVDF flat-sheet membranes last 7–10 years with disciplined CIP, versus 5–7 years for HF; selecting a module with individually replaceable elements (e.g. the DF series) caps the worst-case replacement event at a single panel rather than a full cassette, which materially de-risks a 10-year CAPEX forecast. The full MBR operating-cost breakdown for 2026 goes deeper on the energy-savings levers. For a 500 m³/d plant, indicative installed CAPEX is $140,000–$325,000 with annual OPEX of $33,000–$77,000.
| Cost line | 2026 benchmark (10–500 m³/d) | Notes |
|---|---|---|
| Turnkey CAPEX | $280–$650 per m³/d | Includes DAF + cassettes + blowers + PLC |
| OPEX (total) | $0.18–$0.42 per m³ | Energy + chemicals + replacement + sludge |
| Aeration share | 45–55% of OPEX | Dominant line; blower VFD control saves 10–20% |
| Cleaning chemicals | 5–8% of OPEX | NaOCl + citric acid CIP, weekly to monthly |
| Membrane replacement | 15–20% of OPEX (amortized) | Flat-sheet 7–10 yr, HF 5–7 yr |
| Sludge hauling | 10–15% of OPEX | WAS at ~0.15 kg DS/kg BOD removed |
Effluent Compliance and Reuse Options for Bakery MBR Plants
An MBR sized and operated on the envelope above will typically deliver COD <50 mg/L, BOD <10 mg/L, TSS <10 mg/L, FOG <5 mg/L, and NH₃-N <5 mg/L (with a pre-anoxic denitrification stage); treat these as design targets, not guarantees, and verify on a pilot before contract award. Three discharge routes are available: (1) municipal sewer, generally the most lenient with BOD <300 / COD <500 mg/L limits; (2) direct surface-water discharge, where tighter ceilings apply under regimes like China GB 8978 Class I, the EPA industrial categorical standards, and the EU IED; (3) on-site reuse for cooling-tower makeup, boiler feed (after polishing RO), and landscape irrigation, where MBR effluent must be paired with reverse osmosis and a chlorine dioxide disinfection step for microbiological safety. Continuous trending of TSS, turbidity, and transmembrane pressure is mandatory for any membrane plant — operators that skip this layer are the ones who replace membranes in year three instead of year eight. The wastewater self-monitoring compliance guide lays out the reporting cadence regulators expect in 2026. Plants that want a single-vendor scope often pair the MBR train with an integrated packaged MBR system that bundles equalization, DAF, MBR, and disinfection in one skid.
Frequently Asked Questions
What design flux should I use for a bakery MBR?
12 L/hr/m² is the safe working flux for bakery effluent on flat-sheet PVDF, with 10 L/hr/m² as a conservative floor and 15 L/hr/m² only when DAF is polishing FOG below 30 mg/L consistently. These align with the CE-085 worked example range of 10–15 L/hr/m².
What is the maximum FOG a submerged MBR can tolerate?
Influent FOG above ~100 mg/L will foul a submerged membrane within days; DAF pretreatment must guarantee FOG ≤50 mg/L to the MBR feed, and ≤30 mg/L if the plant wants to run at the high end of the flux range.
How long do PVDF flat-sheet membranes last on bakery duty?
7–10 years with disciplined CIP (weekly–monthly NaOCl + citric acid), versus 5–7 years for hollow-fibre; selecting individually replaceable panels (DF series) avoids full-cassette replacement events.
What is the 2026 OPEX for a bakery MBR?
$0.18–$0.42 per m³ treated for packaged systems in the 10–500 m³/d range, dominated by aeration energy at 45–55% of OPEX; a VFD-controlled blower typically saves 10–20% on the energy line.
Is on-site water reuse realistic for a bakery?
Yes — MBR + RO + ClO₂ routinely hits the microbiological and TDS targets for cooling-tower makeup and boiler feed; landscape irrigation is achievable without RO but requires pathogen monitoring per local regulations.
Do I need pre-anoxic denitrification on bakery effluent?
Only if the discharge limit on total nitrogen is below ~20 mg/L; the stream is carbon-rich and nitrogen-poor, so a pre-anoxic stage sized at 30–40% of the aeration volume gives reliable denitrification when alkalinity is held at ≥100 mg/L as CaCO₃.