MBR operating cost per cubic meter runs $0.18–$0.65 for municipal and light-industrial plants in 2026, with energy at 40–55% of OPEX and amortized membrane replacement at 10–20%. Scale, module geometry, and design flux set the final number.
What Drives MBR Operating Cost per Cubic Meter in 2026
Expect $0.18–$0.65 per cubic meter treated at 0.3–0.8 kWh/m³ specific energy. Energy takes 40–55% of the budget, membrane replacement 10–20% amortized over a 5–8 year PVDF life, and chemicals, labor, and sludge handling share the remainder. Submerged flat-sheet designs cut energy 10–20× versus external cross-flow systems.
The full cost equation is straightforward: OPEX = Energy + Membrane replacement (amortized) + CIP/cleaning chemicals + Spare parts + Labor + Sludge handling + Disposal + Testing/analytical. Each term has a typical range, a dominant driver, and a controllable design lever. Engineers who defend the OPEX line-item by line-item — rather than as one number — can justify every dollar in front of a CFO.
Against a conventional activated-sludge baseline, MBR OPEX runs 15–30% higher for the same influent. The premium comes from elevated MLSS (8,000–12,000 mg/L vs. 2,000–4,000 mg/L in CAS), fine-bubble aeration for both biology and membrane scouring, and membrane maintenance. MBR offsets it by eliminating secondary clarifiers, tertiary sand filters, and most of the UV polishing step. Footprint drops 40–60% on the same flow — a CAPEX credit that often makes MBR cheaper on 5-year TCO (see the MBR cost in food processing benchmark, 2026).
Independent process references corroborate the geometry gap. According to Wikipedia's membrane-bioreactor overview, submerged-configuration energy demand sits up to two orders of magnitude below side-stream systems. That is an upper bound; day-to-day industrial duty shows the 10–20× advantage recorded in our field data.
Scale matters. Plants under 500 m³/day typically see $/m³ climb 30–50% above benchmark, because labor, analytical, and standby-power fixed costs spread over fewer cubic meters. Above 5,000 m³/day, full automation and bulk chemical procurement push $/m³ toward the low end of every range. Normalize OPEX to a specific flow and load before comparing vendor quotes.
OPEX only makes sense against the effluent quality it buys. MBR permeate typically meets discharge and reuse targets without tertiary polishing, which is where the CAS comparison loses ground. The removal-rate side of that trade-off is covered in MBR Effluent Quality: Specs, Removal Rates and Selection Guide. For budgeting, treat tighter reuse targets as an OPEX driver: they push flux down and CIP frequency up.
MBR OPEX Breakdown by Cost Category (2026 Numbers)
Energy is the single largest OPEX line in any MBR. At 0.3–0.8 kWh/m³ and an industrial tariff of $0.08–$0.12/kWh, the bill lands at $0.03–$0.10/m³ — typically 40–55% of the total. The load splits between biological aeration (60–70% of blower kWh) and membrane scour aeration (30–40%). The dominant control lever is the blower: VFD-controlled high-efficiency turbo blowers cut specific energy 15–25% versus fixed-speed roots blowers at the same dissolved-oxygen setpoint.
MBR Membrane Replacement Cost Breakdown
Membrane replacement is the second-largest cost and the most frequently mis-modeled. Amortized over a 5–8 year PVDF service life, flat-sheet modules at $80–$150/m² translate to $0.02–$0.06/m³. Hollow-fiber PVDF modules at $40–$90/m² amortize to a similar range because their service life is shorter (4–6 years). Tubular ceramic or stainless-backed membranes run $200–$400/m² but last only 3–5 years, pushing amortized cost to $0.06–$0.12/m³.
Design expectations back these ranges. According to Wikipedia, wastewater membranes are generally specified for five years of chemical and mechanical resistance, so amortization models built on shorter lives deserve scrutiny. Treat any vendor quote that does not separate module cost from expected service life as incomplete (HydropureWater DF series module data, 2026).
The table below is the copy-pasteable model an engineer can drop into a spreadsheet and tune for site-specific flow, load, tariff, and labor rate.
| Cost Category | Unit Cost Range | Typical % of OPEX | Dominant Driver | Reduction Lever |
|---|---|---|---|---|
| Energy (blowers, pumps, mixers) | $0.03–$0.10/m³ (0.3–0.8 kWh/m³ @ $0.08–0.12/kWh) | 40–55% | Aeration for biology + membrane scour | VFD turbo blowers; intermittent scour (4 min on / 1 min off) |
| Membrane replacement (amortized) | $0.02–$0.06/m³ over 5–8 yr life | 10–20% | Module $/m² × replacement frequency | Operate at design flux; avoid chemical-shock CIP; pre-treat FOG/fiber |
| CIP & cleaning chemicals | $0.01–$0.04/m³ | 5–10% | NaOCl + citric acid 1–2×/yr per train | In-situ backwash weekly; vendor-recoverable cleaners; correct pH |
| Spare parts (pumps, instruments, diffusers) | $0.01–$0.03/m³ | 5–8% | Rotating equipment wear | Condition monitoring; 3-yr parts kit per train |
| Labor | $0.005–$0.08/m³ | 5–20% | Operator hours per m³ | Full SCADA automation at >2,000 m³/day |
| Sludge handling & disposal | $0.02–$0.05/m³ | 8–15% | WAS yield 0.3–0.5 kg DS/kg COD removed | Target lower SRT; dewater to >22% DS; beneficial reuse |
| Testing, analytical, compliance | $0.01–$0.02/m³ | 3–5% | COD, TSS, NH₃, membrane integrity (per EPA 40 CFR 133 for municipal) | Online sensors; monthly vs weekly lab cadence |
Flat-Sheet vs Hollow-Fiber vs External Tubular: OPEX Comparison
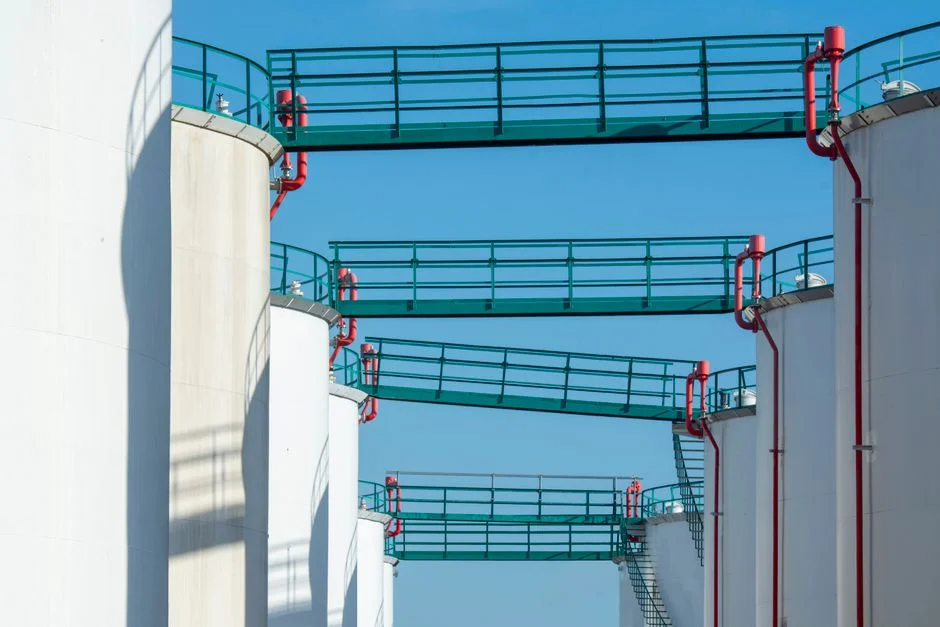
Module geometry is the single design choice that most affects MBR operating cost, and the three mainstream options differ by an order of magnitude on energy. Flat-sheet submerged modules — the submerged PVDF flat-sheet MBR module in our lineup — run on suction with coarse-bubble scour, with no recirculation pump and no high cross-flow velocity. Hollow-fiber modules use a similar suction-plus-air-scour arrangement but pack more membrane area per cassette, which slightly raises aeration demand at equivalent flux. External cross-flow tubular modules recycle permeate at 1–3 m/s to keep foulants suspended, and that recirculation pump alone consumes 2–6 kWh/m³ — 10–20× the flat-sheet number (HydropureWater DF product data, 2026).
Submerged Flat-Sheet MBR Energy Consumption and the Alternatives
Submerged flat-sheet MBR energy consumption settles at 0.2–0.4 kWh/m³ for membrane plus scour duty, against 0.3–0.6 kWh/m³ for submerged hollow-fiber and 2–6 kWh/m³ for external tubular. According to Wikipedia, modern low-energy side-stream systems can sustain operation at 0.3 kWh/m³ of product, though general industrial duty rarely achieves it. The comparison below compresses the decision.
| Parameter | Submerged Flat-Sheet (PVDF, 0.1 μm) | Submerged Hollow-Fiber (PVDF) | External Cross-Flow Tubular |
|---|---|---|---|
| Specific energy (membrane + scour) | 0.2–0.4 kWh/m³ | 0.3–0.6 kWh/m³ | 2–6 kWh/m³ |
| Module cost | $80–$150/m² | $40–$90/m² | $200–$400/m² |
| Typical service life | 5–8 years | 4–6 years | 3–5 years |
| Amortized replacement | $0.02–$0.04/m³ | $0.02–$0.05/m³ | $0.06–$0.12/m³ |
| Cleaning frequency | 1–2 chemical CIPs/yr per train | 2–4 chemical CIPs/yr per train | Monthly CIP; routine chemical flush |
| Best-fit stream | Municipal, light industrial, food | High-loading industrial, packaged systems | High TSS (>500 mg/L), oily/FOG, difficult-to-treat |
| Element-level replacement | Yes (per-element swap) | No (full-module swap) | No (tube-bundle swap) |
The verdict for a procurement decision: flat-sheet wins on energy and element-level serviceability, which directly lowers labor cost. Hollow-fiber wins on packing density and lower module price, which matters when civil footprint is the constraint. External tubular belongs on streams where fouling is otherwise unmanageable — high TSS, high FOG, or shear-sensitive industrial effluent — because its energy bill alone disqualifies it for general use. For a packaged approach, an integrated MBR wastewater treatment system typically pairs flat-sheet modules with a pre-engineered CIP loop, holding installed cost low without giving up the energy advantage.
Reduce MBR Operating Cost Design Levers: Five You Can Specify
Every line item in the cost table is controlled by an engineering parameter. The five levers below are the ones a process engineer can move during design or early commissioning, each with quantifiable impact on $/m³. Most plants we size for settle at the conservative end of these ranges — the savings come from discipline, not exotic hardware.
1. Hold MLSS at 6,000–10,000 mg/L. Designers often push MLSS to 12,000–15,000 mg/L to shrink tankage. Above 10,000 mg/L, mixed-liquor viscosity rises non-linearly and aeration efficiency drops 15–25% at the same DO setpoint, with no effluent-quality benefit for BOD/TSS removal — only higher blower kWh and worse fouling. Target 8,000 ± 2,000 mg/L and use a wasting pump on a timed cycle, not on concentration alone.
2. Design flux at 15–20 L/m²·h for municipal, 10–15 L/m²·h for industrial. Oversizing flux is the single most common cause of premature membrane replacement. A flat-sheet module rated at 25 L/m²·h will run, but at 25 it fouls faster, requires more CIP, and lasts 3–4 years instead of 7. The cost of one extra membrane cassette ($30,000–$60,000) pays for a permanently derated design that lasts 7+ years.
3. Use intermittent membrane scour. Continuous coarse-bubble scour at 0.3–0.5 m³ air/m³ tankage is the textbook default. In practice, a 4-min-on / 1-min-off cycle delivers the same shear at the membrane surface with 20% less air. That saving lands directly on the scour blower, the second-largest aeration load after the biology.
4. Specify VFD-controlled high-efficiency blowers. A turbo blower with a variable-frequency drive at 70% speed uses roughly 50% of the power it draws at full speed. Across a 24-hour diurnal flow pattern, that yields 15–25% blower-kWh reduction versus a fixed-speed roots blower with a discharge bypass. Payback is typically 2–3 years on the blower premium.
5. Pre-treat aggressively. A 2-mm rotary mechanical bar screen upstream of the MBR tank plus a dissolved air flotation unit for FOG removal cuts chemical CIP frequency in half and routinely extends membrane life by 1–2 years. The pre-treatment equipment pays back inside the avoided membrane replacement alone.
Add a weekly in-situ backwash (permeate + air) and a quarterly maintenance CIP (NaOCl 500 mg/L, then citric acid 1,000 mg/L) instead of waiting for trans-membrane pressure to spike, and service life extends another year. Design-side discipline on these five parameters is the difference between an MBR that runs at $0.20/m³ and one that runs at $0.55/m³.
MBR OPEX for Industrial Wastewater 2026: Anchors and Warnings
Industrial loads move every line in the OPEX table, mostly upward. At the low end, a 1,000 m³/day MBR treating light-industrial effluent (BOD <500 mg/L) lands near $0.18/m³. At the high end, a 200 m³/day plant on high-strength food-processing wastewater (COD >5,000 mg/L) with full-time operators can approach $0.65/m³. These two anchors are the cheapest and most expensive realistic cases in the HydropureWater 2026 dataset.
MBR Cost per m3 Food Processing Wastewater
Food-processing streams anchor the expensive end of the industrial range. COD, FOG, and protein loads raise CIP frequency, sludge yield, and aeration demand at the same time, which is why quoted $/m³ scatters between two plants with the same nameplate flow. The animal feed wastewater OPEX benchmark sits at the $0.18/m³ floor and works as a sanity check for low-strength applications.
One warning for high-strength streams: above 3,000 mg/L COD or 500 mg/L TSS, MBR OPEX climbs sharply because membrane fouling accelerates and CIP frequency triples. In that regime, a hybrid MBBR + MBR, or an MBR preceded by DAF, holds the OPEX line better than a standalone submerged train. Silica-laden dicing effluent is a different problem again — see our ceramic membrane water notes for ultrafiltration on that stream.
5-Year Total Cost Sanity Check: MBR vs CAS + Tertiary Filtration
The OPEX premium of MBR is real, but it is recovered — and usually exceeded — by CAPEX and footprint savings. A CAS train plus a secondary clarifier, a tertiary sand filter, and a UV polish step costs $50–$150/m³ of nameplate capacity in equipment alone. MBR consolidates all of that into one tank plus a membrane cassette, dropping equipment CAPEX 20–35% on the same flow. Civil works drop further: MBR footprint is 40–60% of an equivalent CAS + tertiary layout.
Compliance obligations frame both options. According to the US EPA, secondary treatment standards for publicly owned treatment works are minimum, technology-based requirements, expressed in terms of BOD5, TSS removal, and pH. An MBR clears those targets with margin; a CAS train reaches them only with clarifier and tertiary help.
On a 5-year TCO basis, MBR typically wins by 5–15% at the 500–5,000 m³/day scale where most municipal tenders and industrial retrofits sit. Below 200 m³/day the labor OPEX premium offsets the CAPEX win; above 10,000 m³/day the MBR advantage widens because clarifier hydraulics become the bottleneck for CAS trains. The 2026 MBR market data shows the global market at $3.4–5.4B with 5.3–7.75% CAGR — capital is voting that the TCO math closes. For a line-by-line worksheet, our mbr vs. cas: capital and operating cost evaluation walkthrough frames each line item as a decision.
Next Steps for a Defensible MBR Budget
Who this is for: plant owners weighing MBR against CAS + tertiary at the 200–10,000 m³/day scale, and EPC teams pricing OPEX into tenders. Who should look elsewhere: high-FOG, high-silica, or sub-100 m³/day streams, where DAF-first or ultrafiltration-first designs usually win. Run your flow, load, and tariff profile through our quote request for a line-item OPEX model on the MBR Membrane Bioreactor Wastewater Treatment System.
Before signing, check the quote against this list:
- Module cost quoted separately from service life, with $/m² and replacement year visible.
- Blower type and control named — VFD turbo, not fixed-speed with a discharge bypass.
- Design flux stated: 15–20 L/m²·h municipal, 10–15 L/m²·h industrial.
- Scour strategy written down: intermittent cycle with on/off times in minutes.
- Pre-treatment included: 2-mm screening minimum, DAF when FOG exceeds limits.
- CIP chemicals costed per train per year, sodium hypochlorite plus citric acid.
- Labor model stated: operator hours per day at your plant size.
Frequently Asked Questions
What is the typical MBR operating cost per cubic meter in 2026?
MBR operating cost in 2026 runs $0.18–$0.65/m³ for municipal and light-industrial applications, with food-processing and high-strength industrial streams at the upper end. Energy alone is 40–55% of the total (HydropureWater field data, 2026). Normalize any quote to your flow, load, and tariff before comparing it with these benchmarks.
How much energy does an MBR use per m³?
Submerged flat-sheet and hollow-fiber MBRs use 0.2–0.6 kWh/m³; external cross-flow tubular MBRs use 2–6 kWh/m³. Most of that energy is biological aeration, with membrane scour as the second-largest load. Wikipedia's process overview puts submerged-configuration demand up to two orders of magnitude below side-stream systems, matching the geometry table above.
How often do MBR membranes need to be replaced?
PVDF flat-sheet modules last 5–8 years, hollow-fiber 4–6 years, and tubular 3–5 years under normal operating conditions. Aggressive pre-treatment and derated flux extend service life by 1–2 years (HydropureWater DF field data, 2026). Amortize module price over the matching life, not the vendor's best case, when modeling replacement cost.
What is the cheapest MBR module geometry to operate?
Submerged flat-sheet PVDF has the lowest operating cost, combining 0.2–0.4 kWh/m³ specific energy, 5–8 year service life, and element-level replaceability that reduces labor (HydropureWater DF product data, 2026). Hollow-fiber wins only when packing density or module price dominates the decision. External tubular stays reserved for the high-TSS, high-FOG streams its energy bill can justify.
Does MBR OPEX go down at larger scale?
Yes. Plants above 5,000 m³/day with full automation reach $0.005/m³ labor and bulk chemical pricing, while plants under 500 m³/day typically see 30–50% higher $/m³ across every cost category. Normalize OPEX to flow before comparing vendor quotes, and check that fixed costs spread over realistic utilization rather than nameplate capacity.