30-Second Field Triage: What Type of Foam Are You Looking At?
Sludge foaming in an aeration basin falls into three diagnostic categories that an operator can separate in under a minute at the basin edge: (1) white, billowy foam from a young sludge with F/M above 0.25 and MCRT too short, fix by reducing wasting; (2) dark, greasy, persistent brown foam from old sludge colonized by Nocardia or Microthrix parvicella at high MCRT, fix by increasing WAS to drop sludge age; (3) transient white surfactant foam from a cleaning chemical or industrial discharge, which subsides within hours. Confirm with a 100× microscope slide before treating (Bitton, 2010, Chapter 10; wastewaterace.com troubleshooting guide).
The persistence test is the single most useful field discriminator. Nocardia and Microthrix foam re-forms within 24–48 hours of physical removal because the hydrophobic filaments re-float on the air-liquid interface; surfactant foam is typically gone in 2–6 hours once the discharge ends. Biological foam also mats into a tan-to-chocolate greasy layer; surfactant foam is bright white, frothy, and often localized near the influent end of the basin where the discharge enters. Cross-check your visual read against the symptom-to-cause table below, then walk back to the lab for the slide.
| Foam Appearance | Most Likely Cause | First Triage Action | Time to Confirm |
|---|---|---|---|
| White, crisp, billowy | Young sludge (F/M > 0.25, MCRT too short) | Reduce WAS, raise MLSS toward 2,500–4,000 mg/L | 4–7 days for SVI response |
| Dark, greasy, brown, matted | Old sludge with Nocardia/Microthrix parvicella | Increase WAS, drop MCRT by 1–3 days | 1–2 sludge ages for full correction |
| Bright white, frothy, localized | Surfactant or cleaning discharge | Check shift log, do not adjust biology | 2–6 hours to clear |
| Light tan, thin layer, stable | Well-balanced process | No action — normal | Continuous |
For operators juggling multiple basin upsets at once, the same diagnostic logic that classifies foam also classifies digester upsets, and the anaerobic digester troubleshooting guide applies the same persistence-and-color test to scum and foam in digesters.
Foam Type 1: Young-Sludge White Foam (F/M Too High, MCRT Too Short)
White, crisp, billowy foam on the aeration basin surface is the signature of a young, underoxidized sludge where F/M is above 0.25 and MCRT sits below the design range (wastewaterace.com activated-sludge troubleshooting guide; wxwatertech.com process control table). The floc is too thin to bind the surfactants released during substrate metabolism, so the foam crests at the surface instead of staying bound in the mixed liquor. Confirm with two measurements: a calculated F/M and an MLSS reading, then cross-check against the SVI trend over the prior 7 days.
The corrective action is to lengthen MCRT, not to chase the foam with chemistry. Reduce the wasting rate to push MLSS back into the 2,500–4,000 mg/L band typical of conventional activated sludge, or step RAS up to build inventory. Expect 4–7 days before the foam visibly recedes, because the biomass has to grow into the new sludge age. Two short-term foam control shortcuts are available while biology catches up: a fine-bubble diffuser grid upgrade to raise dissolved oxygen above 1.5–2.0 mg/L, and a sidestream RAS chlorination at 2–5 mg/L for short-term foam knockdown. Both buy time without masking the root cause.
SVI is the primary trending indicator for this condition and should be plotted daily rather than read as a single number (wastewaterace.com, activated-sludge troubleshooting guide). A single elevated reading is noise; a consistent upward trend over 7 days is the signal to act. For plants where F/M swings are chronic rather than event-driven, the long-term fix is to decouple sludge age from hydraulic retention, which is exactly what an MBBR engineering guide describes in detail.
Foam Type 2: Nocardia and Microthrix Brown Foam (Old Sludge, High MCRT)
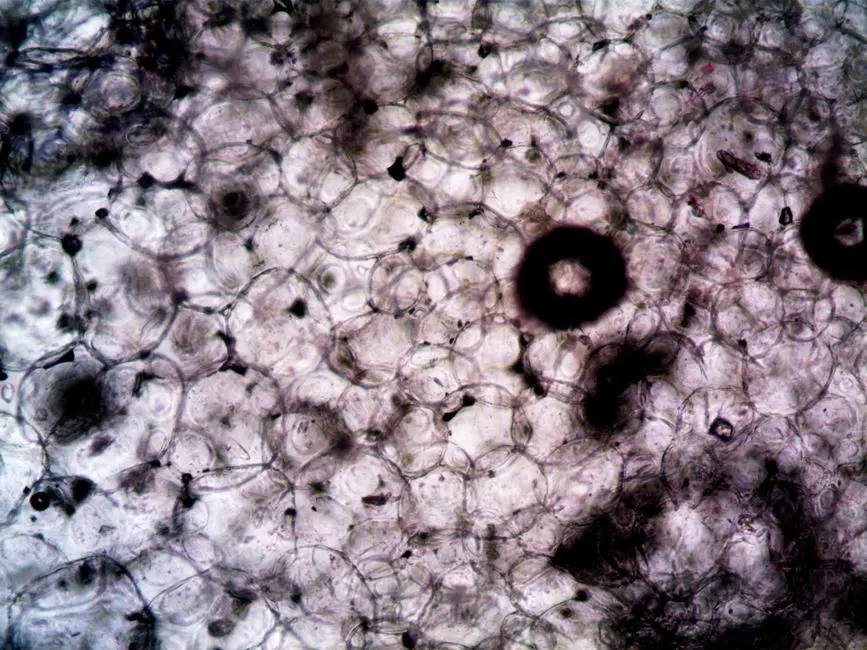
Dense, dark, greasy brown foam that mats up at the basin surface is the signature of an old sludge in the endogenous zone, colonized by Nocardia or Microthrix parvicella filaments (Bitton, 2010, Chapter 10; wxwatertech.com troubleshooting guide). Both organisms are hydrophobic, both attach to air bubbles, and both float preferentially into the foam layer. Confirm under the microscope at 100×: Nocardia shows branching, filamentous growth; Microthrix parvicella shows tightly coiled filaments; both contrast with the clean, golden-brown floc and diverse protozoa (stalked ciliates like Vorticella) of a healthy mixed liquor.
The corrective action runs through wasting, not aeration. Raise the WAS rate to drop MCRT by 1–3 days and starve the filamentous population, tracking SVI daily and targeting the 80–120 mL/g healthy band (wastewaterace.com, activated-sludge troubleshooting guide). Pair this with mechanical controls that actually work: angled spray nozzles on the basin surface that wet the foam and collapse it back into the mixed liquor, scum troughs at the effluent end, and dedicated foam removal pumps that return the captured foam to the head of the aeration basin rather than to the clarifier. The 4–7 day SVI response lag is normal, and permanent correction takes one to two sludge ages.
Avoid the most common operator mistake: increasing aeration intensity to "blow the foam off." This worsens the condition by stabilizing the air-liquid interface where hydrophobic filaments preferentially accumulate, and it does nothing to address the underlying MCRT problem. If SVI stays above 200 mL/g despite a week of increased wasting, evaluate structural fixes (selector zone, MBBR carrier addition) rather than pushing WAS harder. Operators already running digesters alongside aeration basins will recognize the same logic applied to digester foam, and the anaerobic digester troubleshooting guide covers the parallel diagnostic and corrective framework.
Foam Type 3: Chemical and Surfactant Foam (Industrial or Cleaning Upset)
Surfactant foam is bright white, often localized near the influent end of the basin, and clears within 2–6 hours of the discharge ending (wxwatertech.com troubleshooting guide). No biological corrective action is required and none should be applied. The first confirmatory step is to check shift logs for cleaning-in-place events, batch discharges, or surfactant-bearing waste streams from food processing, textile, or metalworking tenants. A second confirm is the persistence test: physically knock the foam down with a hose and observe whether it returns within 2 hours (surfactant) or 24–48 hours (biological).
Do not adjust WAS or MCRT for surfactant foam. This is a routine misdiagnosis that drives unnecessary solids loss, SVI excursions, and days of recovery time chasing a problem that was never biological. Document the event with the time of foam onset, suspected source, and downstream impact, then notify the pretreatment program. Recurring surfactant foam is a permit issue, not a biology issue, and the long-term fix lives in the industrial pretreatment ordinance, not in the aeration basin. For sites where surfactant loadings are chronic, an equalization basin with a DAF pre-treatment system removes oils, greases, and surfactants before they reach the mixed liquor.
Parameter Table: The Targets That Prevent Foam Recurrence

Stable operation hinges on keeping six core parameters within proven windows; foam of any type is the symptom of at least one parameter drifting out of band (wxwatertech.com process control table; wastewaterace.com activated-sludge troubleshooting guide). Plot all six on a 7-day trend chart. A single reading is noise, a consistent trend is signal, and two parameters drifting in the same direction is the early warning that foam is two weeks away.
| Parameter | Healthy Band (Conventional) | Low-Side Foam Risk | High-Side Foam Risk |
|---|---|---|---|
| MLSS (mg/L) | 2,500–4,000 | < 1,500: insufficient biomass, dispersed growth | > 4,500: old sludge, pin floc, Nocardia risk |
| F/M (lb BOD/lb MLSS-day) | 0.05–0.25 | < 0.04: old sludge, pin floc | > 0.25: young sludge, white billowy foam |
| MCRT / SRT (days) | 5–15 (conventional); 20–30 (with selector) | < 3: dispersed growth, no nitrification | > 20 (no selector): Nocardia/Microthrix risk |
| SVI (mL/g) | 80–120 | < 50: pinpoint floc, old sludge | > 150: filamentous bulking, foam risk |
| DO (mg/L) | 1.5–2.0 minimum | < 1.0: filamentous bulking driver | > 4.0: excessive energy, pin floc risk |
| pH (s.u.) | 6.5–8.0 | < 6.0: nitrification inhibition, filament shift | > 9.0: deflocculation, ammonia toxicity |
Pull the low/high F/M and SVI thresholds directly from the wxwatertech process control table; the pH band reflects the standard guidance that values below 6.0 inhibit nitrification and shift the population toward foaming filaments, while values above 9.0 cause deflocculation and ammonia toxicity. The DO range is the 1.5–2.0 mg/L minimum for conventional aeration; below 1.0 mg/L is a primary driver of filamentous bulking. Validate these bands against your plant's design, NPDES permit limits, and recent historical performance before changing setpoints.
Confirming the Diagnosis: What the Microscope Tells You
A 100× wet mount of well-mixed mixed liquor turns a guess into a confirmed root cause in five minutes (wastewaterace.com activated-sludge troubleshooting guide; Bitton, 2010, Chapter 10). On a healthy slide you will see golden-brown floc with crisp, clean edges, a diverse protozoan community including stalked ciliates like Vorticella, and minimal filament extension. On a foam-event slide you will see branched Nocardia filaments extending from the floc into the bulk liquid, or tightly coiled Microthrix filaments, or sparse clean floc with few protozoa indicating a young, washed-out sludge.
Pair the microscopy with a settleometer test to rule out non-filament causes. If the sludge settles cleanly in 30 minutes but floating chunks appear on the clarifier surface, the cause is denitrification (N2 gas lifting sludge particles), not filamentous foam. The two look superficially similar at the basin but require opposite corrective actions. Record a slide photograph or detailed sketch every shift so trends in the microbial community become visible two to three weeks before the next foam event, and keep a labeled log keyed to the SVI trend for the same period.
Microscopy is also where the activated-sludge and anaerobic digester troubleshooting disciplines diverge. The same field-triage logic that separates foam types in the aeration basin applies to digester foam, and the anaerobic digester troubleshooting guide walks through the parallel microscopy routine for digester mixed liquor.
2026 Prevention: Equipment Upgrades That Stop Foam at the Source

Chasing foam with wasting only resets the system, it does not change the conditions that select for filamentous bacteria. The 2026 prevention playbook maps each biological root cause to an equipment upgrade that removes the selection pressure entirely, turning sludge foam control from a recurring operational chore into a structural design property of the plant.
| Root Cause | Equipment Upgrade | Mechanism | HydropureWater Product Link |
|---|---|---|---|
| Chronic Nocardia/Microthrix foam at high MCRT | Anoxic or aerobic selector zone ahead of aeration basin | Selects floc-formers over filaments via substrate gradient | Package A/O sewage treatment plant |
| F/M swings driving young-sludge white foam | MBBR carrier zone or MBR upgrade | Decouples sludge age from HRT, absorbs shock loads | MBR wastewater treatment system |
| Surfactant and hydraulic shock loads | Equalization basin with DAF pre-treatment | Removes oil, grease, and surfactants upstream | DAF pre-treatment system |
| Denitrification-driven rising sludge | Post-aeration anoxic zone before clarifier | Removes nitrate before sludge blanket denitrifies | Package A/O sewage treatment plant |
| Inconsistent polymer or nutrient dosing | Automated chemical dosing skids | Holds nutrient and polymer feed within control band | Automated chemical dosing system |
For chronic Nocardia/Microthrix foam, the most documented long-term fix is an anoxic or aerobic selector zone sized at 5–15% of the aeration basin volume, which creates a substrate gradient that selects floc-formers over filaments (Bitton, 2010, Chapter 10; wxwatertech.com troubleshooting guide). For high-F/M young-sludge foam driven by hydraulic or organic shock loads, an MBBR engineering guide approach decouples sludge age from hydraulic retention, while a full how MBR works upgrade eliminates the F/M swing entirely. For surfactant and oil-bearing discharges, equalization plus DAF pre-treatment removes the foam-generating compounds before they reach the mixed liquor. For chronic rising-sludge events tied to denitrification, a small anoxic zone downstream of the aeration basin removes nitrate before the sludge blanket denitrifies and eliminates the N2-driven floating sludge that operators routinely confuse with biological foam.
Frequently Asked Questions
How fast does foam clear after wasting is adjusted?
Expect a 4–7 day lag before the first measurable SVI response, and one to two full sludge ages for permanent correction (wastewaterace.com activated-sludge troubleshooting guide). A single elevated SVI reading is noise; a 7-day trend is the signal to commit to a corrective direction.
Is white foam always a sign of young sludge?
No. Surfactant foam from a cleaning-in-place event, batch discharge, or industrial spill looks visually identical to young-sludge foam and is a routine misdiagnosis. Check the shift log for a recent discharge event and run the persistence test (does the foam return in 2 hours or 24 hours?) before adjusting wasting or MCRT. Adjusting biology for a surfactant event drives unnecessary solids loss.
Can I fix Nocardia foam by raising dissolved oxygen?
No. Increasing aeration intensity stabilizes the air-liquid interface where hydrophobic filaments preferentially accumulate, which can worsen the foam and adds energy cost without addressing the root cause. Correct Nocardia and Microthrix foam by raising the WAS rate to drop MCRT by 1–3 days, supported by mechanical foam removal and a selector zone if the problem is chronic.
What SVI reading should trigger a foam investigation?
Any single reading above 150 mL/g, a persistent reading above 120 mL/g for 7+ days at a conventional plant, or any rising 7-day trend (wxwatertech.com process control table; wastewaterace.com activated-sludge troubleshooting guide). SVI is a leading indicator; foam is a lagging indicator. By the time the basin is foaming, SVI has usually been trending up for a week or more.
Do MBR systems still get Nocardia foam?
Yes. The biology is unchanged in an MBR, but the membrane captures floated solids so the foam is less visible in the effluent. MBRs still require SVI control, MCRT management, and selector design to prevent filament dominance; the difference is that the membrane provides a downstream safety net rather than eliminating the upstream biological problem. An MBBR engineering guide comparison shows how MBBR sidesteps the issue by retaining biomass on carriers rather than relying on settleability alone.