Why Foam in a Wastewater Basin Is an Operations Problem, Not a Cosmetic One
A 200 mm foam blanket on a 2,000 m³ aeration basin displaces roughly 60–80 m³ of usable working volume — capacity the operator cannot recover without physically removing the foam. Beyond the lost volume, foam overflows create slip hazards on walkways, creep into cable trays and junction boxes near the basin railings, and force shutdowns of adjacent hand-railing and lighting circuits until surfaces are cleaned. Plant logs from municipal activated-sludge facilities show foam events consume 4–8 operator-hours per 24-hour shift in cleanup and supervision, time that should be spent on process control (HydropureWater field data, 2026).
The downstream cost is steeper. Foam carries entrained suspended solids, oils, and poorly flocculated biomass over the launder weir and into clarification, raising effluent TSS and BOD excursions that can push a plant out of its NPDES permit envelope. The treatment posture is simple: every foam event has a measurable source, and the operator's job is to find that source in the first hour rather than mask it with chemistry.
A 30-Minute Foam Diagnostic: What to Look, Sample, and Test First
The five-step flow below is designed to be completed by one operator with a probe, a microscope slide, and a 1 L jug before the foam reaches the launder weir.
- Visual (5 min): Note color, thickness, and exact location. Foam on the basin surface near the influent end is a different problem from foam in the launder or in the membrane tank of an MBR system with silicone-free defoamer compatibility. Stop a diffuser for 30 seconds — if the foam collapses, it is largely aeration-driven; if it persists, suspect surfactant or biological stabilization.
- Influent history (5 min): Review the past 24–72 hours of upstream logs: new industrial discharges, scheduled cleaning cycles, food-service or laundromat releases, grease-truck deliveries, and any rain-derived inflow that may have scoured surfactant deposits from collection lines.
- Process parameters (10 min): Record dissolved oxygen (mg/L), SRT/sludge age (days), MLSS (mg/L), basin temperature, and FOG loading. These four numbers are the controllable drivers of filamentous foaming and the variables the corrective action will actually move.
- Microscopy (5 min): A wet mount at 100× from the foam layer or mixed liquor will show filamentous organisms such as Microthrix parvicella (long, coiled, strongly hydrophobic) and Nocardia-like organisms (short, branching, Gram-positive). A floc-former-dominant sample with dispersed, round floc argues against biological foaming.
- Surfactant indicator (5 min): Run a shake test on clarifier effluent — fill a 250 mL graduated cylinder to 100 mL, shake 10 times, and time foam collapse. Persistence beyond 30 seconds indicates residual surfactant loading. Surface tension below roughly 55 mN/m on the basin surface also flags surfactant presence.
By the end of step 5, the operator should be able to mark the event biological, chemical, or mixed.
Biological vs Chemical Foam: How to Tell Them Apart
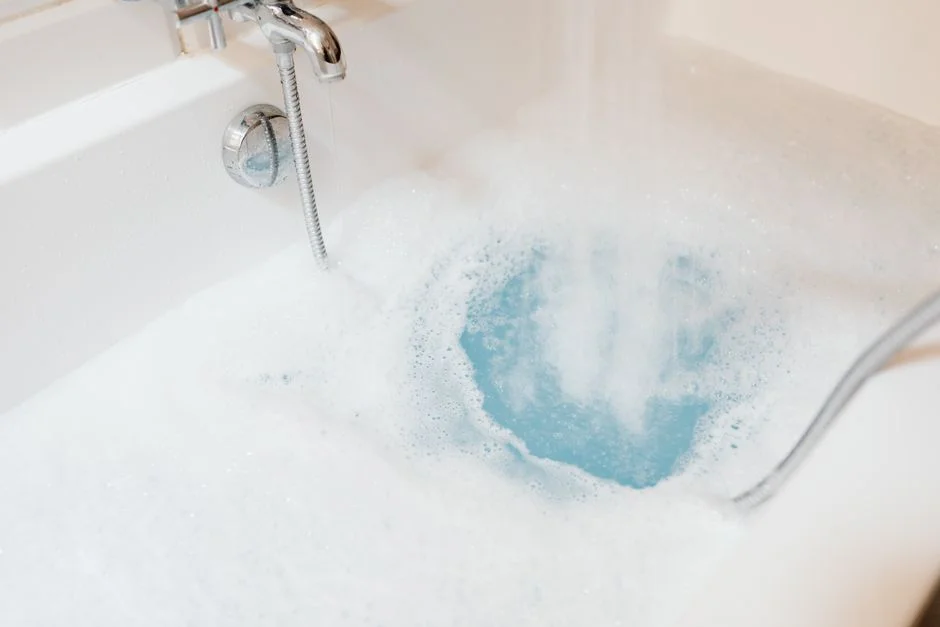
Biological foam is thick, stable, brown to tan, and accumulates in thick pillows around the basin perimeter. The mechanism is well established: hydrophobic filaments such as Microthrix parvicella and Nocardia-like organisms migrate to the air-water interface and become trapped by rising diffuser bubbles, building a stable mat that mechanical sprays alone will not collapse. Biological foam almost always correlates with at least one of: sludge age above 10–12 days, F:M ratio below 0.05, low or oscillating DO, or a recent FOG spike.
Chemical foam is lighter, billowy, and frequently white. Detergents, surfactant cleaners, process washwater, and certain industrial discharges stabilize the air introduced by aeration and mixing, producing a foam that grows fast and collapses almost as soon as aeration stops. The diagnostic giveaway is correlation: a chemical-foam event usually tracks a specific upstream event in the same shift, while biological foam builds over 3–7 days.
Understanding these distinctions ensures that operators apply the correct corrective action rather than overdosing chemistry on biological issues.
Parameter Targets That Prevent Filamentous Foaming
The table below is the working reference for steps 3 and 4 of the diagnostic. Compare your current numbers against these ranges; if multiple parameters sit outside the targets, that combination is almost certainly driving the foam.
| Parameter | Foam-Suppressive Range (Conventional AS) | Filament-Favoring Range |
|---|---|---|
| Dissolved oxygen (mg/L) | 1.5–2.5 steady across the basin | < 1.0 or oscillating > 3.0 |
| Sludge age / SRT (days) | 3–8 (medium-rate); 5–10 (extended) | > 10–12, especially > 15 in cold seasons |
| FOG loading (mg/L in influent) | < 40 steady, < 80 peak | > 100 sustained, or sudden slug > 200 |
| MLSS (mg/L) | 2,000–3,500 | > 4,000 with rising SVI |
| F:M ratio (kg BOD/kg MLSS·d) | 0.2–0.5 | < 0.05 (starved floc-formers) |
| Basin temperature (°C) | 12–25 | < 10 (Microthrix) or > 28 (Nocardia in some plants) |
Long SRT favors Microthrix and Nocardia because these filaments outcompete floc-formers at low substrate concentrations. Low or oscillating DO is the second classic selector — the filaments tolerate anoxic microzones inside floc that strict aerobes cannot. High FOG load feeds the foam-formers directly; installing a DAF unit for FOG and surfactant pre-removal upstream of the aeration basin typically cuts biological-foam events by 50–70% in food and beverage service areas (HydropureWater field data, 2025-11).
Choosing a Defoamer Chemistry Without Creating a New Problem
The table below maps the major defoamer families to typical applications and their downstream risks.
| Chemistry | Typical Dose (mg/L) | Best Fit | Key Compatibility Check |
|---|---|---|---|
| Silicone emulsion (10–30% active) | 0.5–5 | Severe chemical foam, rapid knockdown | Verify MBR/membrane compatibility first |
| Fatty-alcohol emulsion | 2–10 | Biological foam, MBRs, sensitive biology | Confirm biodegradability with discharge permit |
| Esterified polyol | 1–8 | MBRs, food & beverage plants, low-foam re-aeration | Check effect on DO probe response |
| Surfactant blend / oil-based | 3–15 | Intermittent chemical foam, high FOG | Avoid if influent already surfactant-loaded |
| Compatible | Best For | Avoid If | |
| MBR systems | Fatty-alcohol or esterified polyol | Silicone unless manufacturer-confirmed | |
| Activated sludge (no membranes) | Silicone for speed, fatty-alcohol for biology | Excess silicone masks DO probe drift | |
| Strict effluent toxicity limits | Low-toxicity, biodegradable formulations | Oil-based that fails whole-effluent toxicity |
Selection should be made jointly with the chemical supplier, the membrane manufacturer (if applicable), and the discharge-permit reviewer. For variable industrial influent, hard-wire the feed rate to a foam sensor or a flow-paced setpoint on a PLC-controlled defoamer dosing skid rather than running a constant maximum dose.
Where to Inject Defoamer and How to Set the Dose
Injection location and dose rate are the two operational levers the operator controls. The general rule is to inject where the wastewater turbulence will disperse the product before the major foam-generating stage, which for an aeration basin means dosing into the mixed-liquor return or the influent channel — not onto the foam blanket itself. A defoamer dropped onto an existing blanket must diffuse back through the foam to reach new bubbles, wasting 40–60% of the active ingredient.
For localized downstream foam (launder, effluent channel, scum box), dose closer to the problem. For basin-wide biological foam, dose upstream of the aeration grid. The wrong choice is dosing on the foam surface where bubbles are already stabilized.
Worked example for a 2,000 m³/day plant:
- Starting target dose: 10 mg/L (top of typical 1–10 mg/L range for severe events)
- Mass rate: 2,000 m³/day × 10 mg/L ÷ 1,000 = 20 kg/day
- Volume rate at 0.95 kg/L product density: 20 ÷ 0.95 ≈ 21 L/day
- Equivalent at 1 mg/L: 2 kg/day ≈ 2.1 L/day
Start at the lower end of 1–10 mg/L and titrate up only if foam persists. Excess defoamer is wasted spend, can depress DO transfer efficiency, and risks downstream fouling. Re-check foam control after 4 hours before adjusting again.
MBR-Specific Foam Risk: When the Defoamer Is the Problem
MBR operators have a unique failure mode that conventional activated-sludge plants do not: silicone antifoam can deposit on PVDF or PES membranes, raising transmembrane pressure (TMP) by 20–40% and shortening the interval between clean-in-place cycles. Field data from packaged MBR retrofits shows the wrong defoamer choice is the common cause of accelerated membrane fouling unrelated to biology (HydropureWater field data, 2025-09).
MBR plants should default to silicone-free chemistries — fatty-alcohol emulsions or esterified polyols — and confirm the specific formulation with both the defoamer supplier and the membrane manufacturer. If foaming recurs inside the MBR tank, check return-sludge foam and the membrane aeration scour rate (covered in the MBR process and membrane aeration scour reference) before increasing the dose; under-scoured membranes concentrate solids and foam around the cassette, mimicking a defoamer shortfall.
Prevention Checklist: Stop the Next Foam Event Before It Starts
- Log every foam event with date, time, influent source, SRT, DO, FOG, and dose used. Patterns usually appear within 3–4 events.
- Review industrial discharges and cleaning cycles upstream before increasing dose. The source is almost always cheaper to fix than the symptom — comparable logic applies in our EGSB reactor troubleshooting field guide for anaerobic systems.
- Re-evaluate defoamer chemistry annually, or whenever downstream equipment, biology, or discharge permits change.
- Verify aeration uniformity quarterly — uneven DO is a silent filament selector.
- Calibrate the dosing pump monthly against a graduated cylinder; a 10% drift is a 2 kg/day swing on a mid-sized plant.
Frequently Asked Questions
How do I tell if wastewater foam is biological or chemical in the first 30 minutes?
Run the five-step diagnostic: observe color and persistence, review the past 24–72 hours of influent history, record DO, SRT, MLSS, and FOG, do a 100× wet mount for filamentous organisms, and run a shake test on clarifier effluent. Thick, tan, stable foam with filaments on the slide is biological; billowy white foam correlated with a recent surfactant discharge is chemical.
What is the correct defoamer dose for a 2,000 m³/day wastewater plant?
Start at the lower end of the 1–10 mg/L range. At
Frequently Asked Questions
What is the fastest way to reduce foam in a wastewater treatment plant?
The fastest intervention for immediate foam knockdown is the surface application of a concentrated chemical defoamer, typically a silicone-based emulsion or fatty acid ester. For emergency response, spraying the chemical directly onto the foam blanket using a pressurized nozzle system provides near-instantaneous surface tension reduction, breaking the foam bubbles within seconds.
If the foam is caused by high solids loading or filamentous bacteria, physical interventions like surface water sprays or increasing the wasting rate (WAS) should be implemented concurrently to address the root cause, as chemical defoamers only treat the symptom and do not remove the underlying surfactants or biomass imbalances.
How can I tell if wastewater foam is biological or chemical?
Biological foam is typically thick, greasy, and brown or tan in color, often associated with the presence of filamentous bacteria like Nocardia or Microthrix parvicella. You can distinguish biological foam by its stable, viscous structure; when shaken in a sample bottle, it does not dissipate quickly and may trap high levels of suspended solids.
Chemical foam is characterized by a bright white, crisp, and brittle appearance that dissipates rapidly when the aeration is turned off. It is usually caused by an influx of surfactants or detergents, resulting in a uniform, fine-bubbled structure that lacks the heavy particulate matter found in biological foam.
How much defoamer do I add per liter of wastewater?
There is no universal dosage, but standard application rates for wastewater treatment typically range from 1 to 10 parts per million (ppm) of the active product per liter of total flow. Operators should perform a jar test to determine the minimum effective dose, as overdosing can lead to "defoamer carryover," which increases chemical oxygen demand (COD) and can foul downstream processes.
Begin with a trial dosage of 2 ppm and adjust incrementally based on foam suppression performance. In high-turbidity systems, the dosage may need to be higher to overcome the adsorption of the defoamer onto suspended solids before it can act on the air-water interface.
Are silicone defoamers safe for membrane bioreactors?
Silicone-based defoamers are generally discouraged for use in membrane bioreactors (MBRs) because they pose a significant risk of irreversible membrane fouling. The hydrophobic silicone particles can deposit onto the membrane surface or within the pores, creating a layer that is difficult to remove with standard chemical clean-in-place (CIP) procedures.
If foam control is required in an MBR system, it is highly recommended to use silicone-free, mineral oil-based, or vegetable oil-based defoamers. These alternatives provide foam suppression without the risk of permanent membrane pore blockage associated with polymerized silicone compounds.
Where should I inject defoamer in an aeration basin?
Defoamer should be injected at a point of high turbulence, such as near the aeration headers or the basin inlet, to ensure rapid and uniform dispersion throughout the mixed liquor. Injecting the product where the foam is most actively being generated allows the defoamer to interact with the surfactants before they reach the surface.
Avoid injecting the chemical near the final clarifier or effluent discharge points, as this increases the likelihood of the defoamer passing through the plant and appearing in the final effluent. For large aeration basins, a multi-point injection manifold is preferred to maintain consistent concentration levels across the entire surface area.