Why Food Processing Wastewater Pushes Conventional Treatment Beyond Its Limit
Food processing wastewater typically runs 1,500–10,000 mg/L BOD, 200–1,500 mg/L FOG, and 500–4,000 mg/L TSS, with daily load swings of 3–5× during CIP clean-in-place cycles, slaughterhouse blood surges, and brewery fermentation washouts (per Springer 2021 review of food processing wastewater practices). Conventional activated sludge (CAS) handles this poorly because clarifiers cannot hold mixed liquor suspended solids (MLSS) above ~4,000 mg/L without washout, and FOG spikes trigger filamentous bulking that takes 5–10 days to recover. DAF pre-treatment alone removes 60–80% of FOG and TSS but leaves a soluble BOD load of 800–6,000 mg/L that still needs a polishing biological step before discharge or reuse. An MBR — defined as a process that integrates membrane separation with activated sludge to completely retain biomass (per The MBR Site) — holds MLSS at 8,000–12,000 mg/L, eliminating clarifier washout during shock loads and producing effluent with TSS <5 mg/L suitable for direct RO feed. For a food plant with intermittent high-strength discharges, this is the operational difference between weekly clarifier upsets and a stable, reuse-ready effluent stream. Plant engineers matching their own BOD/FOG profile against these ranges can quickly determine whether their site has outgrown CAS.
The regulatory pressure compounds the engineering problem. EPA, EU, and Chinese discharge limits for oil and grease tightened across 2024–2025, with most jurisdictions now requiring <10–15 mg/L FOG in surface-water discharges (see the 2026 oil and grease discharge limits by jurisdiction). A CAS plant experiencing a single FOG spike can breach these limits for 48–72 hours while biomass recovers, exposing the operator to consent-decree fines and production curtailment.
How an MBR Train Is Configured for a Food Plant
A food-grade MBR train runs: rotary bar screen → DAF for FOG/TSS removal → equalization → immersed MBR → disinfection (ClO₂) → optional RO for reuse. The front-end GX series rotary mechanical bar screen protects the DAF from rags and large solids, while the dissolved air flotation system (rated 4–300 m³/h) strips 60–80% of FOG and TSS before the biological step. This pre-treatment is non-negotiable: FOG carryover above ~100 mg/L into the MBR tank causes irreversible membrane fouling that no CIP cycle can reverse.
For the membrane stage, immersed flat-sheet PVDF (0.1 μm pore size) is the dominant configuration in food plants because the flat geometry tolerates FOG carryover better than hollow-fibre, and individual cassettes can be replaced without draining the tank. A DF series PVDF flat-sheet membrane module delivers 32–135 m³/day per module across 80–225 m² configurations (HydropureWater catalog data), which becomes the building block for the CAPEX sizing example in the next section. Sidestream tubular MBRs handle higher TSS but consume 3–5× more energy and are reserved for streams above 4,000 mg/L TSS.
MABR (membrane aerated biofilm reactor) is an emerging alternative: biofilm grows on the membrane surface, bubble-less aeration cuts energy by 30–50%, but biofilm management complexity and limited food-industry reference data keep it a second-choice for most buyers in 2026. Typical immersed flat-sheet MBR design parameters for food wastewater are:
| Parameter | Typical Range (Food Wastewater) |
|---|---|
| MLSS | 8,000–12,000 mg/L |
| HRT | 6–10 hours |
| SRT | 20–40 days |
| Flux | 15–25 L/m²·h |
| Operating TMP | 0.1–0.4 bar |
| COD removal | 95–98% |
The complete packaged system is typically delivered as an integrated MBR membrane bioreactor system on a single skid, reducing field installation to piping and electrical tie-ins.
2026 CAPEX Breakdown: What Does an MBR System Actually Cost to Install?
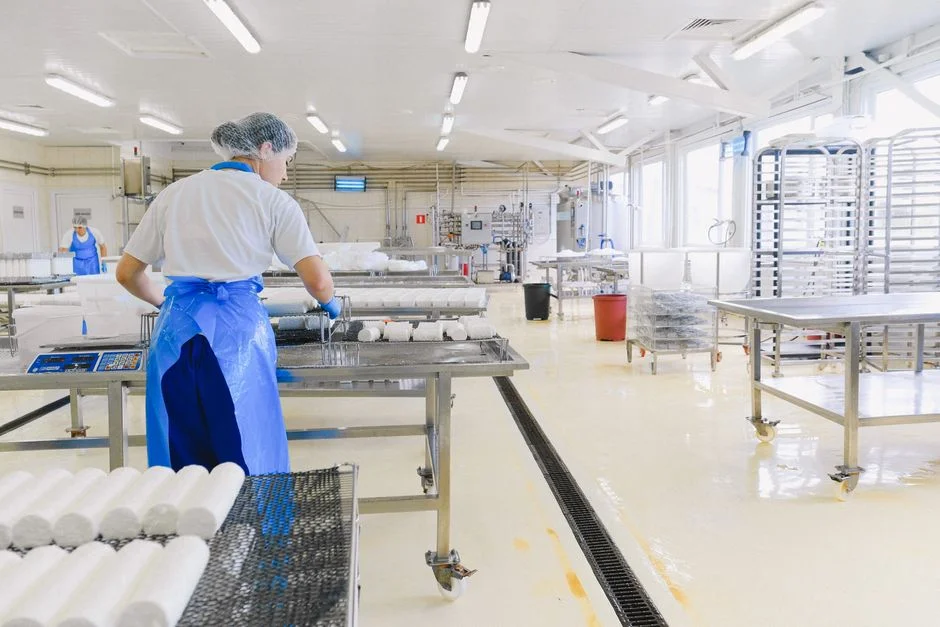
An MBR system for food processing wastewater costs $250–$650 per m³/day of installed capacity in 2026, with the lower end applying to plants above 1,000 m³/day and the upper end to containerized units below 200 m³/day (HydropureWater field data, 2026). Regional benchmarks for cross-market comparison are available in the Pakistan MBR engineering guide.
The line-item decomposition matters for budget review:
| CAPEX Component | Share of Total | Cost Driver |
|---|---|---|
| Tanks and civil works | 25–35% | Concrete vs. epoxy-coated steel, seismic class |
| Membrane modules | 20–30% | Module count × $4,000–$7,000 per DF cassette |
| Blowers, pumps, piping | 10–15% | Aeration duty, recirculation flow |
| Automation and PLC | 8–12% | SCADA level, remote monitoring |
| Installation and commissioning | 10–15% | Site labor, containerized saves 20–35% on install |
Worked example for a 500 m³/day food plant: using DF flat-sheet modules at ~90 m³/day each requires ~6 modules, an MBR tank of ~250 m³, and supporting blowers and CIP skids. At the $250–$650/m³/day band, total MBR CAPEX lands at $180,000–$325,000 for the membrane train, with another $80,000–$150,000 for the upstream DAF, screens, and equalization. Containerized delivery adds 20–35% to equipment cost but cuts on-site installation from 8–12 weeks to 3–4 weeks — a meaningful trade-off when production downtime is the binding constraint.
2026 OPEX Breakdown: Energy, Membranes, Chemicals, Labor
OPEX for a food-grade MBR runs $0.18–$0.45 per m³ treated in 2026, varying with influent strength, reuse ratio, and local energy cost. The two line items that move the number are membrane replacement and aeration energy, together accounting for 55–70% of total OPEX. For context, a constructed wetland OPEX benchmark sits at $0.026–$0.08/m³ but cannot meet FOG or BOD discharge limits for most food streams.
| OPEX Line Item | Unit Cost | Share of OPEX |
|---|---|---|
| Aeration + recirculation energy | 0.3–0.6 kWh/m³ ($0.04–$0.10/m³) | 35–45% |
| Membrane replacement (annualized) | $8–$15 per m² over 5–7 yr life | 15–25% |
| CIP chemicals (NaOCl + citric acid) | $0.01–$0.04/m³ | 3–6% |
| DAF coagulant/polymer | $0.02–$0.06/m³ | 5–10% |
| Sludge dewatering and disposal | $0.02–$0.05/m³ | 8–12% |
| Labor (PLC-automated) | $0.02–$0.05/m³ | 5–10% |
PVDF flat-sheet modules last 5–7 years on food wastewater when CIP is run weekly, versus 3–5 years for hollow-fibre on the same duty. Sludge handling is the line item most often underestimated: MBR produces 30–50% less waste activated sludge than CAS because of the higher SRT, which directly reduces dewatering OPEX — typically run through a plate-and-frame filter press paired with an automatic chemical dosing system for polymer conditioning. Manually supervised plants pay $0.08–$0.15/m³ in labor; a PLC-automated plant with remote monitoring cuts this to $0.02–$0.05/m³, which is why automation shows up in nearly every credible ROI case.
MBR vs DAF + Conventional Activated Sludge: 10-Year TCO Comparison
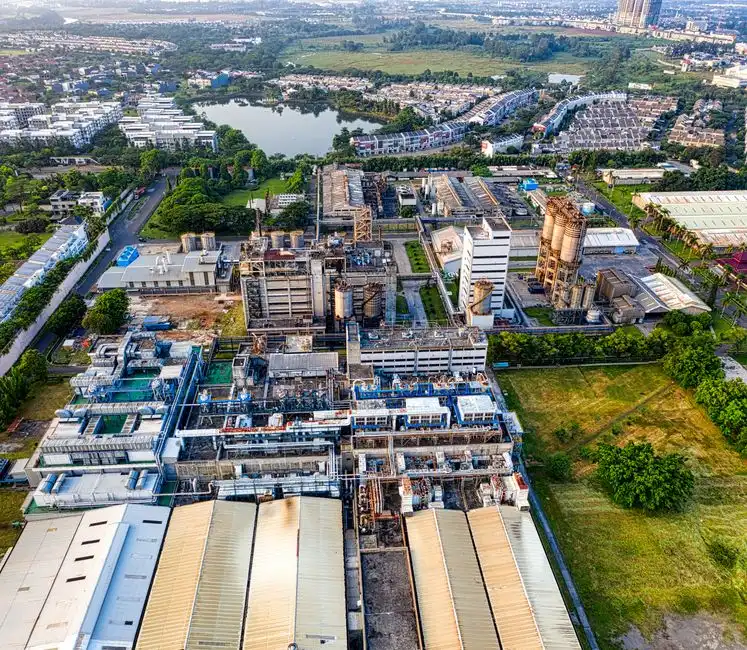
The single question a CFO asks is whether the MBR CAPEX premium pays back over the asset life. The 10-year TCO below is the answer, framed for a representative 500 m³/day food plant with influent BOD 3,000 mg/L, FOG 600 mg/L, and discharge to municipal sewer under EPA FOG limits (see the 2026 oil and grease discharge limits). The CAS option struggles with FOG spikes and clarifier upsets; the MBR option trades higher OPEX for RO-reuse eligibility, which inverts the TCO calculation.
| Cost Element | Scenario A: DAF + CAS | Scenario B: DAF + Immersed MBR |
|---|---|---|
| CAPEX (installed) | ~$130,000 | ~$280,000 |
| OPEX ($/m³ treated) | ~$0.22 | ~$0.28 |
| 10-year OPEX (500 m³/day, 330 operating days) | ~$363,000 | ~$462,000 |
| 10-year gross TCO | ~$493,000 | ~$742,000 |
| RO reuse offset ($0.30–$0.50/m³ freshwater avoided) | N/A | –$247,000 to –$413,000 |
| 10-year net TCO | ~$493,000 | ~$329,000 to ~$495,000 |
The crossover point is the rule a procurement lead should carry into the budget meeting: MBR becomes TCO-advantaged above ~300 m³/day or when the reuse offset is monetized; below ~200 m³/day, DAF+CAS wins on simplicity and lower CAPEX exposure. The RO reuse economics for food plants govern whether the offset column is large enough to flip the comparison — at freshwater costs above $0.40/m³, MBR wins decisively.
ROI and Payback: When the Numbers Justify MBR
Payback = (MBR CAPEX premium − CAS CAPEX) ÷ (annual water-reuse savings + sludge-handling savings + compliance-risk value). For the 500 m³/day case above: a $150,000 MBR premium offset by $30,000/year in water reuse plus $15,000/year in sludge reduction yields payback of approximately 3.3 years, with a 5-year NPV positive at an 8% discount rate. Adjacent OPEX optimization levers — covered in the MBBR media replacement cost benchmark and the predictive maintenance system supplier guide — can shave another 8–15% off annual OPEX when layered onto an MBR baseline. Intangible ROI items that should appear in the internal case, even when not quantified in the payback formula, include avoided EPA consent-decree fines, reduced production downtime from clarifier upsets, and eligibility for water-stewardship certifications that increasingly factor into buyer audits.
Selecting an MBR Supplier: 4-Criterion Framework for 2026
Cost data means nothing if the supplier cannot keep the plant running. A defensible RFP scoring framework for 2026 should weight four criteria:
| Criterion | What to Verify | Weight |
|---|---|---|
| Membrane warranty and replacement-cycle guarantee | ≥5 years, pro-rata replacement terms, named membrane model | 30% |
| Verified food-industry reference plants | ≥3 sites with 12+ months operating data, effluent COD <50 mg/L, FOG <10 mg/L | 30% |
| Factory-integrated skid testing | Wet test before shipment, not loose equipment delivery | 20% |
| Local service and spare-membrane logistics | Service vehicle within 200 km, spare membranes in regional warehouse (downtime cost: $5,000–$20,000/day) | 20% |
Regional supplier shortlists for specific markets — including the Middle East and West Africa — are covered in market-specific guides such as the Dubai and Ghana buyer references linked from the broader wastewater treatment plant manufacturer in Dubai 2026 buyer's guide.
Frequently Asked Questions
How much does an MBR cost for food processing wastewater?
$250–$650 per m³/day installed CAPEX; $0.18–$0.45 per m³ OPEX in 2026, per HydropureWater field data.
What is the membrane replacement interval for MBR on food wastewater?
PVDF flat-sheet modules last 5–7 years with weekly CIP; hollow-fibre lasts 3–5 years on the same duty.
Is MBR better than activated sludge for high-FOG food wastewater?
Yes — MBR holds 8,000–12,000 mg/L MLSS without clarifier washout and tolerates FOG spikes that trigger CAS bulking.
Can MBR effluent be reused in a food plant?
MBR effluent typically runs TSS <5 mg/L and COD <50 mg/L, suitable as RO feed for boiler makeup or CIP rinse water.
What is the smallest MBR capacity that is cost-effective for a food plant?
Approximately 200–300 m³/day; below this, DAF+CAS wins on CAPEX simplicity unless reuse offset is monetized.