What Actually Drives Constructed Wetland Operating Cost
Constructed wetland operating cost is dominated by six line items, not by the headline $/m³ figure vendors quote. USEPA benchmarks for systems under 3,785 m³/d put routine OPEX at $0.026–$0.08 per cubic meter of treated wastewater, adjusted to 2026 electricity and labor rates (per EPA 832-R-93-005, indexed forward). That range collapses into predictable buckets once you break it apart: labor 35–55%, vegetation management 10–20%, energy 5–15%, media/bed maintenance 5–15%, sludge handling 5–15%, and monitoring 5–10% (HydropureWater field data, 2026). A reader who sees only "$0.05/m³" cannot defend the number — a reader who sees "labor is the dominant cost at this flow band" can challenge a vendor's man-hour assumption directly.
Two parameters swing every line item simultaneously: hydraulic loading rate (HLR) and influent BOD. Pushing HLR from 2 cm/d to 15 cm/d can triple OPEX per cubic meter, because higher hydraulic loads drive more frequent media clogging events, faster vegetation turnover, and shorter bed life between restorations. Influent BOD above 500 mg/L forces longer hydraulic residence time, which expands footprint and increases land amortized into OPEX (land opportunity cost typically runs $0.005–$0.02/m³ at $50–$150/m² land values). The CAPEX anchor used in this analysis is $18,200/ha for sub-1-MGD systems (per EPA 832-R-93-005), which frames the amortization baseline applied later in the NPV section.
| OPEX Line Item | Typical Share of Total OPEX | Primary Cost Driver |
|---|---|---|
| Labor (operations, harvesting, inspection) | 35–55% | Operator hours/week, vegetation cycles |
| Vegetation management (Phragmites, Typha) | 10–20% | Harvesting frequency, biomass disposal |
| Energy (pumps, dosing, controls) | 5–15% | Configuration (VF > HSSF > FWS) |
| Media/bed maintenance | 5–15% | HLR, influent TSS, clogging risk |
| Sludge handling | 5–15% | Pre-treatment TSS removal efficiency |
| Monitoring & compliance | 5–10% | Effluent permit frequency, lab costs |
FWS vs HSSF vs VF: Why Configuration Changes the OPEX Number
The configuration you specify shifts the OPEX number by 2–4× before any site-specific adjustment. A free water surface (FWS) wetland operates with water exposed above a planted soil or gravel bed at HLRs of 1.5–5 cm/d, looking and functioning like a natural marsh. A horizontal subsurface flow (HSSF) wetland keeps wastewater below the surface of a planted gravel bed running 2–20 cm/d, with no open water and far fewer vector or odor issues. A vertical flow (VF) wetland doses wastewater intermittently over a planted sand bed at 4–40 cm/d, with the unsaturated conditions driving nitrification rates no other configuration matches.
Removal performance tracks the configuration choice. BOD removal runs 65–95% across all three types. Ammonia removal diverges sharply: 30–60% in FWS, 40–90% in HSSF, and 50–90% in VF, because VF's aerobic unsaturated conditions favor nitrifying bacteria. Total nitrogen removal holds at 30–60% across all types unless a dedicated denitrification stage is added (typically a downstream FWS or recirculating HSSF cell). Total phosphorus removal is the weak link everywhere — 20–50% — and is the parameter most often governing whether a media amendment (alum, steel slag, wollastonite) is needed at capital cost.
For routine operating cost, the ranking is FWS < HSSF < VF. FWS has the lowest energy and the simplest maintenance. HSSF adds media-clogging risk and the need for a rotary fine screen for wetland headworks to protect the bed. VF commands a premium because of intermittent dosing pumps (typically 0.08–0.15 kWh/m³), control panels, and media-restoration cycles every 8–15 years. A 2026 application rule of thumb: FWS for tertiary polishing of lagoon or pond effluent; HSSF for small-community BOD plus ammonia; VF for ammonia-dominated industrial pretreatment where the dosing energy buys real nitrification capacity.
| Parameter | FWS | HSSF | VF |
|---|---|---|---|
| HLR range (cm/d) | 1.5–5 | 2–20 | 4–40 |
| BOD removal | 65–95% | 65–95% | 65–95% |
| Ammonia removal | 30–60% | 40–90% | 50–90% |
| Total nitrogen removal | 30–60% | 30–60% | 30–60% |
| Total phosphorus removal | 20–50% | 20–50% | 20–50% |
| Energy (kWh/m³) | 0.03–0.1 | 0.05–0.2 | 0.08–0.3 |
| 2026 OPEX ranking | Lowest | Mid | Highest |
Constructed Wetland vs Activated Sludge vs MBR: 2026 OPEX Comparison
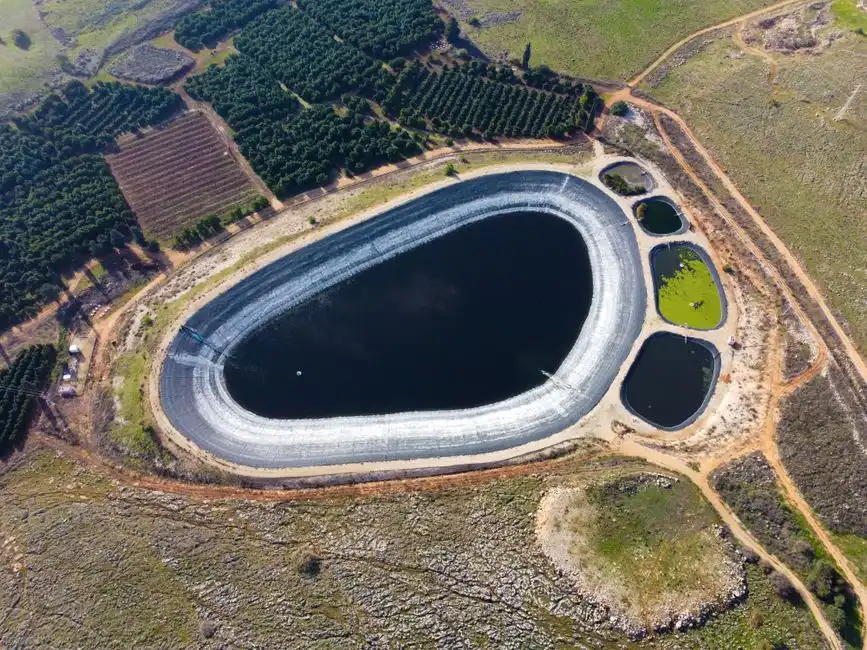
A wetland only wins a bid when the head-to-head number is on the page. The 2026 comparison below uses the same flow band (1,000–5,000 m³/d municipal secondary treatment) and the same 2026 electricity rate of $0.11–$0.14/kWh across all four technologies. Constructed wetlands come in at $0.026–$0.08/m³ with 0.05–0.2 kWh/m³, activated sludge (AS) at $0.12–$0.25/m³ with 0.4–0.8 kWh/m³, membrane bioreactors (MBR) at $0.18–$0.40/m³ with 0.6–1.2 kWh/m³, and stabilization ponds at $0.02–$0.05/m³ with negligible energy (HydropureWater field data, 2026; cross-referenced against the SBR OPEX breakdown for 2026).
The table below also shows where each technology loses. Constructed wetlands lose in three scenarios: ammonia polishing in cold climates below 5°C (nitrification rate halves every 7–10°C drop), high-strength industrial loads above 500 mg/L BOD (insufficient reaction surface per m²), and tight footprints below 1 m²/m³/d (wetlands cannot be compressed; AS and MBR can). Wetlands win in low-strength municipal/industrial polishing, decentralized rural clusters under 2,000 m³/d, projects with nutrient removal targets and minimal sludge logistics, and any application prioritizing energy simplicity over footprint.
| Process | Energy (kWh/m³) | OPEX ($/m³) | Sludge (kg TSS/ha/d) | Footprint (m²/m³/d) | Operator (hr/week) | Effluent BOD/TN (mg/L) |
|---|---|---|---|---|---|---|
| Constructed Wetland | 0.05–0.2 | 0.026–0.08 | 5–15 | 1–10 | 2–6 | <20 / 5–25 |
| Activated Sludge | 0.4–0.8 | 0.12–0.25 | 80–200 | 0.2–0.5 | 15–30 | <20 / 10–30 |
| MBR | 0.6–1.2 | 0.18–0.40 | 60–150 | 0.1–0.3 | 20–40 | <5 / 5–15 |
| Stabilization Pond | 0.01–0.05 | 0.02–0.05 | 3–10 | 10–30 | 1–3 | 20–40 / 15–35 |
The sludge line deserves attention. Constructed wetlands produce 5–15 kg TSS/ha/d versus 80–200 kg TSS/ha/d for activated sludge — roughly an order of magnitude lower. At $50–$150/tonne for dewatering and disposal, the avoided-sludge credit alone shifts a wetland's effective OPEX down by $0.005–$0.02/m³, and that credit is not visible in the headline $/m³ number. For sites already running a sludge dewatering filter press downstream, the smaller volume means fewer press cycles per year and lower polymer consumption.
How to Estimate OPEX for Your Project in 2026
Five steps convert a flow and a configuration into a defensible 2026 OPEX number. First, confirm the design flow in m³/d and split it into dry-weather and wet-weather bands if the influent is combined sewer. Second, pick a configuration from the FWS/HSSF/VF decision tree above based on effluent targets, not on capital cost. Third, size the HLR from the configuration's range — 1.5–5 cm/d for FWS, 2–20 cm/d for HSSF, 4–40 cm/d for VF — and check that the chosen HLR does not breach the media-clogging risk threshold (typically HLR > 8 cm/d in HSSF without pre-filtration). Fourth, calculate the required area as flow divided by (HLR × 0.0864) to get square meters. Fifth, multiply area by a 2026 operating factor.
The operating factors used here, scaled from the USEPA $0.026–$0.08/m³ band at typical 5–10 cm/d HLR, are: FWS $2,800–$8,500/ha/year, HSSF $4,200–$11,000/ha/year, VF $5,500–$14,000/ha/year (HydropureWater field data, 2026). A worked example: 1,000 m³/d municipal effluent, HSSF at 5 cm/d, area = 1,000 / (0.05 × 86.4) = ~232 m², then annualized OPEX ≈ $98–$255/year at the bottom of the HSSF factor. The higher end of the EPA $0.026–$0.08/m³ band applies to larger systems where labor and monitoring scale less efficiently — this is why low-flow rural projects sit at the lower bound.
Three inputs are most often underestimated in vendor quotes: vegetation harvesting labor (a Phragmites stand requires 1–2 cuttings per year at 8–15 labor-hours/ha/cycle), media replacement reserve (set aside 5–10% of CAPEX per year for VF beds, which need restoration every 8–15 years), and power for VF dosing pumps (0.08–0.15 kWh/m³ — small in absolute terms but consistent across the year). A buried package A/O plant as a pretreatment step, sized as a buried package A/O plant for wetland pretreatment, can cut wetland OPEX by reducing influent TSS and the resulting clogging frequency. For chemical handling elsewhere on site, see the chemical cost optimization in 2026 guide; for membrane-based polishing alternatives, the ultrafiltration OPEX in 2026 piece is a useful counterpoint.
20-Year NPV and ROI: When the Wetland Pays Back
The financial case is where a wetland specification either survives or dies. A defensible 20-year NPV uses a 5% discount rate, 3% annual O&M escalation, and a CAPEX split of earthworks 40%, media 20%, liners 15%, plants and establishment 10%, controls 15%. On a $18,200/ha baseline (per EPA 832-R-93-005, indexed to 2026), a 1,000 m³/d HSSF wetland with 0.2 ha of bed has a year-0 CAPEX of roughly $36,400 plus site-specific earthworks markup. The avoided-sludge credit at $50–$150/tonne for dewatering and disposal, against a 75–90% sludge reduction versus AS, is worth $0.01–$0.04/m³ — applied over 20 years, that credit alone shifts NPV by $50,000–$200,000 on a 1,000 m³/d plant.
Two scenarios bound the answer. A 500 m³/d rural cluster with HSSF wetland typically wins against an equivalent SBR by ~30% on 20-year NPV, because labor and sludge dominate the conventional OPEX and the wetland amortizes both down. A 5,000 m³/d industrial park is more competitive: activated sludge with an anaerobic selector is close on NPV, and the wetland wins only when land is below $50/m² and any nitrogen credit exceeds $2/kg N. Below $30/m² land and with a $5/kg N credit, the wetland wins by 15–25% even at this scale.
| Scenario | Wetland 20-yr NPV | Conventional 20-yr NPV | Winner | Margin |
|---|---|---|---|---|
| 500 m³/d rural cluster (HSSF vs SBR) | $420,000 | $600,000 | Wetland | ~30% |
| 5,000 m³/d industrial park (VF vs AS) | $3.8M | $3.9M (AS + anaerobic selector) | Marginal wetland | 2–5% |
| 5,000 m³/d with N credit >$2/kg N, land <$50/m² | $3.5M | $4.3M | Wetland | 15–25% |
ROI is highly sensitive to land cost, climate, and influent strength — never quote a single payback number without these three variables attached. Cold-climate sites (mean winter <5°C) should reduce the wetland's ammonia credit and re-run the NPV; warm-climate sites with steady low-strength influent should see the strongest wetland case.
Frequently Asked Questions
What is the typical 2026 OPEX for a constructed wetland per cubic meter? $0.026–$0.08/m³ for systems under 3,785 m³/d, per USEPA benchmarks indexed to 2026 electricity and labor rates. FWS sits at the low end, VF at the high end.
How much energy does a constructed wetland use? 0.05–0.2 kWh/m³ across all configurations, versus 0.4–0.8 kWh/m³ for activated sludge and 0.6–1.2 kWh/m³ for MBR. VF dosing pumps account for the upper bound.
Which configuration is cheapest to operate: FWS, HSSF, or VF? FWS is the cheapest at $2,800–$8,500/ha/year in 2026 operating factors. HSSF runs $4,200–$11,000/ha/year, and VF $5,500–$14,000/ha/year due to dosing pumps and media-restoration cycles.
How much sludge does a constructed wetland produce compared to activated sludge? 5–15 kg TSS/ha/d versus 80–200 kg TSS/ha/d for AS — roughly an order of magnitude lower, worth $0.01–$0.04/m³ in avoided dewatering and disposal costs.
What is the biggest cost driver in a 20-year wetland NPV? Land cost and sludge-handling credit together swing NPV by 15–30% on a 1,000 m³/d plant. Below $50/m² land and with a working nitrogen credit, wetlands win; above $100/m² land, activated sludge with anaerobic selector becomes competitive.