What an AOP actually does and where the common failures hide
An advanced oxidation process (AOP) is a hydroxyl-radical-driven water treatment that, in properly tuned conditions, can drop contaminants from several-hundred ppm to less than 5 ppb and mineralise organics to CO2, H2O, and salts (Wikipedia, Advanced oxidation process). The reactive species is the hydroxyl radical (·OH), generated in situ from primary oxidants (O3, H2O2), energy sources (UV light), or catalysts (Fe2+, TiO2). The configurations a tertiary-skid operator will meet in the field are Fenton, photo-Fenton, ozone/UV, UV/H2O2, peroxone (O3+H2O2), TiO2/UV photocatalysis, and Electro-Fenton (Wikipedia).
The Fenton reaction drives most failure modes. Initiation: Fe2+ + H2O2 → Fe3+ + ·OH + OH−. Catalyst regeneration: Fe3+ + H2O2 → Fe2+ + ·OOH + H+ (Wikipedia). A side reaction, H2O2 → ·OH + ·OOH + H2O, is the self-scavenging path that wastes peroxide when pH and temperature drift (Wikipedia). The H2O2 chemistry has to run in an acidic medium at 2.5–4.5 pH and 30–50 °C to stay safe and efficient (Wikipedia) — and that window is the single most violated parameter in real plants.
Failures cluster into four families: (1) reagent — pH/temperature drift, peroxide self-scavenging, O3:H2O2 ratio errors; (2) hardware — UV lamp aging, quartz sleeve fouling, ozone destruct catalyst exhaustion, dosing pump scaling; (3) chemistry — poor ·OH yield, non-uniform reactant distribution in full-scale reactors; and (4) by-product — iron sludge, bromate from Br− + O3, residual H2O2 toxicity downstream. These are the four open challenges the literature still flags: "catalyst fouling, energy consumption of UV lamps, large scale reactant distribution within reactors, and control of partial-oxidation by-products" (Wikipedia). For background on ozone-specific trade-offs, the ozone water treatment pros and cons engineering guide covers the safety side in more depth.
Problem 1: Hydroxyl radical yield collapses from pH or temperature drift
Symptom: COD removal silently falls from a baseline of >80% to <40% with no change in feed, dose, or flow; effluent TOC barely moves; the operator gets blamed for a "dosing problem" that is actually a chemistry problem. Cause: Above pH 4.5 the Fe2+ → Fe3+ catalytic cycle slows and ferric hydroxide precipitates, freeing less ·OH; above ~50 °C, H2O2 decomposes into O2 and H2O via the self-scavenging path (Wikipedia). Both directions kill radical yield without changing the peroxide dose on the SCADA tag.
Diagnostic: Run a bench-scale jar test at pH 2.5, 3.5, and 4.5 with the same H2O2 dose; measure COD decay at 10, 20, and 30 minutes. The 30-minute ·OH yield can be inferred from the COD slope. Fix: Install online pH control with sulfuric acid dosing ahead of the Fenton reactor; target 3.0–3.5 pH as a safe midpoint inside the 2.5–4.5 window. A PLC-controlled chemical dosing skid with a PID loop on the pH probe is the standard retrofit. Prevention: Hardwire the pH probe into the PLC interlock so peroxide dosing trips if pH exceeds 4.0 — never let the reactor run with probe failure as the default state.
Problem 2: Iron sludge accumulation in Fenton and photo-Fenton reactors
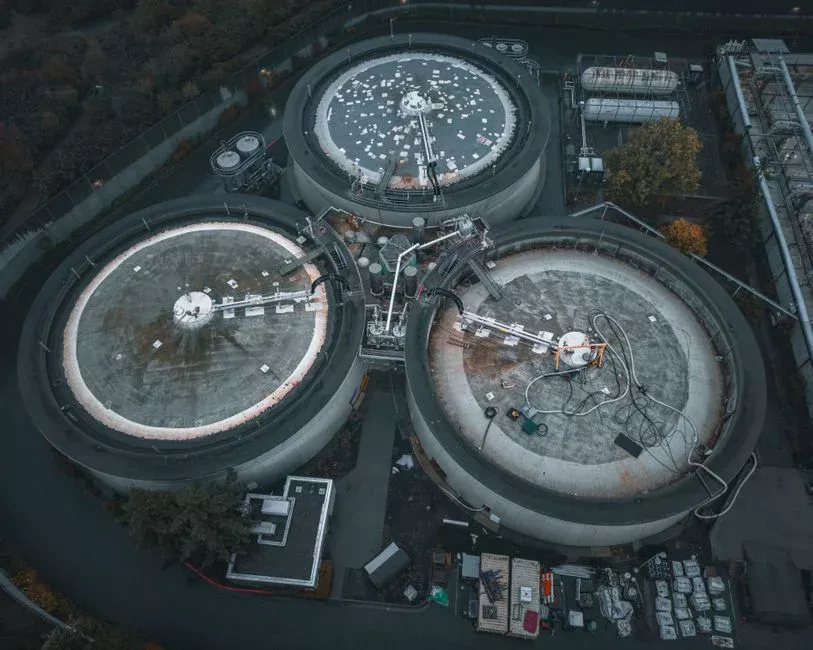
Symptom: Brown-orange sludge blankets the clarifier; the Fenton reactor mixed liquor turns turbid; COD removal drifts downward over a 4–8 week window as catalyst is lost to the underflow. Cause: Every Fe2+ → Fe3+ cycle produces ferric hydroxide that precipitates once pH rises above ~3. Across the 2.5–4.5 operating range, the majority of dosed iron reports to the sludge blanket, which is why downstream solids handling is the long-term OPEX driver for Fenton plants (Wikipedia, Fenton sludge stoichiometry).
Diagnostic: Pull a mixed-liquor TSS from the reactor and a settled-sludge sample; send the latter for Fe analysis by XRF or wet-chemistry (digest in aqua regia, run AAS). A plate and frame filter press for Fenton sludge gives a quick cake-solids number to size dewatering. Fix: Desludge on a fixed cycle, then raise pH to 7–8 in a post-Fenton neutralisation stage with lime or NaOH to precipitate the residual dissolved iron before discharge or reuse. A high-efficiency sedimentation tank upstream of the filter press cuts cake volume by settling the bulk of the ferric floc. Prevention: The Wikipedia entry notes that "Fluidized-Bed Fenton has also shown great potential in terms of degradation performance and economics" (Wikipedia), and Electro-Fenton similarly reduces sludge by regenerating Fe2+ at the cathode. Both are credible retrofits when sludge OPEX is the binding constraint.
Problem 3: UV lamp aging and quartz sleeve fouling
Symptom: H2O2 consumption rises while COD removal falls in a UV/H2O2 or UV/ozone reactor; the optional UV intensity sensor drifts downward; the lamp runtime log shows >12,000 hours. Cause: UV lamp output degrades continuously with use, and visible output is not a reliable proxy for delivered UV — lamps typically need replacement "every few years" (Wikipedia). Quartz sleeves foul with iron carryover, hardness scale, and biofilm, attenuating UV before it reaches the water. Sleeve fouling is the single most common cause of a "UV reactor not working" complaint, and the failure mode is silent because the lamp is still lit.
Diagnostic: Measure UV intensity through a reference port with a calibrated radiometer and compare to a known-new lamp baseline. Pull the sleeve and inspect visually; run a CIP acid wash (citric or sulfamic) and see if intensity recovers. Fix: Replace lamps on runtime hours, not on visible output. Install an automatic wiper or schedule CIP on the sleeve at a defined interval. A pre-AOP multi-media pre-filter ahead of the AOP drops suspended solids and iron carryover to the UV reactor, and an industrial UV sterilizer for AOP reactors sized with at least 30% redundancy keeps delivery on-spec through end-of-lamp life. Prevention: Track kWh per kg COD removed; if the number climbs, sleeve or lamp is suspect before any chemistry change.
Problem 4: Bromate formation in ozone and peroxone systems
Symptom: Bromate (BrO3−) in the AOP effluent climbs above the 10 µg/L WHO drinking-water guideline even though COD removal looks acceptable. Cause: Molecular ozone oxidises bromide ion (Br−) to bromate, a possible carcinogen (Wikipedia). Direct O3 attack is the dominant pathway, so reducing the ozone dose and shifting oxidation onto ·OH from H2O2 lowers bromate while keeping COD removal on target.
Diagnostic: Sample bromate daily on the AOP effluent for at least one residence time after any change in ozone dose or O3:H2O2 ratio. Use ion chromatography with a bromate-specific column. Fix: In a peroxone train, lower the O3:H2O2 ratio so that more oxidation is carried by ·OH and less by direct O3. Wikipedia notes that "after further development HiPOx or similar generic systems have demonstrated the capability to control bromate" (Wikipedia, citing HiPOx post-2002 development). The trade-off is real: a 0.2 → 0.05 g O3/g H2O2 ratio drop can cut bromate formation by an order of magnitude while costing 5–15% of COD-removal rate. Prevention: Where economically justified, remove bromide upstream with ion exchange or a brackish-water RO stage; add a small H2O2 dose to push the system along the peroxone pathway. For a more operator-focused walkthrough of the trade-offs, the ozone water treatment pros and cons engineering guide covers off-gas handling in parallel.
Problem 5: Off-gas ozone destruction failures and H2O2 carryover
Symptom: Ambient ozone at the AOP skid exceeds 0.1 ppm (8-hour OSHA PEL); H2O2 residual in the effluent trips downstream biofilters or toxicity limits (>50 mg/L). Cause: The ozone destruct unit catalyst bed is exhausted, overheated, or flooded; the H2O2 dosing pump has lost calibration and is overfeeding. Both faults usually show up after a maintenance interval is missed.
Diagnostic: Mount a wall-mounted ambient O3 monitor at operator breathing zone; titrate effluent H2O2 with ceric sulfate or use a commercial test strip. Fix: Service the ozone destruct catalyst (typical change interval is 2–3 years depending on duty), recalibrate the O3 generator against a reference analyser, and recalibrate the H2O2 dosing pump against measured flow. Prevention: Interlock the destruct unit pressure switch with the generator so the generator cannot start without confirmed destruct airflow — a wiring change, not a capital change. Confirm the pH probe and the chemical dosing system working principle guide setup on the same PLC scan so a pH excursion also pauses peroxide feed.
Problem-to-configuration map: which AOP type breaks how
Use the matrix below to jump from your reactor type to the right problem section. Cells are rated High / Medium / Low relevance based on how often that failure mode shows up in operating data from the ~500 commercialised AOP installations worldwide, most of which are in Europe and the United States (Wikipedia).
| Failure mode | Fenton / photo-Fenton | Ozone & peroxone | UV / H2O2 |
|---|---|---|---|
| pH / temperature drift | H | M | M |
| Iron sludge accumulation | H | L | L |
| UV lamp aging & sleeve fouling | L (photo-Fenton only) | M (UV/O3) | H |
| Bromate formation | L | H | M (if Br− in feed) |
| Off-gas / H2O2 carryover | M (H2O2) | H (O3) | M (H2O2) |
| Poor ·OH yield from feed matrix | H | M | M |
| Reactant distribution in full-scale reactor | M | H | M |
| Catalyst fouling | H (Fe) | L | M (TiO2) |
Configurations that combine ozone + UV inherit bromate risk on top of UV-aging risk. Fenton variants inherit sludge and pH risk as a coupled pair — fixing one without the other usually fails.
When to repair, retrofit, or replace the AOP skid
Translate the troubleshooting above into a decision a plant engineer can take to management. Frame cost as OPEX per kg COD removed, not as absolute spend — Wikipedia notes that AOPs "still have not been put into commercial use on a large scale … mostly because of relatively high associated costs" (Wikipedia), so the only honest comparison is per-unit removal.
| Decision | Trigger | Typical action | Benchmark |
|---|---|---|---|
| Repair | pH probe calibration, peroxide pump scaling, UV sleeve fouling, O3 destruct catalyst exhaustion | Replace probe, rebuild pump head, CIP sleeve, change destruct catalyst | < 5% of skid CAPEX; < 1 week downtime |
| Retrofit | Chronic bromate, persistent iron sludge, UV lamps aging faster than rated life, visible-light photocatalyst pilot | Add catalytic O3 destruct, swap to fluidised-bed Fenton, add g-C3N4 visible-light stage, install RO for Br− removal | 10–40% of skid CAPEX; < 4 weeks downtime |
| Replace | Reactor cannot hold 2.5–4.5 pH even with new dosing; installed UV reactor volume is undersized for the flow; corrosion has compromised the vessel | New skid sized to the actual flow and feed COD with > 30% redundancy | Full CAPEX; compare to OPEX trajectory of the existing skid over 3 more years |
For OPEX framing, the AOP retrofit energy benchmarking guide walks through how to put kWh, kg COD, and $/m3 on the same axis — useful when you are pitching a retrofit to a CFO who only sees the absolute spend. If the underlying TSS is the binding constraint on discharge rather than COD, the effluent TSS troubleshooting guide covers the upstream fix.
Frequently Asked Questions
What are the most common AOP system problems?
The five failure modes a tertiary-skid operator should expect, in rough order of frequency, are: (1) pH or temperature drift out of the 2.5–4.5 / 30–50 °C window, (2) iron sludge accumulation in Fenton reactors, (3) UV lamp aging and quartz sleeve fouling, (4) bromate formation in ozone or peroxone trains, and (5) off-gas O3 or H2O2 carryover (Wikipedia, AOP field survey). Catalyst fouling and reactant distribution are flagged as ongoing research challenges for full-scale reactors (Wikipedia).
How do you fix low hydroxyl radical yield?
Bring the reactor back inside the 2.5–4.5 pH and 30–50 °C operating window (Wikipedia). Beyond that, the yield collapses because H2O2 decomposes into O2 and H2O via the self-scavenging path and the Fe2+ → Fe3+ cycle stalls. A bench-scale jar test at pH 2.5, 3.5, and 4.5 with a fixed H2O2 dose confirms the diagnosis before you spend on a hardware change.
How often do AOP UV lamps need replacing?
Wikipedia states that UV lamps "typically need replacement every few years". In practice, a medium-pressure lamp running 24/7 in a UV/H2O2 reactor reaches end-of-useful-life at roughly 8,000–12,000 hours, which is 11–17 months of continuous service. Replace on runtime hours, not on visible output, because UV intensity drops long before the lamp looks dim.
How is bromate controlled in peroxone systems?
Two levers. First, lower the O3:H2O2 ratio so more oxidation is carried by ·OH and less by direct O3 — Wikipedia notes that "after further development HiPOx or similar generic systems have demonstrated the capability to control bromate" (Wikipedia). Second, remove bromide upstream with ion exchange or a brackish-water RO stage where the water balance allows it. A daily bromate IC measurement on the AOP effluent is the only reliable confirmation that either lever is working.
When should an AOP system be replaced instead of repaired?
Replace when the reactor cannot hold the 2.5–4.5 pH window even with new dosing and probe calibration, when the installed UV reactor volume is undersized for the actual flow and feed matrix, or when corrosion has compromised the pressure vessel. Retrofit a sub-component (catalytic O3 destruct, fluidised-bed Fenton, visible-light photocatalyst pilot) when the failure is chronic but localised. Repair when the failure is a probe, a pump, or a sleeve — anything that does not require changing the skid's fundamental sizing. Frame all three decisions as OPEX per kg COD removed rather than absolute spend, because AOPs are high-cost processes where that ratio is the only honest comparison (Wikipedia).