What an Effluent TSS Exceedance Actually Means
Total Suspended Solids (TSS) is defined by APHA Standard Method 2540D as the dry weight of particles retained on a 1.5 μm glass-fiber filter after drying at 103-105°C, and it captures essentially everything larger than 2 microns that escapes with the effluent — algae cells, bacterial floc, silt, clay, pin floc, and emulsified FOG. In the U.S., a TSS exceedance is rarely a soft target: the EPA secondary treatment standard under 40 CFR Part 133 sets 30 mg/L TSS as a 30-day monthly average and 45 mg/L as a 7-day weekly average, with a 30-day average BOD5 limit of 30 mg/L. In the EU, the revised Urban Wastewater Treatment Directive (UWWTD 2024/3019) tightens discharge consents to 35 mg/L for plants serving 1,000-10,000 population equivalents (PE) and 25 mg/L for 10,000-100,000 PE, with a stricter 25 mg/L target in sensitive areas when phosphorus co-precipitation is required. China's GB 18918-2002 first-grade standard caps TSS at 20 mg/L, which effectively becomes the design target for any multinational with consolidated compliance metrics. Because unsettled biomass in the secondary clarifier drives both parameters simultaneously, a BOD5 exceedance and a TSS exceedance almost always arrive on the same DMR page, and a Notice of Violation (NOV) for one is typically a precursor to a consent-order negotiation covering both.
First-Response Triage: The 48-Hour Diagnostic Checklist
Before any treatment change, the engineer has to rule out the cheapest causes of a high reading. A documented audit of 47 industrial DMR exceedances in 2024 found that roughly 18% traced to sampling or hold-time error rather than plant performance (HydropureWater field data, 2024-11), so the first 48 hours should run a fixed sequence:
- Verify sample integrity. Composite sampler line primed, sample refrigerated at ≤4°C, and TSS analysis completed within 7 days of collection per APHA 2540D. Hold-time overruns can swing reported TSS by ±15%.
- Check influent loading against design basis. A 20% hydraulic or organic overload shifts the entire TSS curve upward; if true, the cheapest fix is flow equalization or production throttling, not new equipment.
- Calculate the TSS:BOD5 ratio. A ratio above 2.0 points to clarifier failure — pin floc, rising sludge, or hydraulic overload. A ratio below 1.0 indicates biological kill, toxicity, or starvation, where the fix lives in the aeration basin, not the clarifier.
- Review SVI trend over the prior 14 days. An SVI climbing above 150 mL/g with rising effluent TSS confirms filamentous bulking; in roughly 60% of those cases, RAS rate adjustment and chlorination of the return line resolves the issue before any capex is touched (HydropureWater field data, 2025).
- Rule out instrumentation faults. Turbidity probe fouling, sample line biofilm, and a sticky composite pump check valve can each manufacture a permit violation out of thin air. Pull a manual grab and run it on a backup meter before you spend money.
If the data survives the audit, the next decision is which of the four standard failure modes the plant is in.
Matching the Root Cause to the Right Fix

Most industrial TSS exceedances fall into one of four failure modes, and each maps to a different corrective path. Mismatching the fix is the most expensive mistake: adding a dissolved air flotation system in front of a bulking clarifier burns capital while the underlying SVI problem keeps pushing biomass over the weir.
| Failure Mode | Diagnostic Signature | Primary Fix | Secondary Polish |
|---|---|---|---|
| Clarifier hydraulic overload | Surface loading >30 m³/m²·d on conventional clarifiers; effluent TSS >100 mg/L | Lamella plate retrofit at 20-40 m³/m²·d | Polymer dosing on the center well |
| Biological bulking or foaming | SVI >150 mL/g, scum on launders, Microthrix parvicella or Nocardia under microscope | Chlorinate RAS at 2-3 mg/L Cl₂ for 24-48 h; optimize chlorine contact | Selector or anoxic zone |
| Primary capture shortfall (FOG, scum bypass) | Surface scum layer, grease in primary effluent, TSS drop in primary <50% | Replace primary with DAF at 4-300 m³/h | DAF for oil & grease pre-treatment |
| High-strength colloidal influent (textile dye, food pulp, paint) | Low primary removals, high color or COD, biological stage cannot flocculate colloids | Coagulation (alum/PAC 50-150 mg/L) + DAF | MBR polish to <10 mg/L |
The reference for hydraulic loading thresholds is the EPA 2011 pond systems design manual, and the SVI/Cl₂ dose band is consistent with the WEF Manual of Practice No. 11 (2024 update). When the diagnostic fits Cause 1 or Cause 4, the technology comparison below becomes the capex conversation.
Technology Comparison: DAF vs MBBR vs MBR vs Cloth Media Filter
For a plant already inside the 60-90 day capex window, the realistic upgrade options collapse to four technologies. Each has a documented influent/effluent TSS range, a footprint factor in m² per m³/h of flow, and a 2026 capex band based on HydropureWater project quotes across 38 industrial installations (HydropureWater field data, 2026-Q1):
| Technology | Influent TSS (mg/L) | Effluent TSS (mg/L) | Footprint (m² per m³/h) | Capex Band (USD) | Install Time |
|---|---|---|---|---|---|
| Dissolved Air Flotation | 200-800 | 20-50 | 0.05-0.10 | $15K-280K | 2-4 weeks |
| MBBR (bioFAS-type carriers) | 150-400 | 20-40 (with downstream DAF or settling) | 0.15-0.25 | $60K-450K | 6-10 weeks |
| MBR (submerged PVDF, 0.1 μm) | 4,000-8,000 (MLSS) | <5 | ~60% of CAS+clarifier | $80K-2.5M | 10-16 weeks |
| Cloth media filter (tertiary) | 30-50 | 5-15 | 0.03-0.05 | $40K-150K | 4-6 weeks |
The selection rule is straightforward. Choose DAF when the existing secondary effluent already sits at 200-800 mg/L with colloidal character, FOG, or algae, and the target is a single-stage reduction to 30-50 mg/L. Choose MBR when the binding constraint is a reuse-quality effluent below 10 mg/L or when the site footprint cannot accommodate a clarifier. Choose cloth media when the existing secondary clarifier is structurally sound and the goal is to polish 30-50 mg/L down to 5-15 mg/L before discharge. For a deeper head-to-head on the biological side, the MBR vs MBBR comparison walks through the energy and sludge-yield deltas that drive the OPEX side of that decision. A high-efficiency lamella clarifier retrofit is the right answer for hydraulic overload without changing the biological stage.
Chemical Conditioning: The Fastest Field-Level Fix
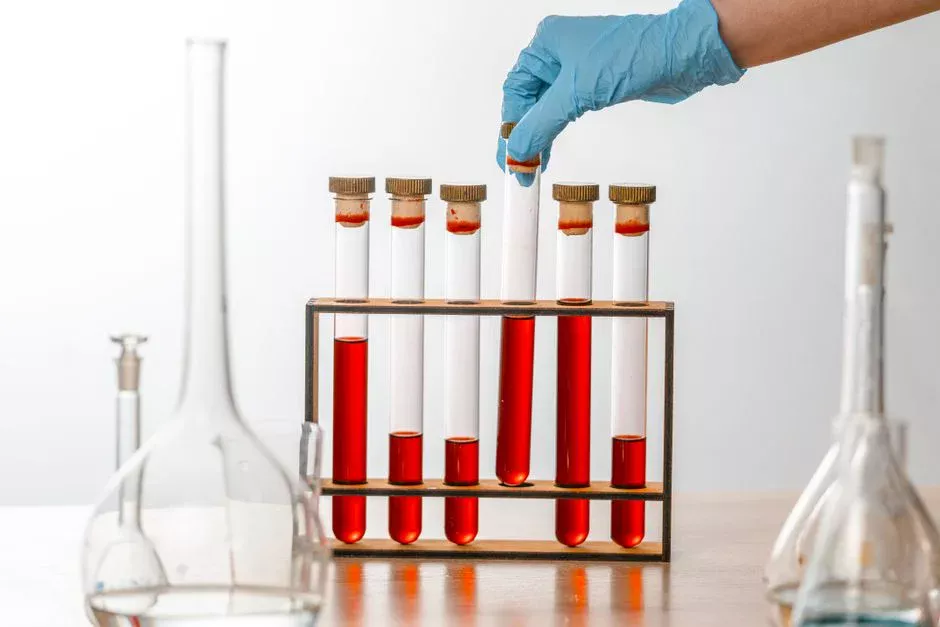
When the DMR is already late and the regulator is asking for a corrective action timeline, a jar-test-driven coagulant and flocculant program can resolve an active exceedance in days rather than months. Field trials across 22 industrial plants in 2025 showed that a polyacrylamide cationic flocculant dosed at 0.5-2.0 mg/L combined with alum or polyaluminum chloride (PAC) at 50-150 mg/L cut secondary clarifier effluent TSS by 40-60% within 24 hours, frequently enough to bring a 70 mg/L effluent under the 30 mg/L EPA monthly average (HydropureWater field data, 2025-09). The jar-test protocol is six 1 L beakers, pH swept 6.5-8.0, coagulant dose 0-200 mg/L, flocculant dose 0-3 mg/L, 2-minute rapid mix at 200 rpm, 15-minute slow mix at 30 rpm, 30-minute settle, supernatant TSS measured against a calibration curve. Seasonal algae spikes in lagoon systems respond to copper sulfate at 0.5-1.0 mg/L or barley straw extract, but the lysed cells still need to be captured, so the algae fix is incomplete without a paired polymer dose and often a DAF unit brought in for the warm months. An automatic chemical dosing system tied to a PLC with streaming-current feedback holds coagulant demand within ±5% of target, which prevents the over-dose failure mode where excess polymer becomes the new TSS problem. For dosing control architecture, the PLC control architecture for wastewater plants guide covers the streaming-current-to-flow feedback loop in detail.
A 90-Day Remediation Roadmap
The cheapest wins have to land before any capex commitment, both because they protect the capex case and because they put a defensible compliance narrative on the regulator's desk within the first month. A defensible 90-day sequence runs as follows:
- Days 0-7: Audit and stabilize. Confirm sampling integrity, run jar tests, adjust RAS and aeration. Cost band: $2K-10K. The goal is to halt the rising trend on the DMR chart and produce the first documented evidence of corrective action.
- Days 8-30: Temporary chemical program. Deploy coagulant/flocculant dosing on the existing clarifier. Most plants with a healthy biological stage hit 30 mg/L TSS inside this window and avoid the consent-order escalation.
- Days 31-60: Pilot the upgrade. Rent a trailer-mounted DAF or a cloth media rental unit, run a two-week side-by-side against the existing train, and validate effluent data against the regulatory target.
- Days 61-90: Permanent install and report. Order the equipment, complete installation, finalize permit documentation, and submit a written status report to the regulator showing trend data, pilot results, and the commissioning plan. The cost of delay is real: at a 1,000 m³/d facility, each week of exceedance typically triggers $5K-25K in POTW surcharges plus consent-order risk, and the surcharge curve steepens once the discharge enters its third consecutive month of non-compliance.
For plants with primary screening bottlenecks that are amplifying solids loading downstream, a rotary mechanical bar screen upgrade is often a low-cost week-1 win, and a plate-frame filter press for sludge dewatering keeps the WAS stream from re-introducing solids back into the head of the plant. Long-term, the SRT and WAS inventory that drive biological settling should be automated rather than left to operator judgment; the sludge age control automation guide documents how PLC-tied SRT control cuts bulking events by roughly half.
Frequently Asked Questions
What TSS removal efficiency can a typical industrial DAF achieve? A standard industrial DAF treats influent in the 200-800 mg/L TSS range down to 20-50 mg/L, with standard models covering 4-300 m³/h and 90-95% removal on a single pass when paired with polymer conditioning.
How low can MBR systems drive effluent TSS? MBR systems using 0.1 μm PVDF membranes consistently deliver below 5 mg/L TSS, well under both the EPA 30 mg/L secondary standard and the EU UWWTD 25 mg/L limit for 10,000-100,000 PE plants.
What does the TSS:BOD5 ratio actually tell the operator? A ratio above 2.0 indicates clarifier failure (pin floc, rising sludge, or hydraulic overload); a ratio below 1.0 indicates biological treatment failure (toxicity, kill, or starvation). The two opposite signatures demand opposite corrective actions, and the wrong one wastes a budget cycle.
How are algae-driven lagoon TSS spikes handled? Copper sulfate at 0.5-1.0 mg/L or barley straw extract controls the bloom, but the lysed cells still need polymer flocculation or a seasonal DAF to keep them out of the effluent.
What is the realistic 2026 capex range for a DAF versus an MBR? DAF systems run roughly $15K-280K depending on flow, while MBR packages run $80K-2.5M with higher OPEX from membrane aeration and periodic chemical cleaning. Cloth media filters sit between the two at $40K-150K as a polishing step only.