What Goes Into the SBR Plant Operating Cost Breakdown
SBR (sequencing batch reactor) plant operating cost in 2026 typically runs $0.18–$0.42 per m³ treated for municipal-industrial flows, dominated by aeration energy at 45–60% of OPEX, followed by sludge handling at 15–25%, labor at 8–15%, and chemicals at 3–8%. A 5,000 m³/day SBR plant spends $330K–$760K per year to operate, with the largest savings lever being dissolved-oxygen control strategy.
Every SBR owner should track six canonical OPEX line items so vendor cost sheets map to a common structure: (1) energy for aeration blowers, mixers, influent/effluent pumps, decanter drives, and lighting; (2) sludge handling for waste activated sludge (WAS) thickening, dewatering, transport, and tipping; (3) labor for operators, lab techs, and supervision; (4) chemicals for nutrient precipitation, pH adjustment, supplemental carbon, and polymer; (5) maintenance for preventive and corrective parts and service; and (6) consumables/membranes for plants that have hybridized SBR with MBR cassettes.
Compared to continuous-flow activated sludge, the SBR's batch mode eliminates return activated sludge (RAS) pumping, but it concentrates aeration into intermittent high-load peaks, which raises the energy share of OPEX. Use the per-m³ benchmark and the percentage bands below as the sanity check against any vendor quote.
| OPEX line | Share of annual OPEX | Typical $/m³ (2026) | Primary driver parameter |
|---|---|---|---|
| Energy (aeration + pumps + mixing) | 45–60% | $0.07–$0.30 | DO setpoint, blower control, diffuser condition |
| Sludge handling | 15–25% | $0.03–$0.10 | SRT, observed yield, dewatering efficiency |
| Labor | 8–15% | $0.02–$0.06 | Automation level, plant footprint, shifts |
| Chemicals | 3–8% | $0.01–$0.05 | Influent C:N:P ratio, effluent P limit |
| Maintenance | 5–10% | $0.01–$0.04 | CAPEX, equipment age, service contract |
| Consumables / membranes (if hybridized) | 0–15% | $0.00–$0.06 | Membrane flux, CIP frequency |
Energy Costs: The 45–60% Line That Defines the Plant
Aeration blowers consume 60–75% of total plant kWh in a typical SBR, with influent and effluent pumps adding 10–18%, mixers during non-aerated phases 5–10%, and decanter drives, lighting, and instrumentation taking the remainder. Specific energy for SBR aeration on municipal-strength wastewater (BOD 200–350 mg/L) runs 0.3–0.6 kWh per m³ treated; industrial wastewater with higher organic or nitrogen loading pushes that to 0.8–1.4 kWh/m³ (HydropureWater field data, 2026). At 2026 industrial electricity benchmarks of $0.08–$0.14/kWh in most regions, the energy line alone lands at $0.07–$0.18/m³ for municipal and $0.10–$0.30/m³ for industrial flow — which is why a single DO setpoint decision can swing six figures on a mid-size plant.
Three design-driven parameters move the energy needle more than any other:
- DO setpoint — each 0.5 mg/L reduction during the react phase saves roughly 8–12% of blower energy, because oxygen transfer efficiency drops sharply above 2.0 mg/L in most diffusers.
- Diffuser type and age — fouled coarse-bubble diffusers waste 30–50% more energy than new fine-bubble units at the same air-flow rate; a retrofit typically pays back in 18–30 months at 2026 tariffs.
- Blower control strategy — VFD-driven blowers with a dissolved-oxygen cascade loop use 20–35% less electricity than constant-speed blowers cycling on/off against a pressure switch.
For spare-parts and service budgeting against this line, the MBBR consumables benchmark in the MBBR spare-parts OPEX breakdown shows that suspended-growth systems like SBR sit on the higher-energy side of biological-treatment options, so DO and blower control deserve the most engineering hours during commissioning.
| Electrical load | Share of kWh | Typical specific energy | 2026 unit cost impact |
|---|---|---|---|
| Aeration blowers | 60–75% | 0.3–1.4 kWh/m³ | $0.05–$0.20/m³ at $0.08–$0.14/kWh |
| Influent / effluent pumps | 10–18% | 0.05–0.15 kWh/m³ | $0.005–$0.020/m³ |
| Mixers (non-aerated phase) | 5–10% | 0.03–0.10 kWh/m³ | $0.003–$0.014/m³ |
| Decanter + instrumentation | 2–5% | 0.01–0.05 kWh/m³ | $0.001–$0.007/m³ |
Sludge Handling: The Hidden 15–25% That Tracks With SRT
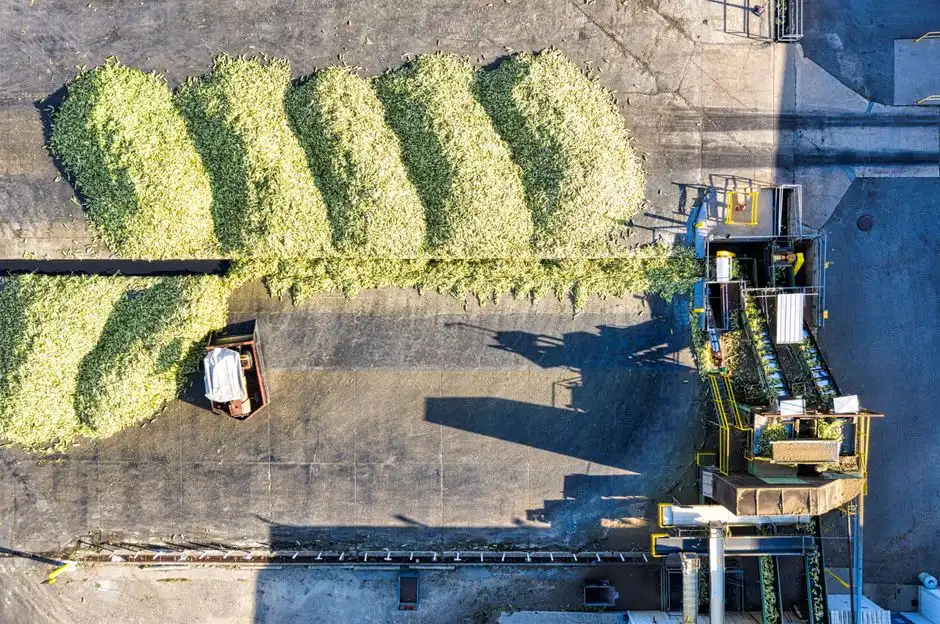
Waste activated sludge in an SBR is drawn during the react or settle phase, and observed yield typically runs 0.3–0.5 kg TSS per kg BOD removed for municipal wastewater, climbing higher for industrial influent with high particulate or slowly biodegradable organics. The cost stack on this line is thickening (gravity belt or DAF) plus dewatering (filter press or centrifuge) plus transport plus tipping fee at landfill, incinerator, or land-application site. 2026 tipping fees sit at $40–$120 per wet ton in most of North America and Asia, and $200+/ton in the EU and Japan (regional benchmarking, 2026).
The single design lever that moves this line the most is SRT. Extending SRT from 10 days to 20–25 days reduces WAS production by roughly 40–50% because a larger fraction of organics is oxidized endogenously — but it increases aeration tankage requirement and raises the energy line by 5–10%. The net is almost always positive on sites where tipping fees exceed $60/wet ton. Polymer conditioning adds $2–$8 per dry ton and dewatering electricity adds $5–$15 per dry ton on top of the capital write-down for the dewatering unit, both covered in detail in the sludge thickening cost reduction guide.
Worked mini-example for a 5,000 m³/day plant at 250 mg/L BOD with 95% removal: 1,188 kg BOD/day removed × 0.4 kg TSS/kg BOD = 475 kg TSS/day wasted sludge. Thickened to 2% solids that is roughly 24 m³/day of thickened sludge, or about 175 m³/day at 0.5% if taken straight off the basin. At 2026 polymer, energy, transport, and tipping combined, that dewatering/transport sub-line lands at $25K–$80K/year on its own — before any capital write-down.
Labor, Chemicals, and Maintenance: The Smaller but Non-Negotiable Lines
Together these three lines account for roughly 25–35% of annual OPEX, and they are the lines most often under-estimated by vendors using optimistic automation assumptions. Labor at 8–15% of OPEX is driven by automation level: a modern SBR with full PLC/SCADA and remote monitoring runs 2–4 hours of operator attention per day, while a legacy plant with manual valve sequencing can demand 6–8 hours. At $25–$45/hour fully loaded, a 5,000 m³/day plant lands at $25K–$70K/year for operations, plus another $10K–$25K for routine lab work (BOD, TSS, ammonia, microscopic exam) and supervision overhead.
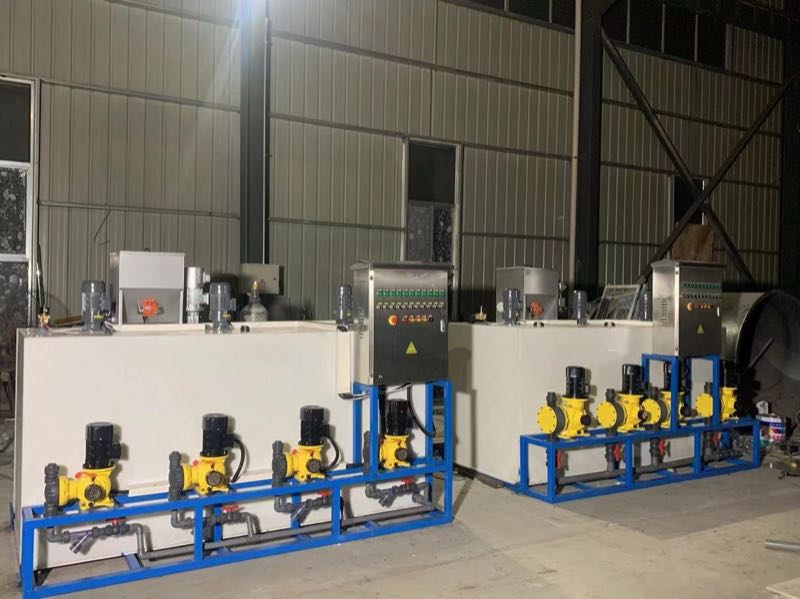
Chemicals at 3–8% of OPEX break down into four sub-lines: phosphorus precipitation with FeCl₃ or alum at $0.005–$0.020/m³ when TP effluent is regulated; pH adjustment using lime or caustic at $0.002–$0.010/m³ for low-alkalinity industrial influent; supplemental carbon (methanol or acetate) for denitrification on low-COD:N influents at $0.01–$0.05/m³; and polymer for sludge dewatering, captured in the sludge section above. A PLC-controlled chemical dosing system typically reduces chemical OPEX 8–15% versus peristaltic or gravity dosing because trim control is tighter and overdosing at peak flows is avoided.
Maintenance at 5–10% of OPEX follows the 2–4%-of-CAPEX-per-year rule of thumb for biological plants. For a $3M SBR installation that is $60K–$120K/year covering blower service (oil, bearings, VFD inspection), diffuser replacement on a 3–7 year cycle, valve actuator overhaul, instrument calibration, and structural inspection of tanks. Consumables/membranes at 0–5% is the right band for a true SBR with no membrane cassette; if the plant has been hybridized with MBR-style cassettes, the consumables line jumps to 8–15% and the OPEX math shifts substantially — see the MBR cost benchmark at MBR membrane bioreactor cost guide for that hybrid scenario.
Where the Savings Actually Live: A 6-Lever Reduction Framework
A breakdown tells you where the money goes; the framework below tells you which knob to turn to move each line. Rank the levers by the dollar value at your specific electricity tariff and tipping fee before you commit CAPEX to any of them, because the same lever can be a $5K/year win on a small plant and a $90K/year win on a 10,000 m³/day plant.
| Lever | Primary cost line moved | Typical saving | Payback at 2026 prices |
|---|---|---|---|
| 1. DO setpoint tuning to 1.5–2.0 mg/L | Energy | 8–12% blower kWh per 0.5 mg/L drop | < 3 months (control work only) |
| 2. VFD on blowers with DO cascade | Energy | 20–35% vs on/off control | 12–24 months |
| 3. SRT extension to 20–25 days | Sludge + energy | 30–50% WAS reduction, 5–10% energy penalty | 6–18 months (no CAPEX) |
| 4. Fine-bubble aeration retrofit | Energy | 25–40% on 10+ year-old coarse-bubble plants | 18–30 months |
| 5. Sludge dewatering optimization | Sludge | 20–30% on sludge line via polymer tuning + plate-and-frame filter press upgrade | 18–36 months |
| 6. Automation / remote monitoring | Labor | 1–3 operator-hours/day reduction | 12–24 months |
For a mid-size 5,000 m³/day plant, stacking Levers 1, 2, and 5 typically delivers 20–28% total OPEX reduction with combined payback inside two years. The deeper dive on the same levers, with cycle-time and decanter-type trade-offs, is in the SBR operating cost 2026 OPEX breakdown.
SBR vs MABR vs Conventional Activated Sludge: A 5,000 m³/day OPEX Sanity Check
Pressure-test any vendor claim with the worked example below. Assumptions: 5,000 m³/day, municipal-strength influent at BOD 250 mg/L, 2026 industrial electricity at $0.10/kWh, EU-equivalent tipping fees near $90/wet ton, fully loaded operator cost $35/hour, mid-size automation package. All three plants meet the same effluent BOD < 20 mg/L and TSS < 20 mg/L targets.
| Cost line (annual, USD) | SBR | Conventional activated sludge (CAS) | MABR |
|---|---|---|---|
| Energy (aeration + pumps + mixing) | $195K | $175K | $135K |
| Sludge handling | $80K | $95K | $55K |
| Labor | $45K | $45K | $45K |
| Chemicals | $25K | $25K | $25K |
| Maintenance | $35K | $30K | $40K |
| Consumables / membranes | $10K | $5K | $10K |
| Total annual OPEX | $390K ($0.21/m³) | $375K ($0.21/m³) | $310K ($0.17/m³) |
SBR lands at roughly $0.21/m³ on this scenario, almost identical to conventional activated sludge once you account for the CAS clarifier's higher sludge yield offsetting its lower aeration energy. MABR (membrane-aerated biofilm reactor) runs about 20% lower OPEX because high specific surface area on the aeration membrane delivers near-complete oxygen utilization — see the MABR CAPEX/OPEX comparison for the worked numbers behind that line. Honest caveat: any of these figures moves ±20% with local labor cost, electricity tariff, and sludge disposal regime, so use this table as the shape of the answer, not the exact dollars for your site.
Frequently Asked Questions
What is the average OPEX for a sequencing batch reactor plant in 2026?
$0.18–$0.42 per m³ treated for municipal-industrial flow, or $330K–$760K per year for a 5,000 m³/day plant (HydropureWater field data, 2026).
What percentage of SBR operating cost is electricity?
Aeration energy alone is 45–60% of total OPEX, with blowers accounting for 60–75% of plant kWh.
How much does sludge handling cost for an SBR?
15–25% of OPEX, dominated by dewatering energy, polymer, and tipping fees that run $40–$200+ per wet ton regionally.
Which design lever cuts SBR OPEX the most?
Dissolved-oxygen setpoint tuning combined with VFD blower control typically delivers 20–35% energy-line reduction with payback inside 24 months.
Is SBR more expensive to operate than conventional activated sludge?
On a 5,000 m³/day municipal plant at 2026 prices, SBR and CAS land within $15K/year of each other ($390K vs $375K); MABR runs about 20% lower at $310K.
Related Equipment
- DAF system for sludge thickening — specifications, capacity range, and technical data