What SBR Operating Cost Actually Includes in 2026
Sequencing batch reactor (SBR) operating cost in 2026 typically runs USD 0.18–0.65 per m³ treated for municipal and light-industrial duty, and USD 0.55–1.40 per m³ for high-strength industrial wastewater. Energy accounts for 45–60% of that bill — mostly aeration at 0.3–2.0 kWh/m³ — with sludge handling (15–25%), labor (10–20%), and chemicals plus maintenance (8–18% combined) making up the balance. These share ranges align with WEF and EPA Energy Star benchmarks for activated-sludge facilities and hold across 2024–2025 reference data, though exact proportions shift with influent load and tariff.
OPEX must be separated from CAPEX before any procurement conversation. The top-ranking SBR technology page quotes CAPEX in the range of INR 10–15 crore (≈ USD 1.2–1.8M) for a packaged industrial build, but says nothing about what the plant costs to run. At a 1.5× CAPEX multiplier over a 20-year horizon, OPEX typically equals or exceeds CAPEX — making operating cost the bigger financial lever for a sequencing batch reactor, not the build price.
The 3–4× spread between municipal and industrial rates comes from four variables: influent BOD/COD strength, discharge limits (BOD/NH₃-N vs TN/TP), local electricity tariff (USD 0.07–0.18/kWh globally), and automation level. A manually cycled SBR in a 1,000 m³/day textile plant at 2,000 mg/L BOD can hit USD 1.40/m³; a fully automated municipal SBR at 250 mg/L BOD can sit at USD 0.20/m³. The table below breaks down the four cost buckets at typical mid-range conditions.
| OPEX Bucket | Share of Annual Cost | Typical USD/m³ (Municipal) | Typical USD/m³ (Industrial) | Primary Driver |
|---|---|---|---|---|
| Energy (aeration + mixing + decanter) | 45–60% | 0.08–0.39 | 0.25–0.84 | Blower kWh, tariff, MLSS |
| Sludge handling (dewatering + hauling) | 15–25% | 0.03–0.16 | 0.08–0.35 | SRT, yield, polymer, haul distance |
| Labor (operator + SCADA) | 10–20% | 0.02–0.13 | 0.06–0.28 | Automation level, local wage |
| Chemicals + maintenance | 8–18% | 0.01–0.12 | 0.04–0.25 | External carbon, polymer, decanter wear |
| Total | 100% | 0.18–0.65 | 0.55–1.40 | — |
For a deeper look at how these four buckets interact with other unit processes across a full plant, the 2026 industrial wastewater OPEX guide walks through aeration, clarification, and chemical systems side by side.
Energy Use: The 45–60% Line Item
A sequencing batch reactor consumes 0.3–0.8 kWh/m³ on municipal or light-industrial influent and 0.8–2.0 kWh/m³ on high-strength industrial streams (BOD > 1,000 mg/L or ammonia > 100 mg/L), per WEF Manual of Practice and 2024 EPA Energy Star industrial wastewater data. Aeration alone draws 50–70% of that total; mixing accounts for 10–20%, decanter movement and transfer pumps 10–15%, and instrumentation plus PLC 3–5%.
Worked example for a mid-size plant: 5,000 m³/day × 0.55 kWh/m³ × USD 0.11/kWh = USD 275/day ≈ USD 100,000/year in electricity. Drop the same plant onto a USD 0.16/kWh industrial tariff and the annual bill climbs past USD 145,000 — enough to fund an aeration-efficiency retrofit inside 18 months.
Batch operation inherently carries a 10–25% energy penalty versus continuous activated sludge because blowers cycle on and off, DO must recover from a depleted state at the start of each react phase, and idle periods still keep aeration equipment on standby. Modern variable frequency blowers with DO feedback recover 20–35% of that loss by matching airflow to instantaneous oxygen demand instead of running at a fixed duty point. Turbo blowers with magnetic bearings add another 10–15% on top.
| Energy Consumer Inside an SBR | Share of Total kWh | Typical kWh/m³ | Cost Lever |
|---|---|---|---|
| Aeration blowers | 50–70% | 0.15–1.40 | VFD, DO setpoint, turbo upgrade |
| Mixers / jet aerators | 10–20% | 0.03–0.40 | Intermittent mixing during react only |
| Decanter + transfer pumps | 10–15% | 0.03–0.30 | Floating decanter, VFD pump |
| Instrumentation + PLC + SCADA | 3–5% | 0.01–0.10 | Right-size sensors, sleep modes |
Two operating parameters move the energy number more than any equipment swap: MLSS and DO setpoint. Pushing MLSS from 3,000 to 5,000 mg/L raises alpha factor and cuts oxygen-transfer efficiency by 15–25%, which means the same BOD load now needs more blower kWh. Holding DO at 2.0 mg/L when 1.0 mg/L still completes nitrification wastes 20–35% of aeration energy — see Lever 1 in the cost-reduction playbook below.
Sludge Handling: The Silent 15–25%
SBR sludge yield runs 0.3–0.5 kg TSS per kg BOD removed at an SRT of 10 days and drops to 0.2–0.35 kg TSS/kg BOD at SRT 20–30 days, per Metcalf & Eddy and WEF MOP-8. For the same 5,000 m³/day plant at 250 mg/L BOD influent and 90% removal, wasted sludge is 188–313 kg TSS/day at SRT 10 versus 125–219 kg/day at SRT 25 — a 30% cut in downstream dewatering and hauling cost without changing influent conditions.
Dewatering OPEX sits in three sub-buckets. Polymer dose runs USD 0.05–0.15 per kg of dry solids, depending on sludge age and conditioner choice. Centrifuge or belt-press power draws 0.8–1.5 kWh/m³ of filtrate. Hauling the dewatered cake costs USD 20–80 per wet tonne in 2024–2025 dollars, driven by disposal route (landfill gate fee, incineration, agricultural reuse) and haul distance. Together these typically account for 15–25% of total SBR OPEX, and they grow disproportionately when SRT is short or influent carries high inert TSS.
The natural downstream equipment for SBR waste sludge is a plate-and-frame filter press, which produces a 35–45% DS cake and drops hauling mass by 40–60% versus a belt press at 18–22% DS. For high-strength streams like distillery or pharmaceutical wastewater, the filter press OPEX breakdown for high-strength waste gives a parallel cost model. If the SBR is paired with an MBR rather than a clarifier, the membrane-replacement line item enters OPEX instead — see the membrane replacement cost optimization guide for that path.
Labor, Chemicals, and Maintenance: The Remaining 20–35%
Labor is the most controllable line item and the one buyers most often overestimate. A fully automated SBR with remote SCADA needs 0.5–1.0 hour of operator attention per day — roughly USD 8K–15K/year in developed markets at a USD 30–40/hour loaded rate. A manually cycled plant, by contrast, needs 4–8 hours per day of operator presence for valve sequencing, sampling, and sludge-wasting decisions, which lands at USD 60K–120K/year at the same wage. That 8× labor gap is the single largest payback lever for a controls retrofit.
Chemicals typically take 5–10% of OPEX, dominated by external carbon for denitrification. When the BOD-to-TN ratio drops below 4:1 — common on ammonia-rich streams from landfill leachate, livestock, or chemical manufacturing — methanol or acetate dosing is required at 2.5–4.0 mg methanol per mg NO₃-N removed. Auto-dosing tied to an online NO₃ probe cuts chemical OPEX 30–50% versus timer-based feed. Phosphorus precipitation with alum or ferric chloride adds another 1–3% of OPEX where TP limits are tight.
Maintenance consumes 3–8% of OPEX. Floating mechanical decanters see a 5-year replacement cycle at USD 4K–12K, depending on diameter and material. Blower service (filter change, bearing inspection, VFD firmware updates) runs USD 2K–6K every 3 years on lobe units, more on multi-stage centrifugals. Valve actuators on the inlet, waste, and decant lines are the highest-frequency wear item, typically USD 500–1,500 per valve with 2–4 year life on a sequencing batch reactor with frequent cycling.
Across labor, chemicals, and maintenance, automation is the biggest swing factor. A well-tuned PLC with DO-based aeration control and NO₃-based carbon dosing typically returns USD 25K–80K/year in combined energy and chemical savings versus a timer-based system. The controls hardware pays for itself inside 12–24 months at 2026 electricity and methanol prices.
Seven Levers to Cut SBR Operating Cost Without Retrofits
Every lever below is implementable on an existing sequencing batch reactor without replacing the tank, blower, or decanter. Savings figures are based on a 2024 WEF case study series and field data from food and pharmaceutical SBRs running at 60–110% of design load.
- DO setpoint tuning. Drop the react-phase DO setpoint from 2.0 mg/L to 1.0 mg/L. Nitrification still completes; aeration energy falls 20–35%. Pair with an online DO probe; timer-based control cannot deliver this safely.
- Extend SRT from 10 to 25 days. Sludge yield drops 30–40%, dewatering OPEX falls proportionally, and nitrification stabilizes. If tank volume is the constraint, reduce the number of active batches per day or bleed less.
- Variable-frequency blowers with DO feedback. 25–40% energy reduction versus constant-speed blowers. Payback at 2026 USD 0.10–0.14/kWh tariffs is 18–36 months.
- Waste sludge from the end of the react phase, not the settle phase. Better thickening, lower polymer demand (15–25% dose reduction), and higher mixed-liquor concentration at wasting.
- Optimize cycle split. Cut idle time first, then shorten settle. A 1-hour idle cut on a 6-hour cycle saves ~15% energy with no effluent impact because idle blowers consume power without delivering oxygen.
- External carbon on demand only. Tie methanol dosing to an online NO₃-N probe with a 5 mg/L trigger. Cuts chemical OPEX 30–50% versus continuous feed.
- Predictive maintenance on decanter and valves. Vibration and current-monitoring on decanters, actuation counters on solenoid valves. Avoids USD 8K–20K unplanned downtime events and extends equipment life 20–30%.
| Lever | Targeted OPEX Bucket | Quantified Saving | Typical Payback |
|---|---|---|---|
| DO setpoint 2.0 → 1.0 mg/L | Energy (aeration) | 20–35% | < 3 months (probe only) |
| SRT 10 → 25 days | Sludge + energy | 30–40% sludge, 5–10% energy | 0 (operating change) |
| VFD blower + DO loop | Energy | 25–40% | 18–36 months |
| React-end sludge wasting | Sludge (polymer) | 15–25% polymer | < 1 month |
| Cycle-split optimization | Energy | 10–15% | 0 (PLC reconfiguration) |
| NO₃-based carbon dosing | Chemicals | 30–50% | 6–12 months |
| Predictive maintenance | Maintenance + downtime | 20–30% life extension | 12–18 months |
SBR vs MBR vs SBR-MBBR: 2026 OPEX Comparison
Procurement readers rarely compare a sequencing batch reactor against itself — they compare it against MBR and against SBR-MBBR hybrids. The table below uses 2026 USD/m³ ranges and the kWh/m³ energy benchmarks from the prior sections.
| Parameter | SBR | MBR | SBR-MBBR Hybrid |
|---|---|---|---|
| OPEX, municipal (USD/m³) | 0.18–0.65 | 0.35–0.95 | 0.25–0.70 |
| OPEX, industrial (USD/m³) | 0.55–1.40 | 0.85–1.80 | 0.28–0.75 |
| Energy (kWh/m³) | 0.3–2.0 | 0.8–2.5 | 0.4–1.5 |
| Aeration share of energy | 50–70% | 55–75% (membrane scour) | 45–60% |
| Sludge yield (kg TSS/kg BOD) | 0.20–0.50 | 0.20–0.45 | 0.15–0.30 |
| Footprint | Medium (2 tanks min.) | Small | Medium-large |
| Effluent TSS / BOD | ≤ 30 / ≤ 20 mg/L | ≤ 5 / ≤ 5 mg/L | ≤ 20 / ≤ 15 mg/L |
| Recurring membrane cost | None | USD 30–60/m² every 5–8 yr (8–15% of OPEX) | None (unless coupled to MBR) |
Decision rule: pick SBR for flows under 2,000 m³/day and intermittent loads (food processors, small municipalities, batch-pharma). Pick MBR for tight effluent limits and reuse duty under 500 m³/day. Pick SBR-MBBR for 2,000–20,000 m³/day industrial flows with variable BOD/TKN where biofilm carriers absorb load swings. The MBBR vs IFAS 2026 comparison has the carrier-media cost and surface-area data behind the SBR-MBBR row. For the MBR side, the MBR integrated treatment system and DF-series PVDF flat-sheet MBR modules are the natural references when effluent reuse drives the specification.
How to Specify SBR OPEX in a 2026 Supplier Contract
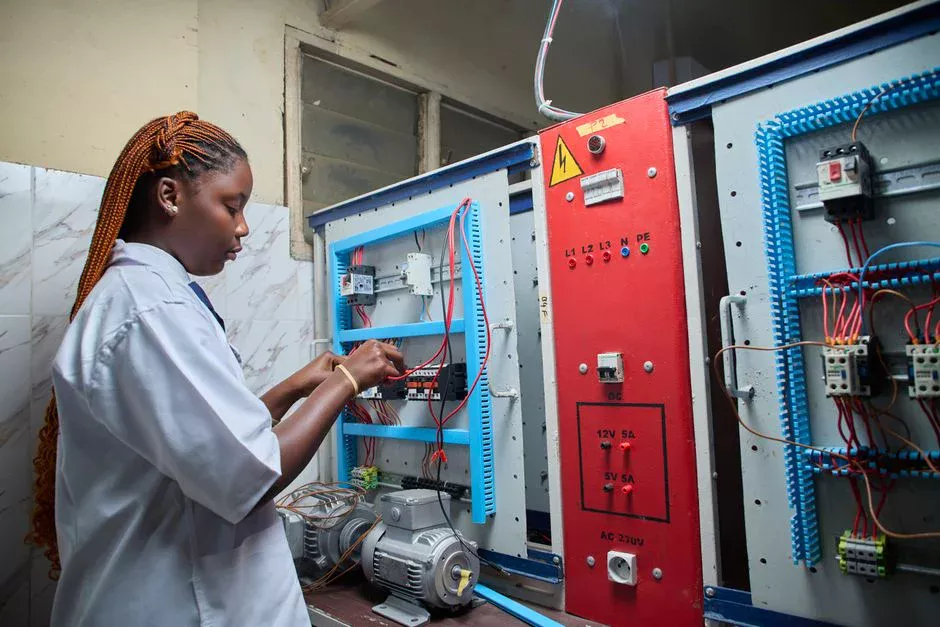
The OPEX numbers in this article only materialize on site if the supplier contract forces them to. Four specification items do that work. First, require the OEM to guarantee kWh/m³ at design load inside a performance warranty, with a 110% threshold above which they pay the difference — gives the supplier direct exposure to the aeration energy number. Second, specify the equipment that drives OPEX up front: floating mechanical decanter over fixed-pipe (lower energy, lower TSS carryover), turbo or VFD lobe blower over multi-stage centrifugal, and a PLC scope that includes DO-based aeration, NO₃-based carbon dosing, and remote SCADA. Third, demand two years of operating data from a reference plant of similar flow and influent — cycle time, energy use, sludge yield, and effluent quality, not just design values. Fourth, anchor the package on the right product line for the flow: a WSZ underground package plant for small municipal and residential flows, or upgrade to an MBR integrated treatment system when effluent limits require it.
Frequently Asked Questions
What is the typical SBR operating cost per m³ in 2026? USD 0.18–0.65/m³ for municipal and light-industrial duty, USD 0.55–1.40/m³ for high-strength industrial wastewater. Spread is driven by influent BOD, discharge limits, electricity tariff, and automation level.
How much energy does a sequencing batch reactor use per m³? 0.3–2.0 kWh/m³ depending on influent strength. Aeration accounts for 50–70% of total energy, mixing 10–20%, decanters and pumps 10–15%, and instrumentation 3–5%.
What is the fastest way to cut SBR operating cost? Extend SRT to 20–30 days, drop DO setpoint to 1.0 mg/L during react, and install VFD blowers with DO feedback. Combined energy and sludge reduction: 20–40% with paybacks under 36 months.
SBR vs MBR vs SBR-MBBR — which is cheapest to operate in 2026? SBR is cheapest on flows under 2,000 m³/day with intermittent load. SBR-MBBR wins on 2,000–20,000 m³/day variable industrial loads at USD 0.28–0.75/m³. MBR is most expensive in OPEX but wins where reuse-quality effluent is required.
What does a controls retrofit cost on an existing SBR? Typically USD 50K–200K equivalent for a 2,000–5,000 m³/day plant, covering PLC, DO and NO₃ probes, VFD on blowers, and SCADA. Payback from energy and chemical savings is 1.5–3 years at 2026 tariffs.