What 'Operating Cost' Actually Covers in an Industrial Wastewater Plant
Operating cost — OPEX — for an industrial wastewater plant is the recurring annual spend required to treat one cubic meter of effluent, expressed either as $/m³ or $/year. It is structurally separate from CAPEX, the upfront $200,000–$1,500,000+ system purchase (HydropureWater field data, 2026) that depreciates over 10–20 years. Most finance teams misclassify the two, which is why "OPEX" numbers from competing quotes look incomparable.
The five canonical categories every industrial plant should track are: electricity, chemicals and dosing agents, sludge disposal, membrane and consumable replacement, and labor plus maintenance. These five line items cover 90–95% of recurring spend. For 2026, the all-in OPEX band sits at $0.18–$2.80 per cubic meter treated, with the low end representing high-flow food or textile plants with simple biological treatment, and the high end representing low-flow electroplating or pharma plants with multi-stage polishing (HydropureWater published 2026 benchmarks).
The remaining 5–10% is the category that quietly destroys budgets: hidden OPEX. This includes third-party lab analysis ($200–$800/sample for heavy metals or PFAS), sludge transport permits, compliance sampling against local discharge limits, SCADA/data subscription fees ($1,200–$6,000/year for cloud historians), and emergency callouts during permit excursions. Plants that budget only against the five main line items routinely overrun by 15–20%.
Line-Item Breakdown: How Each Cost Category Behaves
Electricity is the single largest line item in most biological treatment plants, typically 25–40% of total OPEX. Aeration blowers drive the load: a 1 kW blower running 24 hours per day at $0.10/kWh consumes 8,760 kWh/year, which is $876/year per kW installed at flat tariff. A 30 kW blower room therefore burns $26,280/year before any other electrical load — and that is just the aeration stage. Mixers, return sludge pumps, UV lamps, and control panels add another 30–50% on top.
Chemicals and dosing agents account for 15–30% of OPEX, with the specific reagents dictated by influent chemistry. Standard workhorses are PAC (polyaluminum chloride) at 50–300 mg/L for coagulation, anionic polyacrylamide at 2–10 mg/L as flocculant, NaOH or H₂SO₄ for pH adjustment, and specialty reagents such as Fenton's H₂O₂/FeSO₄ for recalcitrant COD or NaClO for disinfection. A PLC-controlled automatic chemical dosing system typically cuts this line by 15–25% versus manual dosing because it tracks actual influent load rather than a fixed setpoint.
Sludge disposal runs 10–25% of OPEX and is the most volatile line item, since the cost is wet tons × (haul rate + tipping fee) × distance. Dewatered cake at 65% moisture weighs roughly half as much as cake at 80% moisture for the same dry solids mass — that single percentage point difference can halve the disposal bill. For a plant producing 6 tons/day of dewatered cake, dropping moisture from 80% to 65% cuts disposal tonnage from ~10.7 to ~6.0 tons/day.
Membrane and consumable replacement is 5–15% of OPEX and is concentrated in plants with MBR or RO stages. MBR modules typically last 3–7 years depending on flux (15–25 LMH is typical) and cleaning frequency; RO membranes 3–5 years. A packaged MBR membrane bioreactor wastewater treatment system consolidates biological reaction and solid-liquid separation into one skid, but the membrane replacement reserve should still be budgeted explicitly.
Labor and maintenance is 10–20% of OPEX, but the spread is enormous. A fully automated packaged plant with one operator doing daily rounds runs <5% on labor; a 24/7-staffed conventional activated sludge plant with on-call electricians and instrument techs can hit 25%. Maintenance splits roughly 60% preventive (lubrication, calibration, belt replacement) and 40% corrective (failed pumps, clogged diffusers).
| OPEX Line Item | Typical % of Total OPEX | Primary Driver | Largest Engineering Lever |
|---|---|---|---|
| Electricity | 25–40% | Aeration blower kW × hours | VFD on blower, DO-based control |
| Chemicals | 15–30% | Influent load + dosing strategy | Automatic dosing, demand-based control |
| Sludge disposal | 10–25% | Wet tons × tipping fee | Dewatering to 65% moisture |
| Membranes / consumables | 5–15% | Flux, cleaning frequency | MBR operating flux optimization |
| Labor + maintenance | 10–20% | Plant automation level | Packaged/skidded design, remote monitoring |
OPEX Benchmarks by Industry: $/m³ Comparison
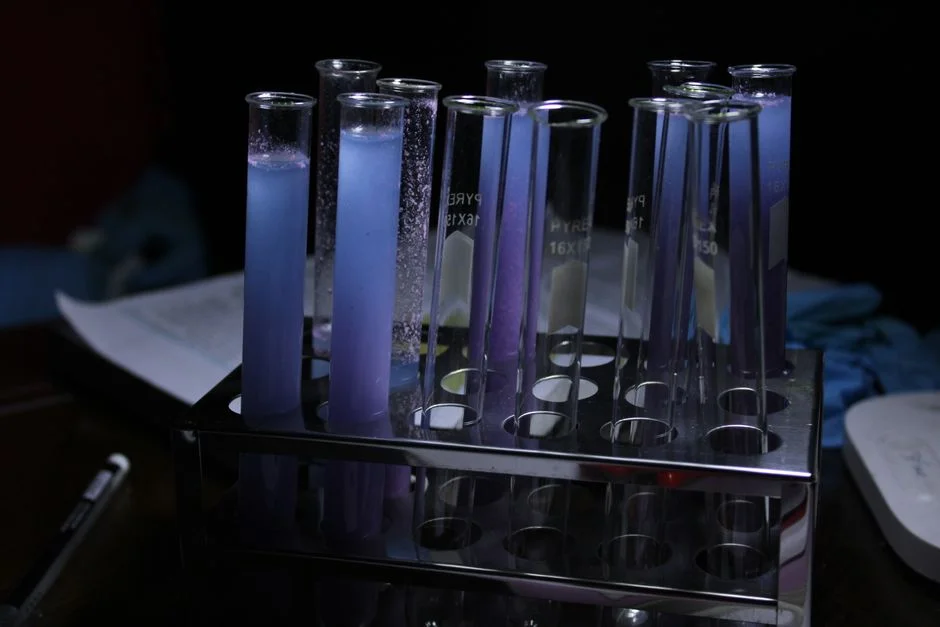
Industry matters more than plant size when benchmarking OPEX, because influent chemistry sets the chemical and sludge load regardless of flow. The ranges below are drawn from HydropureWater 2026 project data across commissioned plants in food, textile, electroplating, petrochemical, and pharmaceutical sectors.
Electroplating sits at the top of the range, $0.45–$2.80/m³, because heavy metal precipitation (NaOH for pH swing, Na₂S for chrome precipitation) and the resulting metal-rich sludge drive both chemical and disposal costs. Meat processing and food plants run $0.18–$0.95/m³ — low chemical cost but high aeration energy due to BOD/COD loads of 2,000–8,000 mg/L; a DAF pretreatment step typically pulls this down toward the bottom of the range. Textile and dyeing wastewater costs $0.30–$1.40/m³, driven by color removal reagents, high salinity, and hot discharge that stresses biological stages. Petrochemical and refinery effluent runs $0.50–$1.80/m³, with oil/grease pretreatment (API separator, CPI) followed by strict discharge limits on COD, ammonia, and phenols. Pharmaceutical effluent is the most expensive, $0.60–$2.20/m³, almost always requiring MBR + RO polish to meet either reuse or stringent surface-discharge limits.
| Industry | OPEX Range ($/m³) | Dominant Cost Driver | Typical Treatment Train |
|---|---|---|---|
| Electroplating | $0.45–$2.80 | Chemicals + sludge | Cracking + precipitation + sand filter |
| Food / meat processing | $0.18–$0.95 | Electricity (aeration) | DAF + biological + disinfection |
| Textile / dyeing | $0.30–$1.40 | Chemicals (color removal) | Equalization + biological + decolorization |
| Petrochemical / refinery | $0.50–$1.80 | Sludge + pretreatment OPEX | API + biological + tertiary |
| Pharmaceutical | $0.60–$2.20 | Membranes + chemicals | MBR + RO polish for reuse |
Worked Example: OPEX for a 500 m³/day Food Processing Plant
Walking through a real number is the fastest way to validate the percentages. Take a food processing plant treating 500 m³/day, or 182,500 m³/year, with influent COD of 3,000 mg/L discharging to a municipal sewer with a BOD limit of 300 mg/L.
Electricity: Total connected load is 45 kW across blowers, pumps, mixers, and UV. At 60% utilization and $0.10/kWh, annual energy cost is 45 × 0.60 × 8,760 × $0.10 ≈ $23,650/year (~28% of OPEX).
Chemicals: PAC at 150 mg/L, polyacrylamide at 5 mg/L, and NaOH for pH trim. At 2026 unit prices this runs roughly $0.10/m³ treated, or $18,250/year (~21%).
Sludge disposal: Biological sludge at 75% moisture from a belt press yields ~6 wet tons/day. At $80/ton tipping + haul, this is 6 × 365 × $80 = $175,200/year if left undewatered; with proper dewatering dropping moisture from 80% to 65%, the same dry solids mass becomes ~3.5 wet tons/day, cutting disposal to roughly $102,200/year. The $73,000/year delta is the single largest savings lever available to this plant.
Labor and consumables: 1 FTE operator + 0.5 FTE maintenance + UV lamp replacement, membrane cleaning chemicals, etc., totals ~$15,000/year (~9%).
Summed, total OPEX is approximately $159,000/year, or about $0.87/m³ if the sludge line is properly dewatered — well within the food-industry benchmark of $0.18–$0.95/m³. Without dewatering optimization, the same plant runs closer to $1.27/m³, illustrating how a single line item can swing the total by 30–40%.
Cost-Reduction Levers: Where to Cut Without Violating Discharge Limits
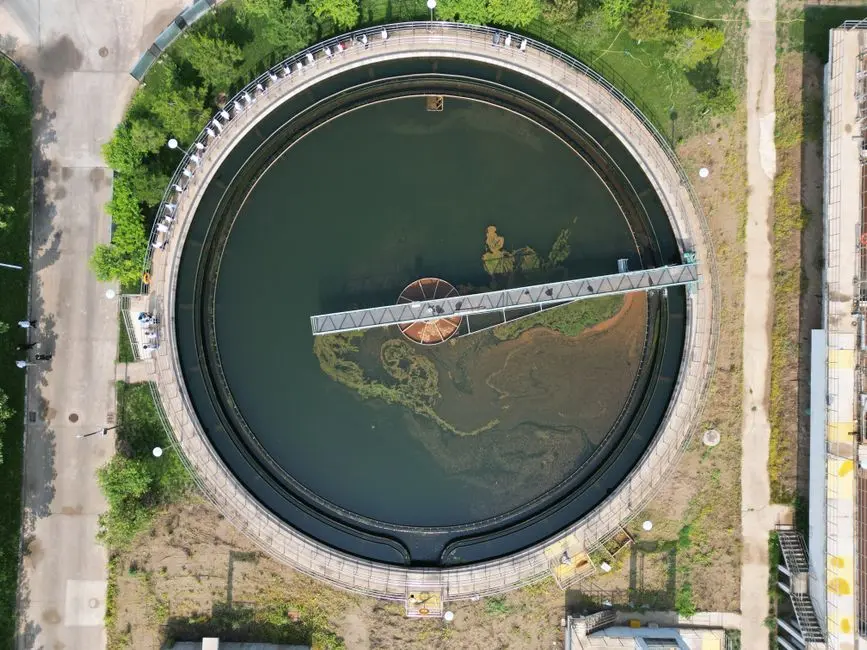
Every line item in the breakdown has at least one engineering lever that can move it 15–35% without compromising compliance. The list below is ranked by typical ROI for a 500–2,000 m³/day industrial plant.
- Install VFDs on aeration blowers. Dissolved-oxygen-based control with a VFD typically saves 20–35% on aeration energy, with ROI under 18 months at industrial electricity tariffs of $0.08–$0.12/kWh. On a $23,650/year aeration bill, that is $4,700–$8,300/year saved.
- Switch to demand-based chemical dosing. A PLC-controlled automatic chemical dosing system linked to flow and load meters cuts chemical consumption 15–25% versus fixed-rate dosing, primarily by avoiding overdose during low-load shifts. Savings on a $18,000/year chemical line: $2,700–$4,500/year.
- Add DAF upstream of biological treatment. A dissolved air flotation (DAF) system removes 30–50% of influent COD as float before it reaches the aeration basin. This shrinks blower kW, cuts sludge mass, and reduces chemical demand downstream. Plants that add DAF typically see 20–30% total OPEX reduction; for ongoing operating cost benchmarking see the DAF system maintenance cost breakdown for 2026.
- Optimize sludge dewatering. A plate and frame filter press routinely achieves 60–65% cake moisture versus 78–82% on a standard belt press, halving wet tons for disposal. On a 6 ton/day cake stream at $80/ton, the savings approach $40,000–$70,000/year — typically the largest single OPEX lever in any biological plant.
- Reuse treated effluent. Routing polished effluent to cooling tower make-up or landscape irrigation eliminates both water purchase cost and discharge fees. For high-tariff regions ($2–$4/m³ water cost), reuse can offset $50,000–$200,000/year in input water spend on a mid-sized plant.
- Consider MBR over conventional ASP. A MBR membrane bioreactor wastewater treatment system produces less waste sludge (higher MLSS, longer SRT), smaller footprint, and better effluent quality. Membrane OPEX is higher, but total OPEX is usually neutral to 10% lower once labor and sludge hauling are netted out.
2026 OPEX Outlook: Energy, Chemical, and Regulatory Trends
Industrial electricity tariffs rose 4–8% year-on-year through 2025–2026 across most regions, and there is no near-term catalyst for reversal. Expect energy's share of OPEX to climb by 1–3 percentage points by 2027 absent active VFD or aeration-control projects. Stricter PFAS, total nitrogen, and micropollutant discharge limits are pushing more plants toward MBR + RO polishing, which raises membrane OPEX but reduces chemical polishing demand — a net wash on the OPEX line. Sludge disposal is the fastest-rising line in regions restricting landfill of wet sludge (most of the EU, parts of coastal China, and several US states); a dewatering upgrade pays back faster every year it is deferred. Digital water and remote monitoring adoption is growing at roughly 12% CAGR; for plants weighing the spend, the remote monitoring system pricing for wastewater plants in 2026 guide lays out typical hardware and subscription costs. Sector-specific OPEX trajectories — for example, nickel and chrome discharge limits tightening the electroplating cost curve — are tracked in the electroplating wastewater plant OPEX breakdown for 2026.
Frequently Asked Questions

What is a typical OPEX per cubic meter for an industrial wastewater plant in 2026? The all-in band is $0.18–$2.80/m³ across industries, with food and textile at the low end and electroplating and pharmaceutical at the high end (HydropureWater 2026 benchmarks).
Which line item is usually the largest in a biological wastewater plant? Electricity, at 25–40% of OPEX, with aeration blowers as the dominant single load.
How much can VFDs on aeration blowers realistically save? 20–35% on aeration energy, with payback under 18 months at $0.08–$0.12/kWh industrial tariffs.
How does sludge dewatering save money? Dropping cake moisture from 80% to 65% roughly halves wet tons hauled; on a 6 ton/day stream at $80/ton tipping fee, savings reach $40,000–$70,000/year.
When does an MBR lower total OPEX versus conventional activated sludge? When space is constrained, sludge disposal is expensive, or effluent quality must meet reuse or strict surface-discharge limits; membrane OPEX offsets against lower labor and hauling cost, often landing neutral to slightly favorable.