Why North Carolina Industrial Wastewater Compliance Is Different in 2026
North Carolina operates one of the most stringently enforced NPDES programs in the Southeast because it holds delegated federal authority and layers a separate basin-wide water-quality overlay on top of 15A NCAC 02B .0400 (industrial discharge limitations) and 15A NCAC 02B .0500 (discharge to surface waters). For a plant engineer, that means the permit you receive from the NCDEQ Division of Water Resources (DWR) will set numerical effluent limits that are typically tighter than the federal Effluent Limitations Guidelines (ELGs) for your subcategory, and the inspector who shows up will check both your NPDES North Carolina permit and the basin rule (e.g., the Neuse, Cape Fear, or Catawba rule) on the same visit.
The 2023 PFAS rule (15A NCAC 02B .0700) added notification levels of 20 ng/L for PFOA and PFOS and 10 ng/L for GenX (hexafluoropropylene oxide dimer acid), which is below the analytical detection capability of most legacy GAC-only systems. The 2024 nutrient strategy tightened total nitrogen to <12 mg/L for many inland dischargers, and NC is the only Southeast state that has formally adopted both PFAS notification and a downstream total nitrogen cap enforceable in the same permit cycle.
Standard NC industrial effluent targets that show up in the majority of NPDES permits are summarized below. Anything outside these ranges triggers an antidegradation review under the basin rule.
| Parameter | Typical NC Industrial Effluent Limit | NCDEQ / Federal Source |
|---|---|---|
| BOD₅ | < 30 mg/L (30-day avg) | 15A NCAC 02B .0400 |
| TSS | < 30 mg/L (30-day avg) | 15A NCAC 02B .0400 |
| O&G (oil & grease) | < 15 mg/L | 15A NCAC 02B .0400 |
| Total Nitrogen | < 12 mg/L (basin-dependent) | Neuse/Cape Fear nutrient rules (2024) |
| pH | 6.0–9.0 SU | 15A NCAC 02B .0400 |
| PFOA | 20 ng/L notification | 15A NCAC 02B .0700 (2023) |
| PFOS | 20 ng/L notification | 15A NCAC 02B .0700 (2023) |
| GenX (HFPO-DA) | 10 ng/L notification | 15A NCAC 02B .0700 (2023) |
The practical consequence is that a treatment train sized only to the federal ELG floor will fail a NCDEQ permit review. Equipment must be specified against the basin-specific limit, not the EPA minimum — a distinction the EPC consultant should document in the basis-of-design report before the 30% design review.
Industrial Flow Profile: What North Carolina Factories Actually Discharge
Textile dyeing and finishing still accounts for 18–22% of North Carolina's industrial water demand per the most recent NCDEQ basin plans, but the load profile varies sharply by subregion. Before specifying a DAF or MBR, you need to know which corridor your plant sits in and what the historical flow-and-loading envelope looks like. The table below draws on operating data from the Charlotte–Gastonia–Hickory textile belt, the Smithfield–Mount Olive pork corridor, the Catawba and Roanoke pulp basins, and the Research Triangle Park chemical and semiconductor cluster.
| Industry / Region | Typical Flow per Plant | Influent BOD (mg/L) | Influent TSS (mg/L) | Signature Contaminants |
|---|---|---|---|---|
| Textile dyeing/finishing (Charlotte, Gastonia, Hickory) | 0.5–3.0 MGD | 500–1,500 | 200–800 | Reactive dyes, high salinity (NaCl/Na₂SO₄ 2,000–8,000 mg/L), color, surfactants |
| Food processing (Smithfield, Mount Olive, Winston-Salem) | 1.0–1.5 MGD | 800–2,500 | 400–1,200 | FOG 200–600 mg/L, ammonia 20–80 mg/L, high-temperature condensate |
| Pulp & paper (Catawba, Roanoke basins) | 20–80 MGD (integrated mills) | 200–600 | 500–1,500 | AOX, color, chlorinated organics, high volume variability |
| Chemicals & pharma (Research Triangle Park) | 0.3–2.0 MGD | 300–1,200 | 100–500 | Solvents, AOX, variable pH (2–12), trace organics |
| Semiconductor fab (Triangle region) | 0.2–1.5 MGD | < 50 (organic-light) | < 30 | Fluoride 10–100 mg/L, HF, trace metals (Cu, Ni, W), ultrapure rinse recovery |
Three engineering takeaways from this profile: (1) textile and food plants need DAF as a non-negotiable front-end because FOG and color overwhelm biological units if fed raw; (2) pulp and paper mills must handle 20–80 MGD flows with high solids — DAF alone will not meet the <30 mg/L TSS limit, and a tertiary sedimentation or sand-filter step is required; (3) semiconductor fabs are low-BOD but high-purity-recovery, which usually means a side-stream RO/UPW reclaim loop rather than a large biological stage. Specifying the wrong train for the corridor is the single most common cause of permit excursions on the first compliance cycle.
The 2026 Process Train: From Influent to NCDEQ-Compliant Effluent
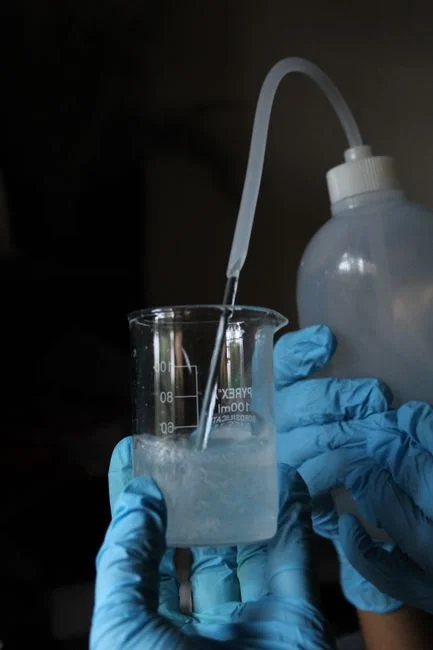
A defensible 2026 process train for a North Carolina industrial discharger runs seven stages. Each stage has a verifiable removal target and a defensible engineering basis that holds up under NCDEQ review.
Stage 1 — Coarse/fine screening with a GX rotary mechanical bar screen at 2–10 mm bar spacing removes rags, fibers, and trash that would otherwise blind downstream DAF nozzles. Continuous-duty operation is essential in textile plants where fiber carryover is constant.
Stage 2 — Equalization. A flow-and-load equalization basin with 6–24 hours of hydraulic retention time (HRT) damps pH swings, temperature pulses, and COD excursions from batch dye runs or CIP cleanouts. Semiconductor fabs typically use a smaller EQ tank (2–6 hours) because flows are steadier.
Stage 3 — Dissolved air flotation. A dissolved air flotation system (4–300 m³/h, 13 standard models) is the workhorse for FOG, color, and suspended solids removal. Field performance on food and textile influent shows 90–95% TSS removal and 95%+ FOG removal at hydraulic loading rates of 5–10 m³/m²·h. Without DAF, downstream MBR membranes foul in days rather than months.
Stage 4 — Biological treatment. An integrated MBR membrane bioreactor delivers sub-1 μm effluent, which means no secondary clarifier and roughly 60% smaller footprint than conventional activated sludge (CAS) at the same loading. A/O or A2O configurations handle total nitrogen to the <12 mg/L basin cap; SBR is an alternative for plants under 1 MGD with variable flows.
Stage 5 — Polishing. A lamella clarifier or sand filter knocks down carryover solids before disinfection; if the plant is targeting reuse, RO follows here. For a deeper dive on reuse economics, the decentralized wastewater treatment trends 2026 report covers containerized trains that NC plants are adopting for site reuse loops.
Stage 6 — Disinfection. A chlorine dioxide generator (50–20,000 g/h ClO₂) provides reliable microbial control across a wide pH range, which matters for textile effluent that swings between pH 5 and 10. ClO₂ is preferred over NaOCl when ammonia is present because it does not form chloramines, and NC textile plants have moved away from gas chlorine for safety reasons.
Stage 7 — PFAS polishing (optional but increasingly required). For sites under a PFAS notification trigger, granular activated carbon (GAC) or reverse osmosis brings PFOA/PFOS below the 20 ng/L level. The PFAS removal technology 2026 outlook guide walks through the GAC-vs-RO tradeoff for North Carolina flows specifically.
Choosing Between MBR, SBR, and Conventional Activated Sludge in North Carolina
The biological step is the single biggest CAPEX and footprint decision on the train. The right pick depends on flow regime, discharge target, and whether reuse is in scope. The table below compares the three options on the parameters that actually drive NCDEQ permit compliance.
| Parameter | MBR (Membrane Bioreactor) | SBR (Sequencing Batch Reactor) | Conventional Activated Sludge (CAS) |
|---|---|---|---|
| Effluent COD (typical) | < 50 mg/L | < 80 mg/L | < 120 mg/L |
| Effluent TSS (typical) | < 5 mg/L (sub-1 μm nominal) | < 20 mg/L | < 30 mg/L |
| Footprint vs. CAS | ~40% of CAS | ~60% of CAS | Baseline (100%) |
| Operator skill required | Moderate (membrane CIP) | Moderate (cycle tuning) | Lowest |
| Flow regime fit | Continuous, 0.1–10 MGD | Batch, 0.1–5 MGD, variable | Continuous, > 1 MGD, steady |
| Total nitrogen capability | A/O or A2O reaches < 8 mg/L | Pre-anoxic stage reaches < 10 mg/L | Requires separate anoxic zone or polishing |
| Downstream PFAS polishing | Required for < 20 ng/L | Required for < 20 ng/L | Required for < 20 ng/L |
For most textile and food plants in the 0.5–3 MGD range, MBR wins on footprint and effluent quality — the tighter TSS directly reduces the load on downstream RO if the plant is pursuing reuse. SBR is the right call for facilities with strong diurnal swings and limited operator coverage. Conventional CAS only makes economic sense at large pulp and paper mills where footprint is not the binding constraint and where the secondary clarifier effluent can be blended with mill process water. For more on the nitrogen-removal side, the total nitrogen removal technology guide compares A/O, A2O, and MLE configurations in detail. Polishing tank selection is covered in the high-efficiency sedimentation tank spec sheet, and chemical feed for nutrient or pH trim is handled by an automatic chemical dosing system.
2026 Equipment Costs and Decision Framework for North Carolina Plants
The 2026 CAPEX/OPEX picture for the core equipment is summarized below. OPEX figures include energy, consumables, and routine maintenance but exclude labor and sludge disposal — which is usually the dominant lifecycle line item and is treated separately.
| Equipment | Capacity Range | CAPEX (USD) | OPEX (USD per m³ treated) |
|---|---|---|---|
| Package DAF unit | 4–50 m³/h | 18,000–95,000 | 0.04–0.08 |
| Containerized MBR | 10–200 m³/day | 95,000–450,000 | 0.18–0.35 |
| ClO₂ generator | 50–20,000 g/h | 4,500–180,000 | 0.02–0.06 |
| Plate and frame filter press (sludge dewatering) | 5–30 m² filter area | 22,000–95,000 | 0.03–0.07 (excluding transport/disposal) |
| Industrial RO polishing | 5–100 m³/h permeate | 60,000–380,000 | 0.25–0.55 |
Sludge transport and disposal is the lifecycle line item that most often breaks the budget. A plate and frame filter press sized to 5–30 m² is the standard dewatering step for the 20–25% dry-solids cake most NC municipal biosolids haulers will accept; the industrial RO water treatment system is added when reuse is the project driver. Use the following decision framework to scope a turnkey package without over- or under-specifying:
- Flow < 50 m³/h and FOG-heavy (food, meat, dairy): DAF only, with a downstream ClO₂ polish if the receiving stream is sensitive.
- Flow 50–500 m³/h with biological load (textile, chemical, pharma): DAF + MBR + ClO₂.
- Reuse intent (semiconductor, large textile, closed-loop cooling): Add RO after MBR; expect 60–75% recovery.
- PFAS risk or 15A NCAC 02B .0700 notification: Add GAC or RO regardless of biological choice.
- Sludge-heavy (pulp & paper, large food): Plate-frame filter press is mandatory; consider a pre-thickener ahead of the press to reduce polymer consumption.
For reference designs, the DAF machine engineering guide and the US sewage treatment equipment suppliers reference (used for cross-state spec benchmarking) are useful adjacent reads. Budget numbers above reflect 2026 market conditions and should be confirmed against current vendor quotes before procurement release.
Frequently Asked Questions
What are the standard NC industrial effluent limits under 15A NCAC 02B?
The typical NCDEQ permit limits are BOD < 30 mg/L, TSS < 30 mg/L, O&G < 15 mg/L, total nitrogen < 12 mg/L in nutrient-sensitive basins, and pH 6.0–9.0, per 15A NCAC 02B .0400 and .0500.
Does my facility need to monitor for PFAS under North Carolina rules?
Yes if you are in an applicable industrial category under 15A NCAC 02B .0700 (adopted 2023). Notification levels are 20 ng/L for PFOA and PFOS and 10 ng/L for GenX, which usually requires GAC or RO polishing for compliance.
Which biological treatment is best for a 1–2 MGD North Carolina textile plant?
MBR is the most common 2026 choice because it delivers TSS < 5 mg/L directly, cuts footprint by ~60% versus CAS, and reliably hits the basin total-nitrogen cap when configured as A/O or A2O.
How much does a package DAF unit cost in 2026?
Package DAF units in the 4–50 m³/h range run $18,000–95,000 CAPEX with OPEX of $0.04–0.08 per m³ treated, excluding sludge disposal.
Is MBR or SBR better for variable-flow food processing wastewater?
SBR handles diurnal flow swings with simpler controls and lower membrane-replacement risk, while MBR delivers tighter effluent (TSS < 5 mg/L vs. < 20 mg/L) at a higher CAPEX; for PFAS-bound sites both require downstream GAC or RO regardless.