What Makes a Large-Volume Ozone Generator Different
A corona-discharge ozone generator on >90% oxygen feed is the dominant choice for flows above 100 m³/h, delivering 80–120 g O₃/kWh at 1–10% concentration, where UV photolysis plateaus below 50 m³/h and electrolytic cells stay reserved for ultrapure water loops (HydropureWater field data, 2026). Plants scaling beyond 100 m³/h also see ozone cut chlorine-resistant pathogen risk: a Midwest food plant moved off chlorine after Listeria survived contact and EPA fines passed $200,000 per year, then logged 99.9% kill rates against the same organism class after switching to ozone.
At industrial scale, the choice is not between three equal options but between one technology that scales and two that don't. Corona discharge splits O₂ across a dielectric barrier at high voltage; with PSA oxygen at 90–95% purity or LOX at 99%, nameplate output rises linearly with power draw, and a 5–7.5 kW stack covers a 200 m³/h food effluent at 3 mg O₃/L. UV photolysis at 185 nm is mechanically simple but produces only 20–40 g O₃/kWh at 0.1–0.5% concentration, capping useful flow at roughly 50 m³/h. Electrolytic cells reach 100–150 g O₃/kWh and 15–25% concentration, yet capital cost and complexity usually confine them to pharmaceutical or semiconductor rinse loops, not bulk wastewater.
| Technology | Specific Energy | O₃ Concentration | Flow Band | Typical Feed |
|---|---|---|---|---|
| Corona discharge | 80–120 g O₃/kWh | 1–10% | 100–1,000 m³/h | PSA 90–95% O₂ or LOX 99% |
| UV photolysis (185 nm) | 20–40 g O₃/kWh | 0.1–0.5% | <50 m³/h | Dry air |
| Electrolytic cell | 100–150 g O₃/kWh | 15–25% | Ultrapure water loops | DI water feed |
Field-proven delivery at large flow rates is well documented. Commercial ozone systems have handled 1,4-dioxane and textile dye effluent for more than 20 years (pinnacleozone.com), confirming that corona stacks on oxygen feed remain the default for any plant above 100 m³/h that needs both oxidation and disinfection in one train.
How the Three Generation Technologies Compare
For a 200 m³/h food plant or a 500 m³/h textile dye line, only corona discharge clears the dose, concentration, and flow thresholds at the same time. UV photolysis tops out at roughly 50 m³/h because its 20–40 g O₃/kWh output at 0.1–0.5% concentration cannot push enough mass into a larger stream without a massive reactor bank. Electrolytic cells do reach 100–150 g O₃/kWh and 15–25% concentration, but their CapEx and membrane service intervals belong in ultrapure pharmaceutical or semiconductor loops rather than in a 100–1,000 m³/h wastewater train (HydropureWater field data, 2026).
The decision is therefore not "which is best in general" but "which can move the required mass at the design flow." A 200 m³/h food plant at 3 mg O₃/L needs 600 g O₃/h; a 500 m³/h textile line at 8 mg O₃/L needs 4,000 g O₃/h. Corona covers both with a single skid, while UV would need a 10–80× larger reactor array. A short ozone generator working principle and 2026 engineering specs walkthrough also confirms that corona on oxygen feed is the only path that scales linearly with nameplate kW on industrial skids.
| Parameter | Corona Discharge | UV Photolysis | Electrolytic |
|---|---|---|---|
| Specific energy | 80–120 g O₃/kWh | 20–40 g O₃/kWh | 100–150 g O₃/kWh |
| O₃ concentration | 1–10% | 0.1–0.5% | 15–25% |
| Flow band | 100–1,000 m³/h | <50 m³/h | Ultrapure loops |
| Oxygen feed | PSA 90–95% or LOX 99% | Dry air | None (water-split) |
| CapEx profile | $$ (scales with kW) | $ (limited scale) | $$$ (high unit cost) |
| Best fit | Industrial wastewater | Low-flow polish | Pharma, semiconductor |
Self-selection for the buyer is straightforward: above 100 m³/h, specify corona; below 50 m³/h with a clean matrix, UV can still cover low-dose polish; ultrapure water only, look at electrolytic. For most industrial wastewater bids, the comparison collapses to a corona-versus-everything-else question.
Sizing a Generator From Peak-Hour Dose: Worked Example
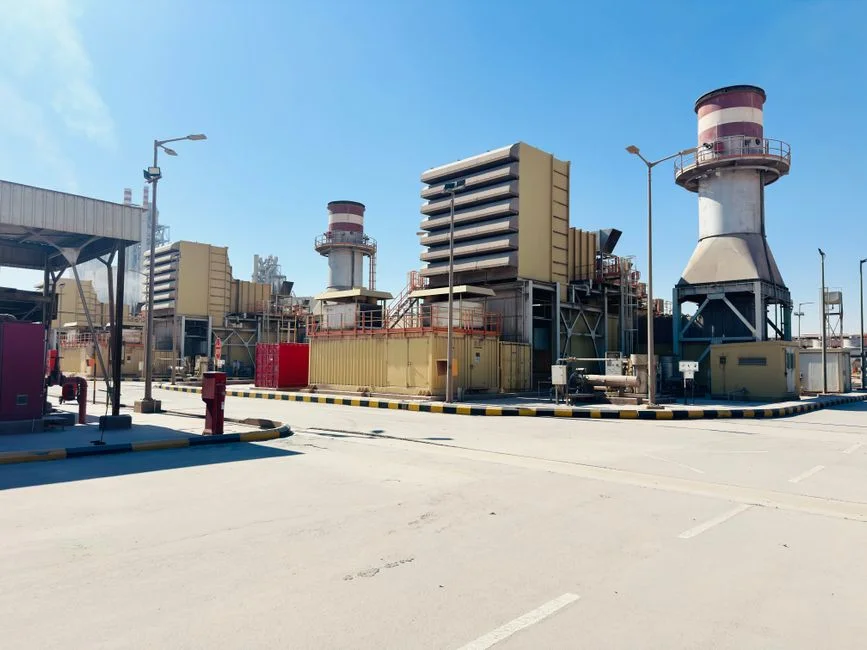
The single most common retrofit failure on ozone bids is sizing the generator from average flow instead of measured peak-hour dose (HydropureWater field data, 2026). The five steps below turn a 200 m³/h food plant at 3 mg O₃/L and 6-minute CT into a concrete generator, oxygen skid, and chamber volume that can go straight onto a datasheet.
Step 1 — Set dose and CT for the target pathogen. Food effluent at 200 m³/h is a Listeria/E. coli target, so start at 3 mg O₃/L and 6 minutes. That sits inside the standard envelope of 1–5 mg O₃/L and 4–10 minutes, with the upper end held in reserve for peak COD events. At 3 mg·min/L multiplied by the 0.25-log credit at 15°C per 40 CFR 141.720, you also cover the permit's Cryptosporidium ask if it shows up on the discharge.
Step 2 — Calculate mass of ozone. 200 m³/h × 3 g O₃/m³ = 600 g O₃/h as the base load. Add a 1.25–1.5× safety factor for peak hourly spikes if the upstream equalization basin is small, which puts the generator nameplate at 750–900 g O₃/h. That buffer is what keeps a Listeria excursion from forcing you into an unplanned CapEx review six months after start-up.
Step 3 — Translate to kW and oxygen. At 80–120 g O₃/kWh, the 600 g O₃/h case needs 5.0–7.5 kW on the corona stack. PSA oxygen at 90–95% is the standard feed for this size; LOX at 99% is worth the premium only when peak demand spikes above 1,500 g O₃/h or the chamber needs 8–10% O₃ to drive transfer. An ozone generator and tank sterilization system packaged skid covers the generator, oxygen skid, and destruct in one loop for this size class.
Step 4 — Set contact-chamber volume. V = Q × t = 200 m³/h × 10 min ÷ 60 = 33 m³. Build it as a plug-flow basin with at least 3:1 length-to-width to limit short-circuiting, and confirm the worst-case CT at the coldest operating temperature the plant expects. Designers often shorten to 6 min when the matrix is already low in scavengers, but the 10-min number is the safe envelope for a datasheet.
Step 5 — Lock pre-treatment targets. TSS below 50 mg/L and oil/grease below 10 mg/L are non-negotiable; otherwise diffuser fouling and ozone demand both explode. A dissolved air flotation (DAF) system ahead of the chamber handles both, and a high-efficiency sedimentation tank can be staged in series for facilities with high grit or settleable solids. If you already have a lamella upstream, follow the lamella clarifier troubleshooting notes to keep floc out of the diffuser plates.
Dose and Contact Time by Contaminant
Disinfection and oxidation sit on different dose bands, and confusing the two is a common reason jar-test scope gets cut. Disinfection of industrial wastewater typically starts at 1–5 mg O₃/L with 4–10 minutes of contact, while COD, color, and refractory organics often need 5–30 mg/L with longer retention (HydropureWater field data, 2026). Scavengers in the real matrix — sulfide, nitrite, iron, manganese — push the setpoint above clean-water CT tables, which is why jar or pilot testing still decides the final dose.
Phenol reacts with ozone at about 1.3×10³ M⁻¹s⁻¹ (EPA 2023), so short contact times work once the immediate ozone demand from bulk COD is satisfied. On textile and refinery matrices, ozone has a long commercial track record: 20+ years of systems have decolorized textile dye effluent and broken down 1,4-dioxane into non-toxic byproducts (pinnacleozone.com), which is why these two contaminant classes are the standard proof points in vendor references.
| Target | Dose (mg O₃/L) | Contact Time | Notes |
|---|---|---|---|
| E. coli disinfection | 1–2 | 4 min | Standard food-plant envelope |
| Virus inactivation | 2–5 | 10 min | Permit-driven; use upper end in cold water |
| Cryptosporidium (0.5-log) | Per CT | 6.2 mg·min/L at 15°C | Per 40 CFR 141.720 |
| Color / textile dye | 5–15 | 10–20 min | 20+ year commercial track record |
| 1,4-dioxane | 5–20 | 15–30 min | Refractory; AOP often combined |
| COD reduction | 5–30 | 20–40 min | Demand first, then refractory fraction |
If the jar test holds at the low end of these ranges, the contact chamber can shrink and the oxygen skid follows. If it climbs into the 15–30 mg/L band, plan a two-stage chamber or an AOP polish downstream rather than oversizing the generator on its own.
Residual, Workplace Air, and 2026 Regulatory Limits
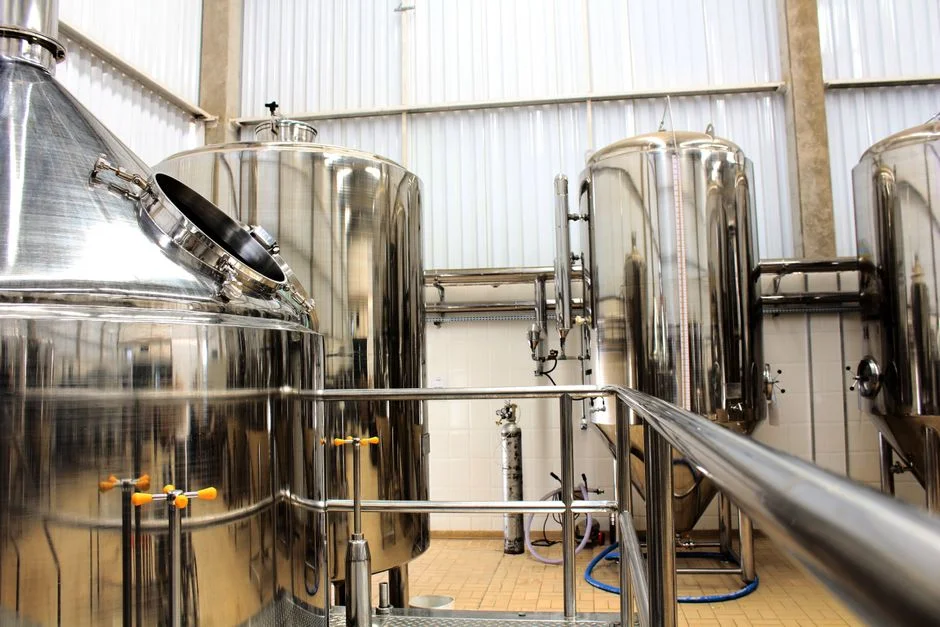
The compliance envelope for an ozone bid in 2026 is set by three numbers: treated-water residual, workplace air, and EU DBP caps for any plant discharging to or near a drinking-water source. Treated-water residual is commonly held below 0.1 mg/L before the destruct unit, and many plant specs still cite 0.05 mg/L under the old Directive 98/83/EC wording (HydropureWater field data, 2026).
Workplace air is non-negotiable. OSHA's permissible exposure limit is 0.1 ppm (0.2 mg/m³) as an 8-hour TWA, with the standard updated on 22 January 2024. NIOSH lists a 0.1 ppm ceiling (not an 8-hour average) and an IDLH of 5 ppm — room alarms should trip on the ceiling, not only on the shift average. Ambient monitors in the generator room and at the contact-chamber headspace are the cheapest insurance on the bid.
For sites discharging where EU drinking-water rules apply, Directive (EU) 2020/2184 recast and repealed Directive 98/83/EC as of 12 January 2023, with national transposition to 12 January 2026. The new chemical list has no residual ozone value but caps bromate at 10 µg/L, total trihalomethanes at 100 µg/L, and haloacetic acids (HAA5) at 60 µg/L; chlorate and chlorite are each capped at 0.25 mg/L. These caps apply to water intended for human consumption, not automatically to an industrial outfall, but any plant with a blended outfall or a downstream abstraction needs to plan for them.
| Limit | Value | Source |
|---|---|---|
| Treated-water residual (typical) | <0.1 mg/L | Plant specs, WHO guidance |
| Treated-water residual (legacy spec) | 0.05 mg/L | Directive 98/83/EC (repealed) |
| Workplace air 8-hr TWA | 0.1 ppm (0.2 mg/m³) | OSHA, updated 2024-01-22 |
| Workplace air ceiling / IDLH | 0.1 ppm / 5 ppm | NIOSH |
| Bromate (EU drinking water) | 10 µg/L | Directive (EU) 2020/2184 |
| Total THMs (EU drinking water) | 100 µg/L | Directive (EU) 2020/2184 |
| HAA5 (EU drinking water) | 60 µg/L | Directive (EU) 2020/2184 |
| Chlorate / chlorite (EU) | 0.25 mg/L each | Directive (EU) 2020/2184 |
Residual is destroyed with a UV sterilizer for residual ozone destruction pass or an activated-carbon contactor before the outfall; either cuts the O₃ below detection and protects downstream aquatic life.
CapEx and OPEX Compared to Chlorine and UV
Ozone carries a higher CapEx than chlorine or UV, but the OPEX gap closes once DBP sampling, bulk chemical logistics, and process-safety burden are priced in. Full ozone trains typically run $50,000–$500,000 installed, or about $500–$1,000 per m³/h of capacity. Chlorine dosing packages land at $20,000–$100,000 ($200–$500 per m³/h), and UV reactors span $30,000–$200,000 ($300–$1,000 per m³/h), driven by reactor volume and lamp type (HydropureWater field data, 2026).
On OPEX, ozone is electricity plus oxygen at about $0.05–$0.20 per m³, chlorine is chemical plus residuals management at $0.10–$0.30 per m³, and UV is power plus lamp replacement at $0.02–$0.10 per m³. Ozone generates on site, so there is no chemical transport, no bulk storage, and no decomposition back to anything other than oxygen once residual is controlled. Chlorine pays less up front but carries DBP sampling, OSHA 1910.119 process-safety management, and ongoing handling risk — the same Midwest food plant that triggered the case study above also moved to escape that regulatory load, not just the THM/HAA numbers.
| Metric | Ozone | Chlorine | UV |
|---|---|---|---|
| CapEx ($/m³/h) | $500–$1,000 | $200–$500 | $300–$1,000 |
| Full train CapEx | $50,000–$500,000 | $20,000–$100,000 | $30,000–$200,000 |
| OPEX ($/m³) | $0.05–$0.20 | $0.10–$0.30 | $0.02–$0.10 |
| DBP formation | None (bromate controlled) | THMs, HAAs | None |
| Chemical handling | None (on-site generation) | Bulk storage, OSHA 1910.119 | Lamp replacement only |
| Pathogen range | Very high, incl. chlorine-resistant | High, gaps on some organisms | Good, dose-credit limited |
When the procurement scoring weights DBP exposure, pathogen range, and chemical-handling risk equally with first cost, ozone usually wins for any flow above 100 m³/h treating a refractory or chlorine-resistant matrix.
7-Step Selection Checklist Before You Freeze CapEx
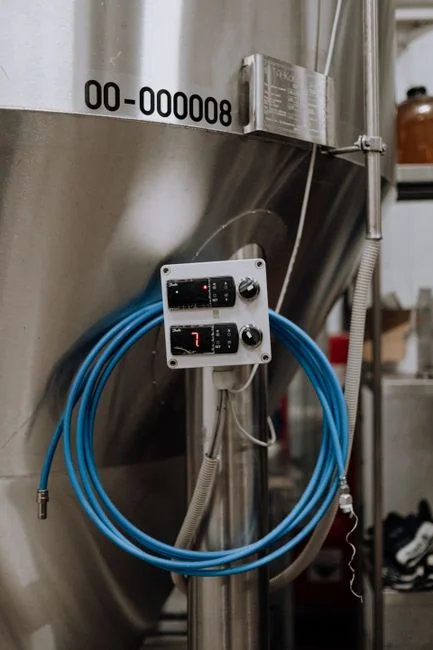
Run this list before the bid goes out. Each item maps to a datasheet line so procurement can score the proposal against a fixed rubric.
- Lock peak-hour flow, peak COD, and target pathogen log. Jar-test scope and generator nameplate both live or die on this number. A 1.25–1.5× safety factor over peak is standard.
- Confirm pre-treatment to TSS <50 mg/L and oil/grease <10 mg/L using a dissolved air flotation (DAF) system or a lamella clarifier. Diffusers cannot survive in a fouled chamber, and demand burns oxygen you didn't budget for.
- Choose corona on PSA O₂ (90–95%) or LOX (99%) based on the peak demand profile. PSA suits steady duty below about 1,500 g O₃/h; LOX earns its premium at higher peaks or when 8–10% O₃ concentration headroom is needed.
- Size the generator from measured dose demand, not average flow. Undersizing against peak COD is the retrofit failure mode we see most often (HydropureWater field data, 2026). A packaged ozone generator and tank sterilization system skid is the usual starting point for reuse or holding-tank duty.
- Pick injection: venturi at 95–98% transfer or fine-pore diffuser at 80–90%. Venturi is preferred on most industrial skids; diffusers are simpler and cheaper on low-fouling matrices. A throat ratio near 1:4 helps sustain vacuum.
- Set contact chamber 4–10 minutes, plug-flow layout with at least 3:1 length-to-width. Confirm CT at the coldest operating temperature the plant sees, not the annual average. Reference 40 CFR 141.720 for the Cryptosporidium equation if the permit cites it.
- Add residual and ambient monitoring, plus carbon or UV destruct, before the outfall. A PLC-controlled chemical dosing system handles pH and flocculation upstream; UV or carbon handles residual downstream. Both loops are non-negotiable for 2026 acceptance testing.
Frequently Asked Questions
What size ozone generator do I need for 200 m³/h at 3 mg O₃/L?
At 200 m³/h and 3 mg O₃/L, the base load is 600 g O₃/h, which translates to 5.0–7.5 kW on a corona stack running 80–120 g O₃/kWh (HydropureWater field data, 2026). Add a 1.25–1.5× safety factor for peak hourly spikes, and the oxygen skid sizes to PSA at 90–95% purity for this class.
How long should an ozone contact chamber be for industrial wastewater?
Industrial contact chambers typically hold 4–10 minutes of plug-flow retention, with the volume set by V = Q × t. For 200 m³/h at 10 minutes, the chamber is 33 m³; at 6 minutes, it drops to 20 m³. Final sizing must satisfy CT at the coldest operating temperature the permit covers, not the annual average (HydropureWater field data, 2026).
What residual ozone limit applies in 2026?
Treated-water residual is commonly held below 0.1 mg/L before the destruct unit, and some plant specs still cite 0.05 mg/L under the old Directive 98/83/EC. The new Directive (EU) 2020/2184, with national transposition to 12 January 2026, has no residual ozone value but caps bromate at 10 µg/L, total THMs at 100 µg/L, and HAA5 at 60 µg/L where drinking-water rules apply. Workplace air stays at 0.1 ppm (0.2 mg/m³) 8-hour TWA per OSHA, updated 22 January 2024.
Does ozone form DBPs the way chlorine does?
When residual is controlled, ozone does not form THMs or HAAs because it decomposes back to oxygen rather than reacting with natural organic matter the way chlorine does. The main inorganic DBP to watch is bromate, capped at 10 µg/L under Directive (EU) 2020/2184 in drinking-water contexts. Destroying residual with a UV sterilizer for residual ozone destruction or activated carbon keeps both the residual and the bromate risk under control.
How is ozone CT calculated for Cryptosporidium credit?
Per 40 CFR 141.720, Cryptosporidium log credit equals 0.0397 × 1.09757^(water temperature in °C) × CT. At 15°C that gives roughly 1.6 mg·min/L for 0.25-log credit, 3.1 mg·min/L for 0.5-log, and 6.2 mg·min/L for 1.0-log. CT is calculated at least once each day using C and T measured at peak hourly flow (HydropureWater field data, 2026).