Home>Blog>Equipment & Technology Guide>Ozone Generator Water Treatment Working Principle: 2026 Engineering Specs, Process Flow & Zero-Risk Selection Guide
Ozone Generator Water Treatment Working Principle: 2026 Engineering Specs, Process Flow & Zero-Risk Selection Guide
Equipment & Technology Guide
Zhongsheng Engineering Team
Why Industrial Plants Are Switching from Chlorine to Ozone for Wastewater Disinfection
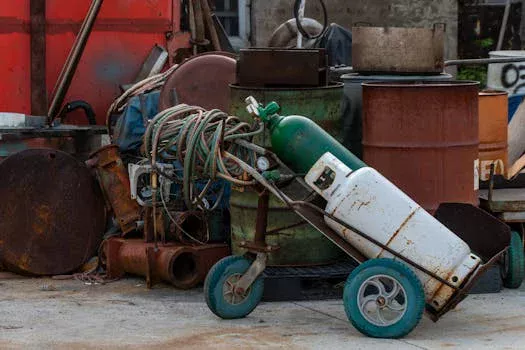
A food processing plant in the Midwest faced a critical challenge: chlorine-resistant strains of Listeria persisted in their treated effluent, leading to repeated violations of EPA discharge permits and hefty fines totaling over $200,000 annually. Their reliance on chlorine, a common disinfectant, proved insufficient against increasingly resilient pathogens and generated undesirable disinfection byproducts (DBPs) like trihalomethanes (THMs) and haloacetic acids (HAAs). the inherent risks associated with storing and handling bulk chlorine gas, governed by OSHA standard 1910.119, added significant operational complexity and safety concerns. In contrast, ozone (O₃) offers a powerful, chemical-free alternative, capable of achieving 99.9% kill rates against even chlorine-resistant pathogens. Its on-site generation eliminates the need for chemical transport and storage, while its rapid decomposition back to oxygen ensures no harmful residues remain in the discharged water, significantly mitigating DBP formation and improving overall compliance and safety.
Ozone Generation Methods: Corona Discharge vs. UV vs. Electrolytic for Industrial Wastewater
The selection of an appropriate ozone generation method is paramount for achieving optimal performance and cost-effectiveness in industrial wastewater treatment. Each technology offers distinct advantages and is suited for different application scales and water quality requirements.
Corona discharge generators are the workhorse of industrial ozone applications, leveraging a high-voltage electrical field applied across a dielectric barrier to split oxygen molecules (O₂). This process, typically operating with an oxygen feed gas purity of >90%, achieves efficiencies ranging from 80–120 grams of ozone per kilowatt-hour (g O₃/kWh) and can produce ozone concentrations of 1–10%. Their robust design and scalability make them ideal for high-volume wastewater treatment, handling flow rates from 100 to 1,000 cubic meters per hour (m³/h).
UV light ozone generation utilizes specific wavelengths of ultraviolet radiation (typically 185 nm) to photochemically dissociate oxygen molecules. While simpler in design, these systems are generally less efficient, producing 20–40 g O₃/kWh with ozone concentrations of 0.1–0.5%. They are best suited for low-flow applications, typically below 50 m³/h, where lower ozone output is sufficient.
Electrolytic ozone generation involves the electrochemical splitting of water molecules at electrodes to produce ozone. This method boasts high efficiencies of 100–150 g O₃/kWh and can achieve ozone concentrations of 15–25%. However, its primary application lies in producing ultrapure water for sensitive industries like pharmaceuticals and semiconductors, where its higher cost and complexity limit its use in broader industrial wastewater scenarios.
For most industrial wastewater treatment applications, corona discharge remains the dominant technology due to its superior scalability, efficiency, and overall cost-effectiveness compared to UV and electrolytic methods.
Method
Efficiency (g/kWh)
Ozone Conc. (%)
CapEx
OPEX
Best Use Case
Corona Discharge
80–120
1–10
Medium to High
Medium
High-volume industrial wastewater (>100 m³/h)
UV Light
20–40
0.1–0.5
Low to Medium
Low
Low-flow applications (<50 m³/h)
Electrolytic
100–150
15–25
High
High
Ultrapure water (pharmaceutical, semiconductor)
Step-by-Step Process Flow: How Ozone Integrates into Industrial Wastewater Treatment Trains
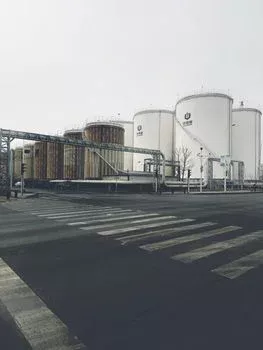
ozone generator water treatment working principle - Step-by-Step Process Flow: How Ozone Integrates into Industrial Wastewater Treatment Trains
Integrating an ozone system into an existing industrial wastewater treatment train requires careful planning and consideration of each process stage to maximize efficiency and ensure effective contaminant removal. A typical integration follows these six key steps:
Step 1: Pre-treatment is crucial to protect the ozone generation and injection equipment. Influent quality should be optimized to prevent fouling of ozone diffusers and minimize ozone demand. Ideal conditions include Total Suspended Solids (TSS) below 50 mg/L and oil/grease below 10 mg/L. Processes like screening, grit removal, and equalization tanks, potentially enhanced by a PLC-controlled chemical dosing system for pH adjustment or flocculation, are vital. Further pre-treatment such as Dissolved Air Flotation (DAF) can remove suspended solids and oils, ensuring optimal ozone contact. For specific industrial effluents, advanced pre-treatment like those described for PCB high-salinity wastewater treatment may be necessary.
Step 2: Ozone Generation involves selecting the appropriate generator size and oxygen source. For a typical industrial flow rate of 100 m³/h requiring an ozone dosage of 1–5 mg O₃/L, the generator capacity would range from 100 to 500 grams of ozone per hour (g O₃/h). An oxygen source is critical; Pressure Swing Adsorption (PSA) units provide oxygen purity of 90–95% and are generally preferred for corona discharge generators, while Liquid Oxygen (LOX) offers higher purity (99%) but at a greater cost.
Step 3: Ozone Injection is the process of transferring generated ozone gas into the wastewater. The efficiency of this transfer directly impacts overall system performance. Bubble diffusers, commonly made from fine-pore ceramic or sintered materials, offer 80–90% transfer efficiency. Venturi injectors, which create a vacuum to draw ozone into the water stream, achieve higher efficiencies of 95–98% and are often preferred for their simplicity and effectiveness. Static mixers can be incorporated downstream of injection points to enhance gas-liquid contact. A typical venturi injector features a design with a throat ratio of approximately 1:4 to optimize the vacuum effect.
Step 4: Contact Time is the duration ozone remains in contact with the water to effectively oxidize contaminants. This is a critical parameter for achieving required disinfection levels and is often dictated by regulatory CT (Concentration x Time) values. For instance, the EPA specifies CT requirements for inactivating pathogens like Cryptosporidium (e.g., 1.3 mg·min/L). Contact chambers are designed to ensure adequate retention time, typically between 4–10 minutes, and can be configured as plug-flow reactors to minimize short-circuiting or Continuous Stirred Tank Reactors (CSTRs), depending on the application and desired mixing characteristics.
Step 5: Post-treatment addresses the removal of any residual ozone and byproducts. Residual ozone, which can be corrosive and harmful, must be reduced to acceptable levels. Activated carbon filters are commonly used for ozone destruction, converting residual O₃ back to O₂. Alternatively, a short contact time with UV light can also be employed for this purpose. The World Health Organization (WHO) recommends residual ozone limits of less than 0.1 mg/L in treated water.
Step 6: Monitoring is essential for ensuring consistent performance and compliance. Key parameters to continuously monitor include ozone dosage (mg/L), residual ozone concentration (mg/L), Oxidation-Reduction Potential (ORP) of the treated water (mV), and the wastewater flow rate (m³/h). Real-time data allows for automatic adjustments to ozone generation and injection rates, optimizing treatment and preventing over- or under-dosing.
Ozone Dosage and Contact Time: Engineering Parameters for Compliance and Efficiency
Precisely calculating ozone dosage and contact time is fundamental for achieving target contaminant removal efficiencies and meeting stringent regulatory compliance standards. The required ozone dose varies significantly based on the type and concentration of contaminants present in the wastewater.
For effective disinfection and oxidation, specific dosage rates are recommended:
Contaminant
Ozone Dosage (mg/L)
Contact Time (min)
Removal Efficiency
Source
E. coli
1–2
4
99.99%
EPA 2024
Viruses (e.g., Enteroviruses)
2–5
10
99.9%
EPA 2024
Phenols
5–15
5–10
>95%
EPA 2023
COD (Chemical Oxygen Demand)
10–30
15–30
20–50% reduction
Zhongsheng field data, 2025
Color (Dyes)
5–20
10–20
>90% reduction
Zhongsheng field data, 2025
Taste and Odor Compounds
0.5–2
2–5
Significant Reduction
EPA 2024
The CT values, representing the product of disinfectant concentration and contact time, are critical for disinfection efficacy, particularly for waterborne pathogens. These values are temperature-dependent and vary by microorganism:
Microorganism
CT (mg·min/L)
Temperature (°C)
Source
Giardia lamblia cysts
0.48
15
EPA
Cryptosporidium parvum oocysts
1.3
15
EPA
Rotavirus
0.2
15
EPA
Understanding oxidation kinetics, quantified by second-order rate constants, helps predict reaction rates. For example, phenol reacts with ozone at a rate constant of approximately 1.3×10³ M⁻¹s⁻¹ (EPA 2023), indicating a relatively fast reaction that influences the required dosage and contact time.
Regulatory bodies set strict limits on residual ozone in treated water and ambient air. The WHO recommends residual ozone levels below 0.1 mg/L. The EU Drinking Water Directive 98/83/EC sets a limit of 0.05 mg/L. For workplace safety, OSHA has established a Permissible Exposure Limit (PEL) for ozone in ambient air of 0.1 ppm (parts per million) as an 8-hour Time-Weighted Average (TWA).
Ozone vs. Chlorine vs. UV: Cost, Efficiency, and Compliance Comparison for Industrial Wastewater
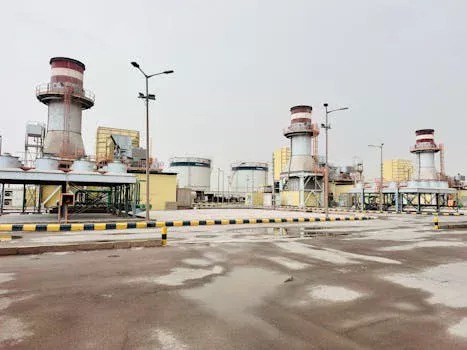
ozone generator water treatment working principle - Ozone vs. Chlorine vs. UV: Cost, Efficiency, and Compliance Comparison for Industrial Wastewater
When evaluating disinfection technologies for industrial wastewater, a comprehensive comparison of ozone, chlorine, and UV is essential to balance cost, efficiency, and regulatory compliance. Each method presents a unique profile of capital expenditure (CapEx), operational expenditure (OPEX), performance, and safety considerations.
Method
CapEx ($/m³/h)
OPEX ($/m³)
Pathogen Kill Rate
DBP Formation
Chemical Handling
Best Use Case
Ozone
$500–$1,000
$0.05–$0.20
99.99%
None
On-site generation, no chemical transport
High-volume wastewater, demanding disinfection
Chlorine
$200–$500
$0.10–$0.30
99.9% (variable)
Significant (THMs, HAAs)
Requires bulk storage, transport, and safety protocols
Cost-sensitive applications, where DBPs are manageable
UV
$300–$1,000
$0.02–$0.10
99.9% (flow dependent)
None
No chemical exposure, but lamp maintenance required
Low to moderate flow, where pre-treatment is excellent
Capital expenditure for an ozone system, including the generator, oxygen supply, and injection/contact system, typically ranges from $50,000 to $500,000 depending on the flow rate and required ozone output. Chlorine dosing systems are generally less expensive, ranging from $20,000 to $100,000. UV systems can have a broad CapEx range of $30,000 to $200,000, influenced by reactor size and lamp technology.
Operational expenditures for ozone primarily consist of electricity for generation and oxygen costs, estimated at $0.05–$0.20 per cubic meter of treated water. Chlorine OPEX includes chemical purchase costs and disposal, ranging from $0.10–$0.30/m³. UV OPEX is mainly driven by electricity consumption and periodic lamp replacement, typically $0.02–$0.10/m³.
Compliance trade-offs are significant. Ozone offers superior disinfection without DBP formation, but requires careful management of residual ozone levels and workplace air quality (OSHA PEL 0.1 ppm). Chlorine is a proven disinfectant but its DBP formation can lead to regulatory issues, and its handling poses inherent safety risks. UV disinfection produces no residuals or DBPs but its efficacy is highly dependent on water clarity, and lamp fouling can reduce performance. For comparison, chlorine dioxide generators offer an alternative with different DBP profiles.
How to Select the Right Ozone Generator for Your Industrial Wastewater Application
Choosing the optimal ozone generator involves a systematic evaluation of your specific application requirements, from flow rate and influent characteristics to regulatory mandates. A structured decision-making process ensures that the selected system delivers reliable performance and cost-effectiveness.
Step 1: Determine Flow Rate. The maximum and average wastewater flow rate, measured in cubic meters per hour (m³/h), is the primary determinant of system size. For example, treating 100 m³/h with a target ozone dosage of 1–5 mg O₃/L requires an ozone generation capacity of 100–500 g O₃/h.
Step 2: Analyze Influent Quality. Identify the key contaminants present (e.g., COD, BOD, pathogens, color, specific organic compounds, dissolved metals). This analysis dictates the required ozone dosage and potential pre-treatment needs. For instance, high levels of organic matter will increase ozone demand, requiring a larger generator or longer contact time.
Step 3: Choose Generation Method. Based on flow rate and contaminant type, select the most appropriate generation technology. A decision tree can guide this choice:
Flow Rate > 100 m³/h AND Pathogen Control Required: Corona Discharge
Flow Rate < 50 m³/h AND Simplicity Preferred: UV Generation
Ultrapure Water Applications: Electrolytic Generation
Step 4: Select Oxygen Source. For corona discharge generators, compare the cost and purity of PSA oxygen (90–95% O₂, ~$0.03–$0.05/m³) versus LOX (99% O₂, ~$0.10–$0.20/m³). PSA is generally more economical for continuous industrial use.
Step 5: Plan for Redundancy. For critical applications such as hospital effluent requiring a compact ozone disinfection system, consider N+1 or 2N redundancy for ozone generators and oxygen supply to ensure uninterrupted operation.
Step 6: Compliance Checklist. Verify that the chosen system can meet all local, regional, and national discharge standards. This includes meeting EPA CT values for disinfection, WHO residual ozone limits (<0.1 mg/L), and any specific industry or local regulations (e.g., China GB 18918-2002). Ensuring proper post-treatment for residual ozone destruction is vital. Effective pre-treatment, such as utilizing DAF machines, is also key to the longevity and efficiency of the ozone system. Post-treatment considerations, like those for reverse osmosis systems, may also be relevant depending on the overall treatment train.
Frequently Asked Questions
ozone generator water treatment working principle - Frequently Asked QuestionsWhat are the main differences between ozone and chlorine for wastewater disinfection?
Ozone provides superior disinfection, inactivating a wider range of pathogens, including chlorine-resistant strains, without forming harmful DBPs. Chlorine is less expensive initially but forms DBPs and requires hazardous chemical handling.
Feature
Ozone
Chlorine
Disinfection Efficacy
Very High (incl. chlorine-resistant)
High (but struggles with some pathogens)
DBP Formation
None
Significant
Chemical Handling
On-site generation, minimal hazard
Bulk storage, transport risks
Residual
Short-lived, requires monitoring
Long-lasting, potential for residuals
How is ozone generated for water treatment?
Ozone (O₃) is typically generated by passing oxygen (O₂) through a high-voltage electrical discharge (corona discharge) or specific wavelengths of UV light, splitting O₂ molecules into individual atoms that then recombine to form O₃.
What is the typical ozone dosage for industrial wastewater?
Industrial wastewater typically requires ozone dosages ranging from 1–5 mg/L for disinfection and higher doses (5–30 mg/L) for oxidizing organic contaminants like COD and phenols.
How long is the required contact time for ozone disinfection?
Contact time for ozone disinfection in industrial wastewater typically ranges from 4–10 minutes, depending on the target microorganisms and required CT values, as specified by regulatory bodies like the EPA.
What are the safety concerns with ozone in water treatment?
The primary safety concern is inhalation of ozone gas, which is an irritant. Workplace air must be monitored to ensure levels remain below OSHA's PEL of 0.1 ppm (8-hour TWA), and residual ozone in treated water should be kept below 0.1 mg/L per WHO guidelines.
Zhongsheng Engineering Team
Our team of wastewater treatment engineers has over 15 years of experience designing and manufacturing DAF systems, MBR bioreactors, and packaged treatment plants for clients in 30+ countries worldwide.