Why Animal Feed Wastewater Sludge Is a Special Case
Animal feed wastewater sludge treatment combines a DAF-MBR or DAF-Ultrafiltration train to remove FOG, suspended solids, and high BOD/COD (often 1,500–10,000 mg/L) with downstream dewatering, then routes the cake to either regulated disposal (40 CFR Part 503 land application, landfill, or incineration in the U.S.) or to single-cell protein recovery. A 2025 NTU study reports 91.4% organic-carbon recovery and 63% conversion to feed-grade single-cell protein, more than double the ~50% recovery of conventional anaerobic digestion.
Feed mills, pet-food plants, aquaculture-feed lines, and rendering facilities do not behave like municipal sewage works. Their influent swings between dilute wash-water from pellet coolers and concentrate streams from cooking, blood hydrolysis, or feather-rendering cookers. A single shift can move BOD by an order of magnitude depending on which process is dumping to the floor drain. That is why off-the-shelf municipal designs underperform in this sector — the biological kinetics, the FOG loading, and the cake volumes are all different.
Globally, UN-Habitat puts sewage sludge output at over 100 million tonnes per year (cited in S3, S5), and animal-feed and rendering plants are a significant industrial contributor. The chemistry is the same one that makes activated sludge hard to settle: high protein, B-vitamins, amino acids, and lipid content (per the 1989 review of activated sludges as animal feed, S2). That nutrient density is also what makes the waste attractive as a future feed ingredient — once regulators permit it.
Two regulatory frameworks have to be on the table before any reuse scheme is sketched. In the U.S., 40 CFR Part 503 governs how sewage sludge and biosolids are land-applied, surface-disposed, or incinerated (per EPA, S4). In the EU, the TSE feed-ban (EC 999/2001) prohibits most processed animal proteins from re-entering the feed chain, which effectively rules out many sludge-to-feed pathways regardless of process performance.
Influent Characteristics You Must Design Around
Feed-mill raw influent typically runs BOD 1,500–10,000 mg/L, COD 500–4,000 mg/L with a BOD/COD ratio of 0.3–0.5, TSS 500–3,000 mg/L, FOG 200–2,000 mg/L, TKN 100–500 mg/L, and pH 5–9. Rendering plants push higher — raw blood and feather hydrolysate streams can hit BOD ~25,000 mg/L and are usually segregated at the headworks for separate treatment rather than blended into the main equalization tank.
One parameter that catches out designers is the C:N:P ratio. Feed-mill wastewater is carbon-rich and phosphorus-poor, so a biological stage will need phosphorus dosing (typically phosphoric acid or monoammonium phosphate) to keep removal kinetics on track. Ignoring this turns the aeration tank into a foaming, poorly flocculating mess.
| Parameter | Low | Typical | High (rendering) | Design implication |
|---|---|---|---|---|
| BOD (mg/L) | 1,500 | 5,000 | 25,000 | Drives anaerobic vs. aerobic selection; UASB viable above 2,000 mg/L |
| COD (mg/L) | 500 | 2,500 | 15,000 | Sets aeration demand and MBR organic loading rate |
| TSS (mg/L) | 500 | 1,500 | 3,000 | Defines DAF sizing and polymer demand |
| FOG (mg/L) | 200 | 800 | 2,000 | Must be removed pre-membrane to prevent fouling |
| TKN (mg/L) | 100 | 300 | 500 | Sets nitrification/denitrification volume |
| pH | 5 | 7 | 9 | Equalization needed; effects DAF chemistry |
| C:N:P ratio | 100:10:0.5 | 100:6:1 | 100:5:0.3 | Phosphorus dosing required for biological removal |
These numbers should be confirmed against at least 12 months of the plant's own composite sampling before any equipment order is cut — the swings are large enough that a single sampling campaign is misleading.
The Core Treatment Train: Screening, DAF, Biological, Membrane
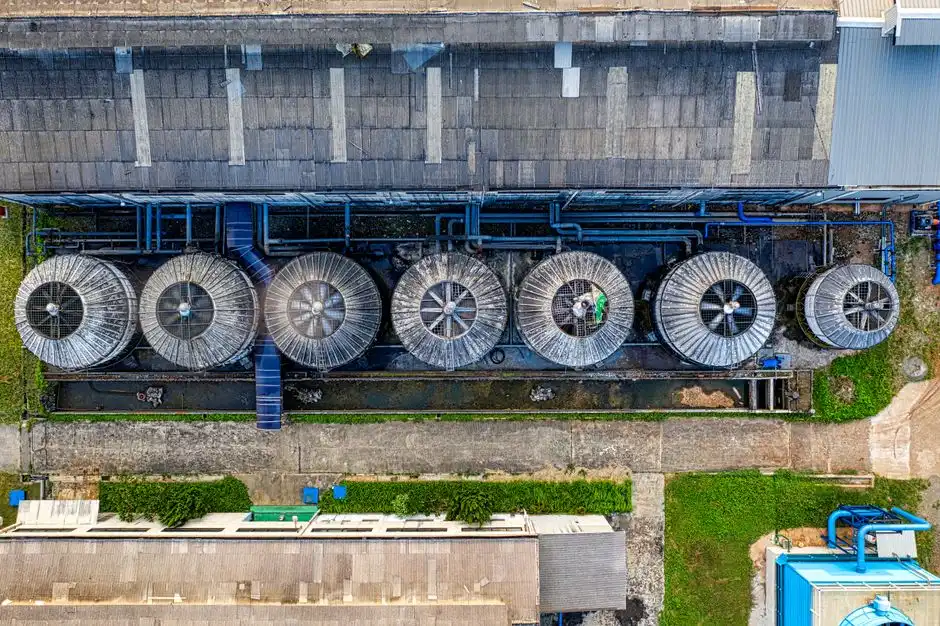
A deployable 2026 train for an animal feed mill runs in four stages: headworks screening, dissolved air flotation for FOG and TSS, a biological stage sized for high BOD, and a membrane polish. A representative end-to-end layout looks like bar screen → grit removal → equalization → DAF system → UASB or CAS → HydropureWater MBR → 0.03 µm PVDF ultrafiltration system → reuse or discharge.
Stage 1 headworks uses a rotary mechanical bar screen at 3–6 mm aperture to strip rags, feathers, and grain fines before they reach the pumps and membranes. Stage 2 DAF is the workhorse for FOG: a properly tuned DAF removes 90–95% of FOG and 70–90% of TSS at flow rates of 4–300 m³/h, with an air-to-solids ratio of 0.02–0.05 for feed-mill grease (HydropureWater field data, 2026). Without that DAF step, FOG coats every downstream membrane and slashes MBR flux by half within days.
Stage 3 biological treatment should be selected by influent strength. For BOD above 2,000 mg/L, a UASB or CSTR anaerobic reactor pays back through biogas while dropping 60–80% of the organic load; an aerobic MBR vs CAS trade-off guide then polishes the effluent to sub-1 µm at roughly 60% of the footprint of conventional activated sludge. Stage 4 polishing with a 0.03 µm PVDF ultrafiltration system delivers reusable water for washdown or feeds a reverse-osmosis skid if the plant needs boiler-grade quality.
The sludge side-stream cannot be an afterthought. Waste activated sludge is thickened by DAF or gravity belt, then dewatered to 18–25% dry solids on a plate-and-frame filter press before disposal or further processing. The full train, including the dewatering step, is what determines whether a project hits its OPEX targets.
| Stage | Unit operation | Key spec | Typical removal / output |
|---|---|---|---|
| 1 Headworks | Rotary bar screen | 3–6 mm aperture | Protects pumps and membranes |
| 2 FOG / TSS | DAF | A/S 0.02–0.05, 4–300 m³/h | 90–95% FOG, 70–90% TSS |
| 3a High-strength BOD | UASB / CSTR | BOD >2,000 mg/L | 60–80% BOD + biogas |
| 3b Polishing | MBR | 0.1–0.4 µm hollow fibre | Sub-1 µm effluent, ~60% smaller than CAS |
| 4 Reuse polish | UF (PVDF) | 0.03 µm | TSS <1 mg/L, reusable wash water |
| Sludge side-stream | Plate-and-frame press | 1–500 m² area | 18–25% DS cake |
Sludge Handling and Dewatering: Where the Real Cost Lives
Sludge handling and dewatering accounts for 50–60% of total wastewater OPEX in feed and food plants — not the reactor tank. Engineers routinely oversize the biological stage and undersize the dewatering line, then spend the next decade paying for it in hauling fees.
Thickening is the first lever. A gravity belt or rotary drum thickener gets waste activated sludge to 4–6% dry solids; DAF thickening can push that to 5–7% DS in a single step (HydropureWater field data, 2026). The chosen thickener feeds the plate-and-frame filter press, which operates at 7–15 bar and delivers a cake at 18–25% DS across a 1–500 m² filtration area. Polymer conditioning typically runs 5–15 kg of cationic polyacrylamide per dry ton of solids — optimizing that dose alone often cuts polymer spend by 20–30%.
What happens to the cake in the U.S. is governed by 40 CFR Part 503 (S4). Three end-uses are recognized: land application (agricultural, reclamation, or distribution and marketing), surface disposal in a monofill or co-disposal MSW landfill, and incineration. Each carries its own pathogen-reduction, vector-attraction-reduction, and pollutant-ceiling requirements. The EPA collects Biosolids Annual Reports from roughly 2,350 facilities across 41 states (S4) — most small feed mills fall below the reporting threshold, but the same Part 503 ceilings still apply to anything they send to land. A 2026 sludge dewatering equipment comparison walks through supplier selection once the dewatering target is fixed.
Disposal vs. Reuse: Landfill, Land Application, or Single-Cell Protein
Three end-of-pipe options are credible for a 2026 feed-mill project: landfill or incineration, 40 CFR Part 503 land application, and single-cell protein (SCP) recovery. Each has a different balance of capex, regulatory burden, and 2026 readiness.
Route A — landfill or incineration — is the default in many jurisdictions. It is straightforward, but S3 and S5 describe it as slow, energy-hungry, and pollution-prone, and rising landfill levies are pushing operators off it. Route B — 40 CFR Part 503 land application — requires the cake to meet pathogen and vector-attraction-reduction criteria plus heavy-metal ceilings (per EPA, S4). It is only viable if the plant's sludge has a clean metals profile and a local farm or reclamation site will accept the material.
Route C — SCP recovery — is where the headlines live. The 2025 NTU solar-electrochemical process recovers 91.4% of organic carbon and converts 63% to feed-grade SCP, against roughly 50% for conventional anaerobic digestion (per S3, S5). The lab numbers also claim 10% energy efficiency, up to 13 L of green hydrogen per hour, and 99.5% lower carbon emissions than incumbent methods. The catch: this is still lab-scale, and the NTU team themselves flag electrochemical cost and wastewater-plant integration as the scale-up hurdles (S3, S5). A 2026 buyer should monitor pilot projects but not yet specify SCP as the primary end-of-pipe route. A PLC-controlled chemical dosing skid keeps the upstream train flexible enough to feed a future SCP line if economics move.
| Route | Capex (relative) | OPEX (relative) | Regulatory complexity | Sustainability | 2026 readiness |
|---|---|---|---|---|---|
| Landfill / incineration | Low | High (tipping fees, hauling) | Low | Poor | Mature, but tightening |
| 40 CFR Part 503 land application | Low–medium | Medium (PAPR monitoring) | Medium–high (Part 503, metals) | Good when soils accept | Mature, EPA-tracked |
| SCP recovery (NTU-style) | High (electrochemical) | Unproven at scale | High (TSE feed-ban interaction) | Excellent in lab | Pilot scale only |
Designing for 2026: Specs, Compliance, and a Future-Proof Train
The shortest path to a defensible 2026 specification is to anchor the train in equipment that works today and to leave room for the SCP route. DAF for FOG and TSS, MBR or UF for polishing, and a plate-and-frame filter press for dewatering are all proven in food and feed duty (HydropureWater field data, 2026). PLC automation and a PLC-controlled chemical dosing skid let the same line be re-aimed at SCP recovery if the technology matures. A JBS rendering-plant wastewater case study shows how the same architecture is being deployed in adjacent rendering duty today.
On compliance, lock the baseline before the design starts: 40 CFR Part 503 in the U.S., EU Urban Waste Water Directive 91/271/EEC for plants discharging to sewer, and TSE feed-ban (EC 999/2001) for any path that might touch the feed chain. Then plan for tightening: lower BOD and total-nitrogen limits, more PFAS scrutiny, and possible carbon-pricing of disposal routes are all trending 2026–2030. Rotary mechanical bar screen selection, equalization volume, and biological-stage turn-down ratio are the cheapest places to buy headroom for those changes now.
Before any equipment order, pull the EPA Biosolids Annual Reports dataset (S4) as a free benchmark — it gives actual end-use splits across ~2,350 U.S. facilities and is the single best public reference for what a regulated cake-disposal market actually looks like in 2026.
Frequently Asked Questions
How much does animal feed wastewater sludge treatment cost?
For a 100–500 m³/d feed-mill plant, ballpark capex sits in the US$0.5–2.0 M range for a DAF-MBR-plate-press train, with OPEX around US$0.3–1.2 per cubic metre treated. Sludge logistics (thickening, dewatering, hauling, tipping) is the dominant line item, typically 50–60% of OPEX, which is why the dewatering step deserves more engineering hours than the aeration tank.
Can feed-mill sludge be turned into animal feed?
Only along a documented regulatory pathway. In the U.S., 40 CFR Part 503 governs land application, and any biosolids that re-enter the feed chain have to meet pathogen-reduction and pollutant-ceiling criteria (per EPA, S4). In the EU, the TSE feed-ban (EC 999/2001) restricts which sludges may ever re-enter the feed chain. Emerging SCP routes (e.g., the 2025 NTU process) sit in a regulatory grey zone in 2026 and are not yet a defensible specification.
What is the best biological treatment for high-strength feed effluent?
For BOD above 2,000 mg/L, a UASB or CSTR anaerobic reactor is the right primary step — it removes 60–80% of the organic load while producing biogas, and the effluent then polishes on an aerobic MBR. For lower influent strengths, MBR alone is competitive and saves footprint. A MBR vs CAS trade-off guide walks through the choice in more detail.
How much sludge does a feed mill generate?
A feed mill typically generates 0.3–1.0 kg of dry solids per cubic metre of wastewater treated, depending on raw-material mix and how effectively FOG is captured upstream. Rendering plants run higher because of the segregated blood and feather streams, which is why those are usually handled in a dedicated side-stream train.
Is the NTU solar-to-protein process commercial in 2026?
No. The 91.4% organic-carbon recovery and 63% SCP conversion (S3, S5) are lab-scale numbers, and the NTU team themselves flag electrochemical cost and wastewater-plant integration as the open scale-up questions. Spec a conventional DAF + MBR + plate-press dewatering line for 2026 delivery and monitor the pilot data as it matures.