
Why Fruit Processing Wastewater Defies a Standard UF Spec
Raw fruit processing wastewater typically runs COD 3,000-15,000 mg/L, BOD 1,500-8,000 mg/L, TSS 500-4,000 mg/L, and pH 3.5-6.5; concentrate plants push BOD past 8,000 mg/L on citrus campaign peaks, while CIP weeks drop the load by 80% (HydropureWater field data, 2026). That 5× swing in organic load between production and clean-in-place months is the single biggest reason equalization basins cannot rescue biological kinetics on their own — the hydraulic retention time that works on campaign day starves the biomass on a rinse day, and the loading that fits a clarifier on a rinse day blows the clarifier on a campaign day. Three effluent fractions defeat conventional biology without a membrane barrier in front of it: pectin and hemicellulose at 50-500 kDa, which biodegrade slowly and gel-form on any membrane they touch; residual mono- and disaccharides that drive rapid biofouling and oxygen demand; and color/phenolic compounds that pass activated sludge largely intact. The practical implication is that ultrafiltration on this stream is sized specifically for the 50-500 kDa macromolecular fraction, with the rest of the load passed to a downstream biological stage or to RO. Treating UF as a juice-clarification accessory — the framing the SERP is currently dominated by — misses the point. In a wastewater train, UF is a barrier stage whose job is to strip the gel-formers and colloids so that whatever sits behind it (MBR for discharge, RO for reuse) does not have to eat the macromolecular load raw. A 2026 retrofit that specifies UF as a polish for biology, rather than as the macromolecular barrier, will undersize the membrane area and overrate the downstream biology.
Where UF Sits on the Membrane Spectrum
UF is defined by a 0.01-0.1 μm pore size and a 10-100 kDa molecular weight cutoff, where MWCO is the 90% rejection threshold — a 20 kDa membrane holds back 90% of dissolved molecules above 20,000 Daltons. On the membrane spectrum UF sits between microfiltration (MF, 0.1-10 μm, no pressure resistance) and nanofiltration (NF, 200-1,000 Da, partial divalent salt removal), with reverse osmosis (RO) below 200 Da and operating at 1.0-3.0 MPa. The pressure delta between a UF stage at 0.1-0.5 MPa and an RO stage at 1.0-3.0 MPa is the single largest contributor to the OPEX gap between the two stages, and it is the reason a UF skid does not require high-pressure pumps, pressure vessels rated to 80 bar, or energy recovery devices. What UF removes from a fruit wastewater stream: 92-99% of TSS, turbidity to under 1 NTU, 60-85% of macromolecular COD, colloids, color bodies above the MWCO, and most bacteria. What UF does not remove: dissolved sugars below the MWCO cutoff, monovalent salts, and low-MW phenolics. That reject-and-pass line is what makes UF the right barrier to put ahead of either an MBR (which then handles the dissolved organics UF passes) or an RO (which then polishes UF permeate to reuse grade). The MBR-side precedent in juice-plant literature confirms that submerged UF at roughly 0.035 μm inside a biological reactor delivers the same macromolecular rejection as a sidestream UF skid, but couples it to biomass contact — relevant when a project is choosing between sidestream UF + downstream biology versus a single MBR tank (per Condorchem, juice MBR data).
Parameter Window for Fruit Wastewater UF
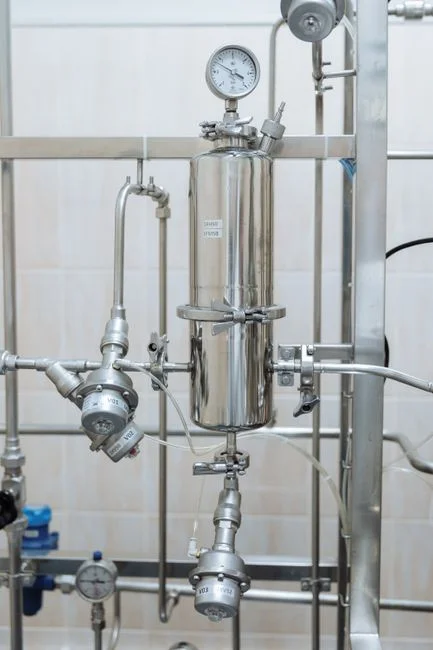
The working design window for juice wastewater UF is narrow enough to be specified as a single table an engineer can hand to a vendor as a spec sheet. Below 10 kDa the flux penalty becomes NF-class on pectin streams and the energy cost doubles; above 100 kDa color bodies and high-MW phenolics pass into the permeate and defeat downstream RO. Cross-flow velocity splits by geometry: tubular and ceramic modules tolerate 1-3 m/s, while hollow fiber must stay in the 0.1-0.5 m/s band because fiber breakage at higher shear collapses the pathogen LRV (Springer, Food and Environmental Virology, 2025). Temperature ceiling separates the material classes cleanly: 45°C for polymeric PES/PVDF, 95°C for ceramic — and that single number drives whether hot caustic CIP is on the table. CIP is triggered when flux at constant TMP drops below threshold or when TMP at constant flux rises more than 10% in 24 hours. A representative hollow-fiber UF system is sized against this envelope, not against a generic "0.01 μm membrane" claim.
| Parameter | Working Range (Juice Wastewater UF) | Design Note |
|---|---|---|
| MWCO | 10-100 kDa (20-50 kDa standard) | Below 10 kDa = NF flux decline on pectin; above 100 kDa = color body breakthrough. |
| Pore size | 0.01-0.1 μm | Bridges MF colloids and NF true solutions. |
| Steady flux | 50-200 LMH | Higher at low viscosity; drops 40-60% between CIP cycles as fouling builds. |
| CIP trigger | Flux drop or TMP rise >10%/24 h | Triggers CIP same shift, not on the next scheduled interval. |
| TMP | 0.1-0.5 MPa polymeric; up to 0.8 MPa ceramic | Polymeric fibers deform irreversibly above 0.3 MPa differential. |
| Cross-flow velocity | 1-3 m/s tubular/ceramic; 0.1-0.5 m/s hollow fiber | Fiber breakage at high shear causes LRV collapse in pathogen removal (Springer, 2025). |
| Recovery | 85-95% spiral-wound; 90-97% hollow fiber | Hollow fiber handles higher solids; spiral-wound needs lower TSS feed. |
| Temperature ceiling | 45°C PES/PVDF; 95°C ceramic | Drives CIP temperature and hot-CIP feasibility. |
| pH tolerance | 2-11 polymeric; 0-14 ceramic | Ceramic tolerates aggressive acid CIP; polymeric stays inside 2-11 envelope. |
| Feed TSS tolerance | <100-200 mg/L polymeric; 500-2,000 mg/L ceramic | Sets DAF pretreatment burden and backwash frequency. |
Polymeric vs Ceramic: Decision Matrix for 2026
Material choice is the largest single decision after MWCO, and it is governed by TSS tolerance, CIP chemistry, and budget horizon — not by a default. Polymeric membranes (PES, PVDF, polysulfone in hollow-fiber or spiral-wound formats) cost $80-220/m² and last 5-7 years, which is why they dominate 2026 food-plant retrofits where capital is constrained. Ceramic membranes (Al₂O₃, TiO₂, ZrO₂ in tubular monoliths) cost $400-900/m² but last 10-15 years, run at up to 95°C, and tolerate pH 0-14, which suits juice concentrate plants that run hot caustic and hot acid CIP. Energy use scales with cross-flow demand: polymeric UF draws 0.3-0.8 kWh/m³, ceramic 0.8-2.0 kWh/m³. Suspended solids tolerance is the practical separator: ceramic handles 500-2,000 mg/L TSS influent directly, while polymeric needs DAF ahead to keep TSS under 100-200 mg/L. The decision logic: high TSS, hot CIP, 10+ year horizon, concentrate-plant chemistry → ceramic; standard bottling line, tight CapEx, modest CIP → polymeric hollow fiber. Reference data on UF membrane elements and replacement costs lets the engineer put a number on either choice at the RFQ stage.
| Parameter | Polymeric (PES/PVDF) | Ceramic (Al₂O₃/TiO₂/ZrO₂) |
|---|---|---|
| Format | Hollow fiber or spiral-wound | Tubular monolith, multichannel |
| Cost | $80-220/m² | $400-900/m² |
| Lifetime | 5-7 years | 10-15 years |
| Energy use | 0.3-0.8 kWh/m³ | 0.8-2.0 kWh/m³ |
| Max temperature | 45°C | 95°C |
| pH tolerance | 2-11 | 0-14 |
| Feed TSS | <100-200 mg/L (needs DAF ahead) | 500-2,000 mg/L |
| Best fit | Bottling line, tight CapEx, standard CIP | Concentrate plant, hot CIP, long horizon, high TSS |
The 5-Stage Train: DAF, Equalization, UF, MBR, RO
UF is never a standalone box in a working juice plant; it sits between mechanical pretreatment and either an MBR for discharge or an RO train for reuse. The realistic 2026 train runs five stages. Stage 1 is a DAF pretreatment system that removes FOG, settleable solids, and floated pectin floe — the FOG and colloidal fraction that would otherwise coat the UF membrane within hours. Stage 2 is equalization with pH correction to 6.5-7.5 to protect the UF membrane and any downstream biology from the pH excursions that ride in on CIP dumps. Stage 3 is UF as the macromolecular barrier — it strips residual TSS, colloids, color, and 60-85% of macromolecular COD, and delivers permeate at less than 1 NTU turbidity. Stage 4 is optional: an MBR polishing stage for residual organic polishing after UF handles the dissolved sugar and low-MW COD that UF passes, for sites with tight discharge limits or where RO feed specs need biological polishing first. Stage 5 is an industrial RO system for downstream water reuse, polishing UF permeate to process-grade reuse at 90-95% overall recovery. The choice between MBR and RO at Stage 4/5 is what turns the train from a discharge plant into a reuse plant. A DAF vs clarifier selection for food wastewater analysis is the right place to defend Stage 1 sizing; the 2026 membrane technology OEM buyer's guide extends the cost argument across Stages 3-5.
CAPEX, OPEX, and the Reuse Payback
For a 500 m³/day polymeric UF skid, skid-mounted with PLC, turnkey CAPEX in 2026 sits at $90,000-220,000 (HydropureWater field data, 2026); ceramic equivalents run 2-3× higher because of the membrane cost. OPEX breaks down as energy $0.02-0.06/m³, CIP chemicals $0.01-0.05/m³, membrane replacement amortized $0.01-0.07/m³, and labor effectively negligible at 500 m³/day. The total UF-stage OPEX band is therefore $0.04-0.18/m³ treated — state it as a range, not a point estimate, because influent TSS and CIP frequency swing it by 3×. Membrane life is conditional on CIP discipline: 5-7 years for polymeric, 10-15 years for ceramic, but aged and fouled UF modules lose pathogen LRV and TSS rejection steadily, so the life number assumes weekly alkaline plus acid CIP (Springer, Food and Environmental Virology, 2025). The reuse credit changes the math: at $1.50-4.00/m³ avoided fresh-water cost typical in fruit processing, a 90% reuse UF+RO train at 1,000 m³/day pays back in 2-4 years. An automatic CIP dosing system is the cheapest single reliability upgrade — it holds CIP concentration inside the 0.5-1.0% NaOH band and prevents the under-dosing that shortens membrane life. For broader context on OEM selection and consumables budgeting, the industrial water footprint reduction strategies piece frames the regulatory and market drivers behind the reuse credit.
| Cost Element | 2026 Band (Polymeric UF, 500 m³/day) | Driver |
|---|---|---|
| Turnkey CAPEX | $90,000-220,000 | Skid + PLC + installation; ceramic 2-3× higher. |
| Energy | $0.02-0.06/m³ | Cross-flow pump duty at 0.3-0.8 kWh/m³. |
| CIP chemicals | $0.01-0.05/m³ | NaOH + acid + hypochlorite, swing driven by fouling rate. |
| Membrane replacement (amortized) | $0.01-0.07/m³ | $80-220/m² polymeric, 5-7 year life. |
| Total UF-stage OPEX | $0.04-0.18/m³ | Range, not point estimate; 3× swing with TSS and CIP frequency. |
| Reuse credit | $1.50-4.00/m³ | Avoided fresh-water cost; 90% reuse at 1,000 m³/day = 2-4 year payback. |
Fouling Control and Pathogen LRV Risk
Fouling is the single most common real-world failure mode for juice-plant UF, and it is fully preventable with a documented rhythm. Daily: monitor TMP trend at constant flux — a greater than 10% rise in 24 hours signals imminent CIP and should trigger it the same shift rather than at the next scheduled interval. Every 7-14 days: alkaline wash at pH 11-12 with 0.5-1.0% NaOH at 35-40°C, 60-90 minutes of recirculation, to hydrolyze the pectin and protein gel layer that builds on the membrane surface. Follow with an acid wash at pH 2 with citric or nitric acid to remove scale and any metal hydroxides the alkaline step left behind. Weekly sanitation: 200-500 ppm sodium hypochlorite soak for microbiological control — this step is non-optional because fiber integrity loss directly collapses the LRV against human enteric viruses, and the documented failure mode in aged modules is precisely the pathogen leakage that would otherwise rule out reuse (Springer, Food and Environmental Virology, 2025). The hard physical rule: never exceed the manufacturer TMP ceiling, because polymeric PES/PVDF fibers deform irreversibly above 0.3 MPa differential, and the deformation is permanent even if the flux looks recovered after CIP. An aged module that has been pushed past its TMP ceiling and is being cleaned on schedule can still lose 1-2 LRV against MS2 or human enteric virus surrogates — which is the most common reuse-permit failure mode in food-plant UF retrofits and the single number EHS will ask about.
Frequently Asked Questions
What MWCO should be used for fruit juice wastewater UF?
The working band is 10-100 kDa. Below 10 kDa, flux decline becomes NF-class on pectin streams; above 100 kDa, color bodies and high-MW phenolics pass into the permeate and foul downstream RO. 20-50 kDa is the standard selection for juice concentrate and bottling wastewater.
Can ultrafiltration replace biological treatment for juice wastewater?
No. UF removes macromolecular COD, TSS, colloids, and color, but it does not remove dissolved sugars or low-MW organics. UF dramatically reduces biological loading and enables water reuse, but a downstream biological step (MBR or conventional activated sludge) is still required unless the permeate goes directly to RO for closed-loop reuse.
How often should UF membranes be cleaned in a juice plant?
Every 7-14 days under normal operation, with daily TMP monitoring. A greater than 10% rise in TMP over 24 hours at constant flux is the trigger to clean immediately rather than wait for the next scheduled CIP.
Is ceramic UF worth the higher cost for fruit juice effluent?
Ceramic costs 3-5× more per m² but lasts 2-3× longer, tolerates 500-2,000 mg/L TSS directly, and runs hot CIP at 95°C. It pays back in concentrate plants with hot caustic/acid CIP and high TSS; it does not pay back in standard bottling lines with modest chemistry and tight capital budgets.
What discharge or reuse standard does UF permeate typically meet?
UF permeate from a juice plant typically meets less than 1 NTU turbidity and less than 5 mg/L TSS — suitable as RO feed for reuse under EU IPPC BREF food-and-drink effluent guidelines and EPA food-processing reuse frameworks. UF permeate alone is not discharge-ready for most jurisdictions; it still needs biological polishing or RO to meet BOD/COD limits.
Related Equipment
- industrial RO system — specifications, capacity range, and technical data