Ultrafiltration System for Brewery Wastewater: 2026 Selection Guide with Performance Data
For brewery wastewater, ultrafiltration systems achieve 84-98% COD removal and 88-99% BOD5 removal depending on configuration. Submerged MBR (0.1 μm PVDF) suits 100-2,000 m³/day with 60% smaller footprint (engineering estimate compared to conventional activated sludge); ceramic UF (1-50 kDa) with coagulation pre-treatment handles high-strength streams (COD 48,230 mg O2/L) and enables 94%+ DOC removal when paired with RO (S2); external crossflow handles variable loads. Pre-treatment (screening, DAF, coagulation at 2 mL/L PIX 113) is critical for flux stability (S2).Brewery Wastewater Characteristics That Drive UF System Design
Brewery wastewater typically presents a chemical oxygen demand (COD) range of 3,000-60,000 mg/L and biochemical oxygen demand (BOD5) of 2,000-40,000 mg/L, driven by fermentable sugars, proteins, and yeast (S1: COD 58,800 mg O2/L, BOD5 59,853 mg O2/L). Influent parameters often include total suspended solids (TSS) from 500-2,000 mg/L (S1: 1,284 mg/L) and a pH range of 3.5-7.5, with specific samples recorded at pH 4.36 (S1). High-strength brewery wastewater can exhibit COD levels exceeding 48,000 mg O2/L and BOD5 levels over 34,000 mg O2/L, with dissolved organic carbon (DOC) around 6,500 mg C/L (S2). Key foulants in brewery wastewater, such as proteins (from yeast and malt), polysaccharides (e.g., β-glucans), and polyphenols (from hops), contribute significantly to membrane fouling. These constituents can cause irreversible adsorption, particularly on hydrophobic PVDF membranes, necessitating robust cleaning protocols. Operational variability, including frequent clean-in-place (CIP) cycles with high pH and temperature spikes (25-35°C, typical) and seasonal production changes or spent grain discharges, can lead to 3-5x flow and load swings. This variability requires an ultrafiltration system designed for resilience and stable performance. For discharge into municipal sewers, compliance with Chinese standard GB 18918-2002 Table 2 mandates effluent quality targets of COD ≤500 mg/L, BOD5 ≤300 mg/L, SS ≤400 mg/L, and NH3-N ≤25 mg/L. Water reuse applications, however, demand significantly stricter effluent quality.Three UF System Architectures Compared for Brewery Applications
1. Submerged MBR (Membrane Bioreactor)
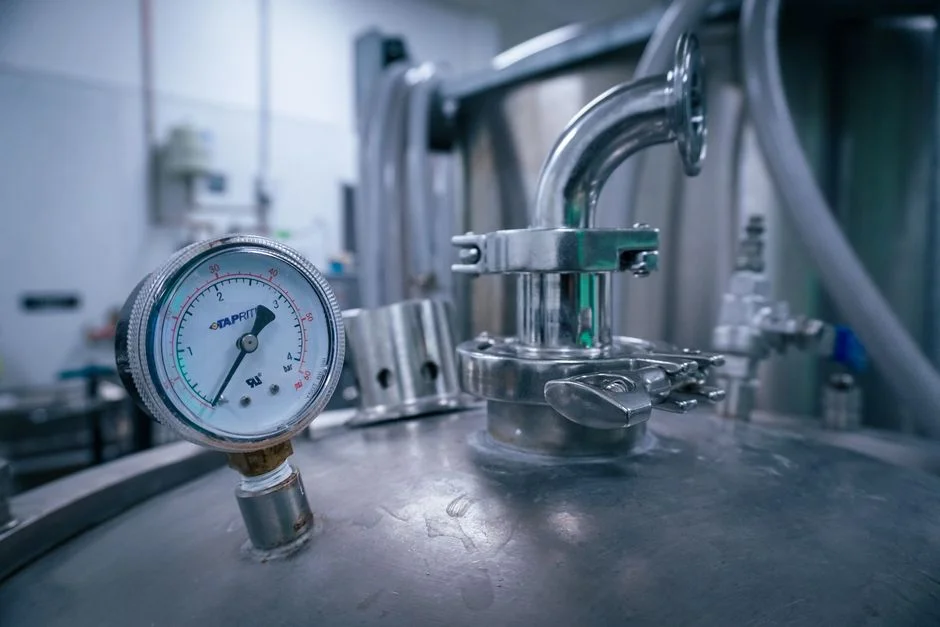
This configuration, often utilizing 0.1 μm PVDF flat sheet membranes, is suitable for flows from 100-2,000 m³/day. It offers a significant footprint reduction, typically around 60% compared to conventional activated sludge systems (engineering estimate), making it ideal for sites with limited space. Membrane scouring is achieved through aeration, requiring 0.3-0.5 kWh/m³ of energy (engineering knowledge). Submerged MBRs are effective for post-aerobic polishing, consistently producing effluent with COD <100 mg/L and BOD5 <30 mg/L (HydropureWater DF Series data). HydropureWater DF Series MBR modules provide membrane areas from 80-225 m² each, with capacities ranging from 32-135 m³/day. For a deeper dive into MBR applications, refer to our MBR system case study for food processing with cost and ROI analysis.2. External Crossflow UF
External crossflow UF systems, typically employing polymeric hollow fiber membranes (10-100 kDa), are designed for larger capacities, generally from 500-5,000 m³/day. These systems can achieve higher fluxes of 40-80 LMH but incur 2-3 times higher energy consumption, ranging from 1.2-2.0 kWh/m³ due to recirculation pumping (engineering knowledge). They are robust for handling variable solids concentrations and offer easier membrane access for cleaning. A notable example is the Pentair X-Flow Airlift MBR, which has a reference installation at Polar Brewery in Venezuela treating 1,800 m³/day (S4).3. Ceramic UF
Ceramic UF systems, featuring tubular or multichannel membranes with pore sizes from 1-50 kDa, are well-suited for flows between 200-3,000 m³/day. Their primary advantages include extreme chemical and thermal resistance, allowing for aggressive cleaning and steam sterilization. With coagulation pre-treatment, such as 2 mL/L PIX 113, ceramic UF can achieve 78-98% COD removal (S2). While initial capital expenditure (CAPEX) is higher, the membranes boast a longer lifespan of 10-15 years (engineering knowledge), leading to lower replacement frequency.Hybrid Treatment Trains
For advanced treatment and water reuse, hybrid trains are often employed. A common configuration includes anaerobic digestion (e.g., UASB) followed by an integrated MBR system for brewery wastewater treatment or UF, and then further polished by reverse osmosis (RO) for water reuse. The Polar Brewery model successfully utilizes an Anaerobic (UASB) → Airlift MBR → RO train for water reclamation (S4). For high-strength wastewater or zero liquid discharge (ZLD) goals, an Anaerobic → ceramic UF → RO sequence is often preferred.| Feature | Submerged MBR | External Crossflow UF | Ceramic UF |
|---|---|---|---|
| Typical Flow Rate | 100-2,000 m³/day | 500-5,000 m³/day | 200-3,000 m³/day |
| Membrane Material | PVDF (polymeric) | Polymeric (e.g., PES, PVDF) | Al₂O₃, TiO₂, ZrO₂ (ceramic) |
| Pore Size / MWCO | 0.1 μm | 10-100 kDa | 1-50 kDa |
| Typical Flux (LMH) | 15-25 | 40-80 | 50-120 |
| Energy Consumption | 0.3-0.5 kWh/m³ (aeration) | 1.2-2.0 kWh/m³ (pumping) | 1.0-1.8 kWh/m³ (pumping) |
| Footprint | 60% smaller (vs CAS) | Moderate | Moderate |
| Membrane Life | 3-5 years | 3-7 years | 10-15 years |
| Fouling Resistance | Moderate (prone to organic) | Good (crossflow shear) | Excellent (chemical/thermal) |
| CAPEX (Relative) | Low-Moderate | Moderate | High |
Membrane Selection Criteria: Pore Size, Material, and Fouling Resistance
Selecting the appropriate UF membrane for brewery wastewater hinges on pore size, material composition, and inherent resistance to the specific organic and biological foulants present.Pore Size vs. Removal Efficacy:
Membrane pore size directly dictates the removal capabilities. A 0.1 μm membrane, typical in MBR systems, effectively removes bacteria and suspended solids, achieving COD reductions of 84-90% (S1: 84.0-84.4%). For the removal of larger macromolecules, 10-50 kDa ceramic UF membranes are employed, yielding 78-85% COD removal when used alone (S2: 78.2% for a 1 kDa membrane). When integrated into a coagulation-assisted ceramic UF and RO train, overall COD removal can reach 97.9%, with DOC removal achieving 94.0% (S2). A 1 kDa membrane alone achieves approximately 49.8% DOC removal (S2).Material Trade-offs:
- PVDF (Polyvinylidene Fluoride): This is a common polymeric material for UF membranes. It is generally hydrophobic and thus prone to organic fouling from brewery wastewater constituents like proteins and polysaccharides. Maintenance cleaning typically involves sodium hypochlorite (NaOCl) and citric acid.
- Ceramic (Al₂O₃, TiO₂, ZrO₂): Ceramic membranes are inherently hydrophilic, making them less susceptible to organic fouling. They exhibit superior chemical resistance across a wide pH range (0-14), can tolerate high concentrations of oxidants like 5000 ppm NaOCl, and are steam sterilizable. This robustness contributes to their 10-15 year lifespan.
- PES (Polyethersulfone): Another polymeric option, PES membranes offer a lower cost alternative but typically have a narrower pH operating range compared to ceramic membranes.
Fouling Resistance and Mechanisms:
Brewery wastewater foulants lead to distinct fouling mechanisms: irreversible protein adsorption, reversible polysaccharide gel layer formation (often mitigated by backwash), polyphenol oxidation (contributing to color), and biofouling. Ceramic membranes, particularly when combined with coagulation, are observed to shift the fouling mechanism towards a more easily reversible cake layer rather than irreversible pore blocking (engineering knowledge, S2). This shift contributes to more stable flux and reduced cleaning frequency.Flux Targets and Operating Pressure:
Typical operating flux targets vary by system:- Submerged MBR: 15-25 LMH (liters per square meter per hour) at a Transmembrane Pressure (TMP) of 0.05-0.1 MPa.
- External Crossflow UF: 40-80 LMH at 0.2-0.4 MPa TMP.
- Ceramic UF: 50-120 LMH at 0.1-0.3 MPa TMP.
| Parameter | PVDF (Polymeric) | Ceramic (Al₂O₃/TiO₂/ZrO₂) | PES (Polymeric) |
|---|---|---|---|
| Typical Pore Size | 0.1 μm (MBR) | 1-50 kDa | 10-100 kDa |
| Material Hydrophilicity | Hydrophobic | Hydrophilic | Moderately Hydrophilic |
| pH Tolerance | 2-10 | 0-14 | 1-12 |
| Oxidant Tolerance (NaOCl) | ~200 ppm | >5000 ppm | ~100 ppm |
| Temperature Tolerance | <40°C | Up to 150°C (steam sterilizable) | <60°C |
| Fouling Resistance (Organic) | Moderate (adsorption) | High (cake layer) | Moderate |
| Typical Membrane Life | 3-5 years | 10-15 years | 3-7 years |
Essential Pre-Treatment Train for Stable UF Operation
Step 1: Fine Screening
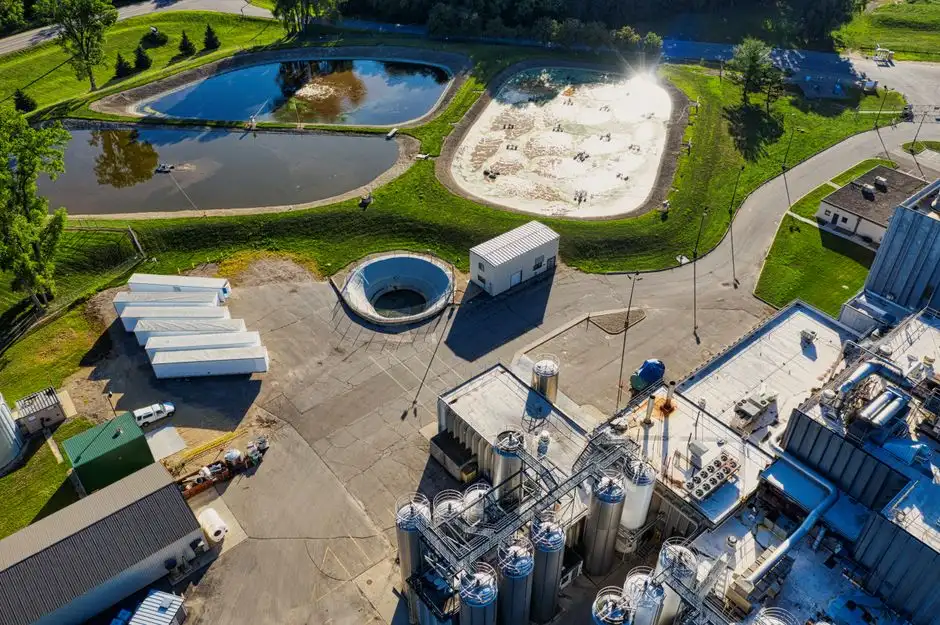
Fine screening with 1-2 mm rotary drum or rotary bar screens is the initial and crucial step. This removes larger solid contaminants such as spent grain, hops, and label fragments, protecting downstream pumps and membranes from abrasive damage and gross fouling (engineering knowledge). HydropureWater GX Series rotary mechanical bar screens feature stainless steel rake teeth and self-cleaning brushes for continuous operation.Step 2: Dissolved Air Flotation (DAF)
DAF is highly effective for removing fats, oils, and grease (FOG), yeast, and suspended solids (TSS) from brewery wastewater. Typical brewery wastewater can contain FOG levels between 200-800 mg/L and yeast concentrations of 500-2,000 mg/L (engineering knowledge). A well-designed DAF system can achieve 80-95% TSS removal and 70-90% FOG removal at surface loading rates of 20-40 m/h (HydropureWater data). HydropureWater DAF systems are available in capacities from 4-300 m³/h, utilizing micro-bubble technology for efficient separation. For detailed design principles, refer to our DAF design guide for high-FOG food wastewater.Step 3: Coagulation Dosing
Chemical coagulation is critical for destabilizing colloidal particles and enhancing their removal prior to UF. Dosing with coagulants like PIX 113 (a ferric chloride-based product) or traditional FeCl3/Alum at concentrations of 1.5-3.0 mL/L is typical. Research confirms that a 2 mL/L PIX 113 dosage is optimal for charge neutralization in high-strength brewery wastewater (S2). This step significantly reduces the UF fouling rate by an estimated 60-70% (engineering knowledge) and can dramatically improve COD removal; for instance, from 78% (UF alone) to 97.9% (with coagulation and UF+RO) (S2 data). HydropureWater offers automated coagulant dosing for UF pre-treatment to ensure precise and consistent chemical application.Step 4: pH Adjustment
Brewery wastewater is often acidic, with pH levels typically ranging from 3.5-5.0 (S1: pH 4.36). Adjusting the pH to a neutral range of 6.5-7.5 is essential. This protects the integrity of pH-sensitive polymeric membranes and optimizes the performance of coagulation chemicals. An automated dosing system for acid or base addition is highly recommended to maintain stable pH.System Sizing, CAPEX/OPEX Ranges, and ROI Drivers
Accurate system sizing for an ultrafiltration plant in a brewery environment must account for peak daily flows, membrane availability, and specific flux rates to ensure reliable operation and optimal capital expenditure (CAPEX).Sizing Methodology:
The design flow rate is typically calculated as the peak daily flow multiplied by a 1.2 safety factor (engineering practice) to accommodate fluctuations and future expansion. The required membrane area is then determined by dividing the design flow by the product of the average operating flux (LMH), 24 hours, and the system availability. Availability is generally targeted at 90-95% for submerged MBR systems and 85-90% for external crossflow or ceramic UF systems, accounting for cleaning cycles and maintenance (engineering practice).CAPEX Benchmarks (2026, CNY, Equipment + Installation):
Capital expenditure for UF systems varies significantly by type and capacity:- 500 m³/day Submerged MBR: ¥1.2-1.8 Million (HydropureWater project data, 2026).
- 500 m³/day Ceramic UF: ¥2.5-3.5 Million (HydropureWater project data, 2026).
- 2,000 m³/day External Crossflow UF: ¥4-6 Million (HydropureWater project data, 2026).
OPEX Breakdown:
Operational expenses are dominated by energy consumption and membrane replacement:- Energy: 45-55% (primarily for aeration in MBRs and pumping in crossflow/ceramic systems).
- Chemicals: 15-20% (for membrane cleaning, coagulation, and pH adjustment).
- Membrane Replacement: 20-25% (PVDF membranes typically last 3-5 years, while ceramic membranes offer a longer lifespan of 10-15 years).
- Labor: 10-15% (for operation, monitoring, and routine maintenance).
ROI Drivers:
The return on investment for an ultrafiltration system is primarily driven by:- Water Reuse: Savings of ¥8-15/m³ by reducing municipal water purchases and sewer surcharges (China average, 2026).
- COD Surcharge Avoidance: Savings of ¥2-5/kg by reducing pollutant discharge to municipal systems (China average, 2026).
| Cost Category | Submerged MBR (500 m³/day) | Ceramic UF (500 m³/day) | Crossflow UF (2,000 m³/day) |
|---|---|---|---|
| CAPEX (Equipment + Installation) | ¥1.2-1.8 Million | ¥2.5-3.5 Million | ¥4-6 Million |
| OPEX Breakdown: Energy | 45-55% | 45-55% | 45-55% |
| OPEX Breakdown: Chemicals | 15-20% | 15-20% | 15-20% |
| OPEX Breakdown: Membrane Replacement | 20-25% (3-5 yr PVDF) | 20-25% (10-15 yr Ceramic) | 20-25% (3-7 yr Polymeric) |
| OPEX Breakdown: Labor | 10-15% | 10-15% | 10-15% |
| Typical Payback Period (with reuse) | 2.5-3.5 years | 3-4 years | 2.5-3.5 years |
Vendor Evaluation Checklist: 12 Technical Questions to Ask
| Category | Technical Question | Key Criteria |
|---|---|---|
| Performance Guarantee | 1. Will you conduct a 30-60 day pilot test on our actual wastewater? What flux, cleaning frequency, and removal data (e.g., COD, BOD5, TSS) will you guarantee based on pilot results? | Guaranteed permeate quality, stable flux, and cleaning cycles. |
| 2. What is the membrane warranty (e.g., PVDF 3-5 years pro-rata, ceramic 10 years)? What are the flux recovery and integrity test acceptance criteria for warranty claims? | Clear, measurable warranty terms for membrane life and performance. | |
| Operational Protocols | 3. Provide a detailed CIP (Clean-in-Place) recipe (chemical type, concentration, temperature, duration, frequency) specifically for brewery foulants. Can you demonstrate >90% flux recovery post-CIP? | Effective and documented cleaning protocols for brewery wastewater. |
| 4. Describe the system's automation features, including PLC/SCADA integration, remote monitoring capabilities, automatic CIP sequencing, and flux/TMP trending with alarm escalation. | High degree of automation for reduced labor and optimized performance. | |
| Experience & Support | 5. Provide a minimum of 3 reference sites with brewery installations operating for >2 years, along with contact references. Include performance data (flux, cleaning frequency, membrane life) from these sites. | Proven track record in brewery wastewater treatment. |
| 6. Detail your spare parts inventory. Do you maintain local stock for membranes, pumps, valves, and instruments? What is your guaranteed delivery commitment (e.g., 48-hour)? | Reliable local spare parts availability to minimize downtime. | |
| 7. What operator training is provided (minimum 2 days)? Is a comprehensive maintenance manual available in Chinese? What is your emergency response Service Level Agreement (SLA)? | Adequate training and support for operational continuity. | |
| Technical Design | 8. How is the system designed to handle flow and load variability from CIP cycles and seasonal production changes (e.g., buffer tanks, equalization)? | Robust design for fluctuating brewery wastewater characteristics. |
| 9. What is the specific membrane material, pore size/MWCO, and configuration (e.g., flat sheet, hollow fiber, tubular) proposed? Justify the selection based on our wastewater profile. | Technical justification for membrane choice. | |
| 10. Detail the pre-treatment train (screening, DAF, coagulation, pH adjustment). What are the guaranteed removal efficiencies for TSS, FOG, and COD at each pre-treatment step? | Comprehensive and effective pre-treatment strategy. | |
| Cost & Efficiency | 11. Provide a detailed breakdown of estimated CAPEX (equipment, installation) and OPEX (energy, chemicals, membrane replacement, labor) for the proposed system over a 5-year period. | Transparent and detailed cost analysis. |
| 12. What are the system's energy consumption (kWh/m³) and chemical consumption (kg/m³ or L/m³) guarantees? | Guaranteed operational efficiency metrics. |