Why a Paper-Mill Expansion Forces an ETP Redesign
A capacity add of 120,000 tonnes per year at an existing 92,500-tpy paper mill raised the ETP influent by 14,500 m³/day — a 28% step-up over the 51,000 m³/day design flow (Nandy et al., 2002, Resources, Conservation and Recycling Vol. 34). The paper industry generates 15–40 m³ of wastewater per tonne of product (Rajshree, 2024), so a 250,000-tpy International Paper containerboard line adds 3,750–10,000 m³/day of new load depending on furnish and water-loop closure — roughly 7–20% on top of a mid-sized existing ETP. Three failure modes follow.
First, hydraulic overload: equalisation basins and clarifiers sized for the original design flow cannot buffer the new peaks, so primary-clarifier surface overflow rates climb past 30 m³/m²/day and TSS carryover to the aeration tank rises. Second, organic overload: pushing the activated-sludge train past its design F/M of 0.1–0.2 kg BOD/kg MLSS/day drops COD removal from 80–90% to 50–60% within days — a recovery that takes weeks of re-seeding once biology crashes. Third, the discharge-quality bar moves: any expansion that increases production mass in the US triggers a review against EPA 40 CFR Part 430, Subpart B (Board and Paper Mills — Paperboard from Wastepaper) BAT limits, which are expressed as mass-per-product (BOD 0.31 lb/1,000 lb, TSS 0.41 lb/1,000 lb) rather than concentration — meaning a higher flow plus tighter mass loading usually forces tertiary polishing even if the old plant was "in spec" before. The Nandy 2002 precedent confirmed all three risks: the existing ETP was treating 42,903 m³/day against a 51,000 m³/day design, and the additional 14,500 m³/day from the new paper machine would have pushed it past operational stability without upgrades.
Influent Characterisation: OCC Containerboard vs Virgin Kraft
OCC (Old Corrugated Container) furnish — recycled corrugated boxes repulped and re-formed into linerboard and medium — dominates International Paper's US containerboard product mix and produces a fundamentally different wastewater than a virgin-wood kraft mill. OCC lines carry higher residual-fibre and starch loads (starch-based adhesives and surface sizing are added at the size press), while bleached-kraft lines carry higher colour, AOX, and recalcitrant lignin-derived COD. A 2024 CPPRI adequacy assessment at a 300-tpd integrated kraft mill in Saharanpur recorded primary-clarifier influent COD of 1,500–3,000 mg/L with low BOD/COD ratios reflecting the refractory fraction (Frontiers in Environmental Science, 2022). For a US OCC containerboard mill, the typical envelope is tighter and more biodegradable: TSS 800–1,500 mg/L, BOD 250–500 mg/L, COD 600–1,200 mg/L, pH 6–9, with significant flow and temperature swings from the paper-machine broke stream (Rajshree, 2024). Temperature excursions of 10–15 °C across a broke-discharge cycle shift aeration-tank oxygen demand by 20–30%.
The practical consequence for design is that an OCC-only mill can usually skip the high-rate anaerobic stage a virgin-kraft mill needs to knock down a 2,000+ mg/L COD load, and can run on a tightened primary train plus aerobic activated sludge with polishing — a smaller, cheaper, and faster-to-commission ETP. Conversely, a virgin-kraft expansion needs anaerobic pretreatment (UASB or IC reactor, 10–15 kg COD/m³·day loading) ahead of the aerobic stage to keep aeration-tank volume and power within reason.
| Parameter | OCC containerboard influent | Virgin kraft pulp-mill influent |
|---|---|---|
| TSS (mg/L) | 800–1,500 | 500–1,200 |
| BOD (mg/L) | 250–500 | 300–700 |
| COD (mg/L) | 600–1,200 | 1,500–3,000 |
| pH | 6–9 | 6–10 (caustic recovery upsets) |
| Colour / AOX | Low (starch-dominated) | High (lignin, chlorinated organics) |
| BOD/COD ratio | 0.30–0.45 (biodegradable) | 0.20–0.30 (refractory fraction) |
| Typical flow | 10–25 m³/t (high water closure) | 30–60 m³/t (integrated mill) |
The Three-Stage Treatment Train for a 2026 ETP
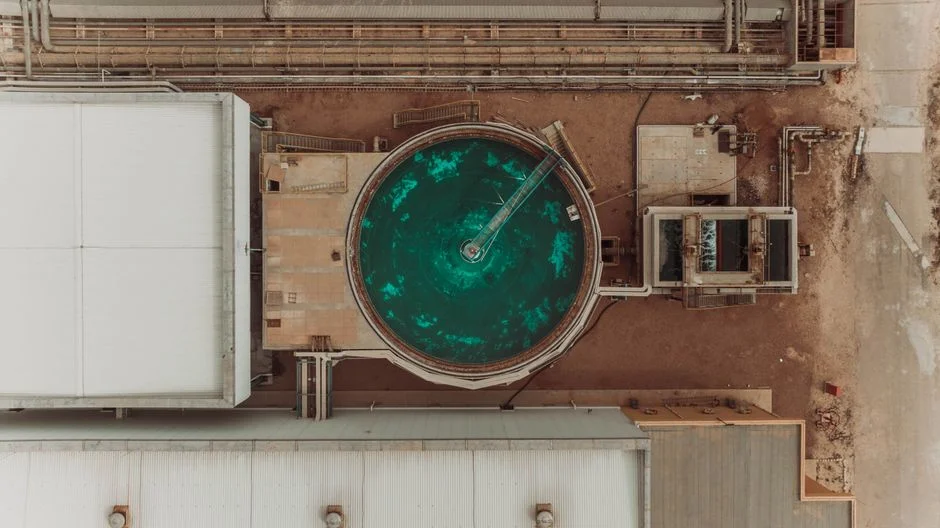
The proven train for an OCC-heavy containerboard ETP is three stages: primary clarification to cut suspended solids and COD, aerobic biological treatment to oxidise dissolved organics, and tertiary polishing to meet BAT mass limits and feed a paper-machine reuse loop. At the headworks, a rotary bar screen for paper-mill headworks at 3–6 mm aperture protects downstream pumps; flow then enters a 6–10 hour equalisation tank that buffers pH and broke-stream surges before a 2–4 hour primary clarifier, with an optional DAF system for paper-mill primary clarification floated on the clarifier overflow to strip fine fibre and filler that would otherwise bleed into the aeration tank. A well-tuned primary train reduces TSS from 800–1,500 mg/L to 100–200 mg/L and removes 30–40% of influent COD (Rajshree, 2024).
The secondary stage is conventional activated sludge: an aeration tank at 24–48 hour HRT, MLSS 2,000–4,000 mg/L, F/M 0.1–0.2 kg BOD/kg MLSS/day, and oxygen supplied at 1.5–2.0 kg O₂/kg BOD removed via fine-bubble diffusers (typical SOTE 25–35% per metre) or mechanical surface aerators. A secondary clarifier with RAS return at 50–100% of forward flow settles the biomass; secondary effluent lands at 80–180 mg/L COD and 10–30 mg/L BOD (Rajshree, 2024). For tighter effluent or smaller footprint, an MBR module with submerged PVDF membranes at 0.1–0.2 μm replaces the secondary clarifier, doubling MLSS to 6,000–10,000 mg/L and shrinking the aeration-tank volume by 50–60%.
The tertiary stage polishes residual TSS, colour, and dissolved solids to feed either discharge or a paper-machine reuse loop. A pressure multi-media filter drops TSS below 10 mg/L; downstream options include activated carbon for colour, MF/UF ahead of RO, and RO itself for closed-loop reuse or ZLD. EPA 40 CFR Part 430 Subpart B (Paperboard from Wastepaper) sets the BAT limits at BOD 0.31 lb/1,000 lb product and TSS 0.41 lb/1,000 lb product — at 250,000 tpy, that is roughly 35 tpy BOD and 46 tpy TSS on a 24-hour averaging basis, equivalent to a 30 mg/L BOD and 40 mg/L TSS target on the final effluent at design flow. The Nandy 2002 expansion demonstrated the reuse economics: 28,500 m³/day of fresh water conserved, an 88.8% offset on the new paper machine's demand by recycling biologically treated and polished effluent back into the stock-preparation and shower-water loops.
| Stage | Unit operation | Key design parameters | Effluent target |
|---|---|---|---|
| Primary | Bar screen → equalisation → clarifier / DAF | Screen 3–6 mm; EQ 6–10 hr; clarifier 2–4 hr HRT; SOR ≤30 m³/m²/day | TSS 100–200 mg/L; COD cut 30–40% |
| Secondary | Aeration tank + secondary clarifier (or MBR) | HRT 24–48 hr; MLSS 2,000–4,000 mg/L; F/M 0.1–0.2; O₂ 1.5–2.0 kg/kg BOD | COD 80–180 mg/L; BOD 10–30 mg/L |
| Tertiary | Sand / multi-media filter → MBR/UF → RO (optional) → AOP (optional) | Sand filter 10–15 m/hr; MBR flux 15–25 LMH; RO recovery 70–85% | TSS <10 mg/L; reuse-quality conductivity <50 µS/cm |
Sizing the Expansion ETP: Flows, Loads, and Tank Volumes
The worked example uses a 250,000-tpy OCC containerboard line at the mid-range water intensity of 25 m³/tonne, which gives 6,250 m³/day of new wastewater — added to an existing 40,000 m³/day design flow for a new hydraulic point of 46,250 m³/day (a 16% step-up, consistent with the Nandy 2002 28% increase relative to a smaller base). The new organic load is 6,250 m³/day × 800 mg/L COD = 5,000 kg COD/day, and at a design loading of 0.25 kg COD/m³·day the additional aeration-tank volume is 20,000 m³ — roughly a 50% increase on a 40,000 m³ existing tank.
That 20,000 m³ new volume divided by 6,250 m³/day of new flow gives 3.2 days of HRT, well above the 24–48 hour design window — so the sizing either has to add tankage, drop in a high-MLSS MBR to shrink the volume by half, or accept a conservative design that absorbs shock loads. The Nandy 2002 case study solved the same arithmetic by modifying existing tanks and adding a small polishing loop, achieving 88.8% water-conservation offset without building a parallel plant. Two safety rules should be applied on top: design hydraulic capacity at 120% of calculated peak (Rajshree 20% margin) and dewatering capacity at 150% of average sludge load to absorb 2× peak events.
For a US site with limited footprint, an MBR bioreactor for paper-mill secondary treatment cuts the new aeration-tank volume from 20,000 m³ to roughly 8,000–10,000 m³ at MLSS 8,000 mg/L — trading membrane capex and replacement for civil-works savings.
Sludge and Reject Management: The Hidden 20% of ETP Capex
Under-sizing the sludge line is the most common reason ETP projects overrun their post-commissioning budget. At a 50-tpd OCC mill, the system generates 15–25 t/d of wet primary sludge and 3–6 t/d of wet secondary sludge at 2% solids — these volumes scale linearly with ETP flow (Rajshree, 2024). Dewatering on a belt press or filter press for paper-mill sludge dewatering drops moisture from 97–98% to 65–75% (25–35% cake solids); a automatic chemical dosing system for polymer flocculant is mandatory to hit those cake numbers on a consistent basis. Size dewatering equipment at 150% of calculated load to absorb peak events — the single most common ETP operational crisis in paper mills is an undersized belt press running 24 hours/day with a lagoon breaching its freeboard.
Reuse pathways are favourable for OCC mills. Primary sludge is 40–60% fibre by dry weight and can be returned to the pulper to offset 3–5% of fresh OCC consumption (Rajshree, 2024); dewatered cake can go to cement kiln, brick manufacture, or the mill's biomass boiler. Where RO is installed for water reuse, the reject brine (typically 15–25% of RO feed) needs an evaporation pond or mechanical vapour recompression crystalliser for ZLD. The US regulatory frame is EPA 40 CFR Part 503 for sewage-sludge handling and state-level landfill bans; beneficial reuse under a Permit for Commercial Distribution keeps the cake out of landfill and is the lowest-disposal-cost option for most containerboard mills.
Capex, Opex, and the ZLD ROI Decision
Order-of-magnitude US capex (2026 reference, site and soil conditions swing ±40%) breaks down as follows: primary USD 0.3–0.6 M per 1,000 m³/day, secondary USD 1.0–1.8 M per 1,000 m³/day, tertiary sand/MBR USD 0.4–0.8 M per 1,000 m³/day, and full ZLD (UF + RO + evaporation/crystallisation) USD 2.0–4.0 M per 1,000 m³/day. Opex on a primary + activated sludge + tertiary train runs USD 0.18–0.45 per m³ treated, dominated by aeration electricity at roughly 60% of opex — a 6,250 m³/day line at USD 0.30/m³ is USD 0.68 M/year; ZLD adds USD 0.30–0.60 per m³ for membrane replacement and brine disposal.
Water-reuse economics usually justify the tertiary stage on their own. A 50-tpd mill at 25,000 m³/day consuming process water at USD 1.5–3.0 per m³ saves USD 1.1–2.2 M/year at 70% recovery, and tertiary capex (excluding ZLD) typically pays back in 2–4 years at US industrial water tariffs. The 88.8% offset documented at Nandy 2002 translates to a 2026 US dollar value in the same order of magnitude once fresh-water and wastewater-discharge tariffs are netted. An industrial RO system for paper-mill water reuse with a chlorine dioxide generator for RO feed disinfection is the standard polish-and-reuse train.
Decision rule: mandate full ZLD only where the discharge watershed is impaired or a state-level zero-discharge regulation applies (parts of the Colorado River basin, the Apalachicola–Chattahoochee–Flint basin, and portions of central California); otherwise target 70–85% reuse and run RO only on the polished sidestream, with the RO concentrate routed to an evaporation pond or, for a higher capex, a crystalliser. Secondary-clarifier overflow can be discharged under the 40 CFR 430 BAT mass limits without an RO polish if the receiving stream has adequate capacity and the mass-loading arithmetic closes.
| Scenario | Capex (USD per 1,000 m³/day) | Opex (USD per m³) | Water-recovery | Payback (US tariffs) |
|---|---|---|---|---|
| Primary + ASP only | 1.3–2.4 M | 0.10–0.18 | 0% (discharge) | Compliance-driven |
| Primary + ASP + sand filter | 1.7–3.2 M | 0.18–0.30 | 20–40% reuse | 4–6 years |
| Primary + ASP + MBR + RO | 2.5–4.5 M | 0.35–0.55 | 70–85% reuse | 2–4 years |
| Full ZLD (UF + RO + evap/crystalliser) | 4.5–8.5 M | 0.65–1.05 | 95–99% reuse | 5–8 years (regulatory-driven) |
Frequently Asked Questions
How much wastewater does a paper mill produce per tonne of paper?
Paper mills generate 15–40 m³ of wastewater per tonne of product (Rajshree, 2024). OCC containerboard lines sit at the low end of that range — 10–25 m³/tonne — because of high water-loop closure and low process-water intensity; virgin integrated kraft mills sit at the high end — 30–60 m³/tonne — because pulping, bleaching, and chemical recovery each add a water stream.
What are the EPA discharge limits for a containerboard paper mill?
EPA 40 CFR Part 430 Subpart B (Board and Paper Mills — Paperboard from Wastepaper) sets BAT effluent limits at BOD 0.31 lb per 1,000 lb of product and TSS 0.41 lb per 1,000 lb of product, expressed as mass-per-product on a 24-hour average. At 250,000 tpy, that is roughly 35 tpy BOD and 46 tpy TSS, equivalent to a 30 mg/L BOD and 40 mg/L TSS concentration target on the final effluent at design flow.
Can a paper-mill ETP be expanded in place, or does it need a new plant?
Yes — the Nandy 2002 case study documented an in-place upgrade of an existing 51,000 m³/day ETP to absorb a 14,500 m³/day step-up from a 120,000-tpy capacity addition, with 28,500 m³/day of fresh water conserved (an 88.8% offset) by recycling biologically treated and polished effluent into the paper machine. In-place upgrades are preferred where existing tankage has hydraulic reserve and the influent envelope matches the new furnish.
What is the difference between an MBR and a conventional activated-sludge stage for paper-mill wastewater?
An MBR (membrane bioreactor) replaces the secondary clarifier with submerged PVDF membranes at 0.1–0.2 μm, runs at MLSS 6,000–10,000 mg/L (vs. 2,000–4,000 mg/L conventional), and produces an effluent of <1 mg/L TSS with COD typically 30–60 mg/L below a conventional 80–180 mg/L secondary effluent. The footprint is 50–60% smaller for the same BOD load, capex is roughly 30–50% higher, and membrane replacement runs 10–15% of opex — economics that close when site footprint is constrained or effluent quality must meet a tight reuse spec.
Is ZLD required for a US paper mill in 2026?
ZLD is not a federal requirement in the US; it is state-specific and applies primarily where the receiving watershed is impaired, where a basin-level zero-discharge compact is in force, or where a state-level permit has been negotiated (parts of the Colorado River basin, ACF basin, and selected California regions). In water-stressed regions the economics often justify voluntary ZLD: a 25,000 m³/day mill at 70% recovery saves USD 1.1–2.2 M/year on process-water and discharge costs, and capex pays back in 2–4 years at US industrial water tariffs even without a regulatory mandate.