Why Biodiesel Wastewater Sludge Is Unusually Hard to Treat
Biodiesel sludge behaves like a colloid, not a biosolid: a 100 t/day FAME plant typically generates 8–15 t/day of wet sludge at 2–4% DS, and that cake binds water so tightly that generic municipal dewatering specifications (12–18% polymer dose ranges, 25–30% cake dryness) fail by 30–40% on the first run. Three waste streams converge in a transesterification plant, and each one makes the downstream sludge worse: a glycerol phase from the decanter bottom (30–60% glycerol, 5–10% methanol, plus entrained soap), wash water that carries residual fatty acids and methanol, and spent catalyst liquor that swings between NaOH/KOH (pH 12–14) and H₂SO₄ (pH 1–3) depending on whether the upstream process is esterification or transesterification. The 2015 Coagulation and Flocculation study (Top 3) measured biodiesel wastewater at 2,000–10,000 mg/L TSS and 2,000–8,000 Pt-Co color units — an organic load that, combined with glycerol, produces a gelatinous floc structure rather than the granular floc you get from municipal biosolids.
The mechanism behind the bad cake is straightforward: glycerol is hygroscopic and holds water in the floc matrix, while saponified fatty acids form a soap film that encapsulates suspended solids and blocks the filter cloth. Methanol residue above 200 mg/L in the sludge stream polymerizes polymer bridging and forces operators to over-dose cationic polyacrylamide (CPAM) by 40–60% to achieve even partial flocculation. Catalyst contamination adds a second failure mode: residual NaOH raises the pH past 12 and dissolves aluminum and iron hydroxide flocs, while residual H₂SO₄ corrodes filter cloth and shortens belt press cloth life to 3–6 months. Two-stage pH adjustment to 6.5–8.5 before any biological or dewatering step is mandatory; single-stage neutralization leaves pH swings of ±2 units that destroy biological activity and overwhelm filter press cloths.
Biodiesel Wastewater Characterization: What You're Actually Dewatering
Influent characterization drives every equipment decision downstream, and biodiesel wastewater is one of the most variable industrial streams a process engineer will encounter. Raw wastewater from a transesterification plant typically measures COD 15,000–50,000 mg/L, BOD₅ 8,000–25,000 mg/L, oil & grease 5,000–25,000 mg/L, TSS 2,000–10,000 mg/L, methanol 500–5,000 mg/L, and glycerol 2,000–15,000 mg/L, with pH swinging between 1 and 14 depending on which process stream is bleeding into the equalization tank. Sludge yield follows a rule of thumb of 0.08–0.15 kg DS per kg of biodiesel produced; for a 100 t/day plant, that translates to 1.6–3.0 t DS/day, or 8–15 t/day wet sludge at 2–4% DS entering the dewatering step.
| Parameter | Raw Biodiesel Wastewater | EU 91/271/EEC (small plants) | US EPA 40 CFR 60 Subpart VV | China GB 8978-1996 Class 1 |
|---|---|---|---|---|
| COD | 15,000–50,000 mg/L | ≤125 mg/L | BPT/BAT limits per subcategory | ≤100 mg/L |
| BOD₅ | 8,000–25,000 mg/L | ≤25 mg/L | Subcategory-specific | ≤30 mg/L |
| Oil & Grease / FOG | 5,000–25,000 mg/L | — | Subcategory-specific | ≤10 mg/L |
| TSS | 2,000–10,000 mg/L | ≤35 mg/L | Subcategory-specific | ≤70 mg/L |
| Methanol | 500–5,000 mg/L | — | Subcategory-specific | — |
| Glycerol | 2,000–15,000 mg/L | — | — | — |
| pH | 1–14 (stream-dependent) | 6–9 | 6–9 | 6–9 |
For water reuse loops, the 2021 nanofiltration study (Top 2) reported 95–99% COD rejection in permeate, but that rejection is only meaningful if TSS and FOG have already been cut below 50 mg/L upstream — a target that drives the equipment train design in the next section. The capacity range and operating envelope of each treatment step are set by the peak values in the table above, not the averages.
The Five-Stage Process Train: From Reactor Discharge to Disposal Cake
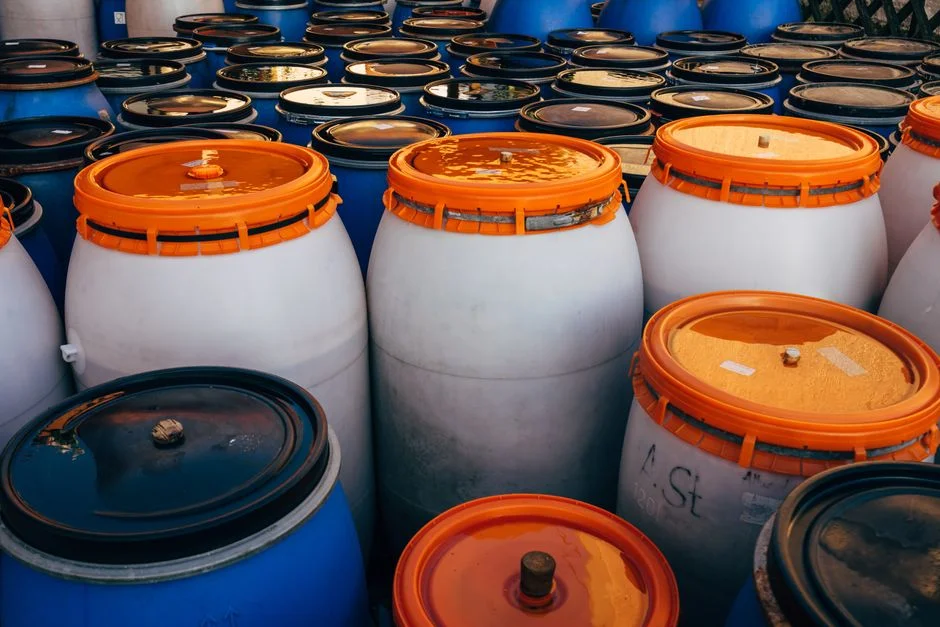
A working biodiesel sludge train runs in five sequential stages, and skipping any one of them produces a cake that either won't dewater or won't pass disposal criteria. Stage 1 is spent catalyst and glycerol separation: a gravity decanter or disk-stack centrifuge recovers crude glycerol at >80% purity from the decanter bottom before the wastewater enters the treatment train — this single step removes 50–70% of the organic load and turns a disposal liability into a saleable byproduct. Stage 2 is pH equalization in a two-compartment tank; the first compartment receives acid and base streams separately, and the second compartment blends them to pH 6.5–8.5 using lime (lowest reagent cost at $0.04–$0.08/kg), NaOH (fastest response), or CO₂ (no salt buildup, best for closed-loop reuse).
Stage 3 is the primary solids removal step: an industrial DAF unit for FOG and TSS removal operating at 4–6 m/h hydraulic loading, 15–25 minute hydraulic residence time, and a 20–40% recycle ratio. DAF reliably removes 85–95% TSS and 70–90% FOG from biodiesel wastewater (Top 3 study data), and the floated scum — typically 3–8% of influent flow — feeds directly to the sludge thickener. Stage 4 is biological treatment: a UASB reactor or SBR handles high-COD streams with >90% BOD removal at 1–3 kg COD/m³·d organic loading, while an MBR system for COD and BOD reduction is the right choice for sites with space limits, variable load, or a water-reuse target. Stage 5 is sludge thickening (gravity or DAF) followed by mechanical dewatering with a plate-and-frame filter press to 35–45% DS before landfill or co-incineration.
DAF vs Lamella vs Centrifuge: Choosing the Right Liquid-Side Solids Removal Step
DAF is the default primary solids removal step for biodiesel wastewater because of FOG loading, but engineers still ask whether a lamella clarifier or a disk-stack centrifuge would work. The honest answer is that each device has a defined niche, and the table below maps them against the three operating parameters that drive selection: oil removal efficiency, footprint, and CAPEX.
| Parameter | DAF (dissolved air flotation) | Lamella clarifier | Disk-stack centrifuge |
|---|---|---|---|
| Footprint | Medium | Small | Tiny |
| CAPEX | $40K–$120K | $25K–$80K | $150K–$400K |
| Oil / FOG removal | 70–90% | 40–60% | 85–95% |
| TSS removal | 85–95% | 60–80% | 90–98% |
| Polymer demand | 2–5 mg/L | 5–15 mg/L | 0–2 mg/L |
| Power consumption | Low | Very low | High (15–40 kW typical) |
| Best fit | FOG-laden streams, default biodiesel plant choice | Polishing step downstream of DAF | Small footprint, high solids, oil recovery |
Lamella clarifiers look attractive on CAPEX but are not a primary FOG removal device — at 40–60% oil removal they leave 4,000–15,000 mg/L FOG in the underflow, which then overwhelms the biological step and the filter press. Lamella works as a polishing step downstream of a DAF in a high-efficiency sedimentation tank arrangement, or as a TSS polisher before MBR. Disk-stack centrifuges deliver the highest oil removal and the smallest footprint, but their CAPEX is 3–4× DAF and OPEX runs $0.08–$0.15/m³ higher in power and maintenance; they earn their place only at sites with severe space limits or when oil recovery is part of the revenue model. Capacity reference: DAF units are available from 4 to 300 m³/h across 13 standard models, which covers every plant size from 20 t/day to 200 t/day biodiesel throughput.
Sludge Dewatering Equipment Compared: Plate Press vs Belt Press vs Decanter Centrifuge
Choosing the dewatering device is the decision that determines cake disposal cost, polymer OPEX, and filter-cloth replacement frequency. Plate-and-frame filter presses deliver the driest cake and the lowest disposal tonnage, but they require a higher CAPEX and a batch operating mode; belt presses offer continuous operation at lower CAPEX but trade off cake dryness; decanter centrifuges sit in the middle on cake dryness and on top on power demand. The table below captures the operating numbers that matter for procurement.
| Parameter | Plate-and-frame filter press | Belt filter press | Decanter centrifuge |
|---|---|---|---|
| Cake dry solids | 35–45% | 22–28% | 25–35% |
| Throughput (solids loading) | 12–20 kg/m²·h | 20–40 kg/m²·h | 50–150 kg/m²·h (scroll-limited) |
| Polymer dose (CPE) | 4–8 kg/t DS | 3–5 kg/t DS | 2–4 kg/t DS |
| Filter cloth life | 12–24 months | 3–6 months (methanol-degraded) | N/A (no cloth) |
| CAPEX | $80K–$350K | $50K–$180K | $200K–$600K |
| Operating mode | Batch (2–4 cycles/h) | Continuous | Continuous |
| Power demand | Low (hydraulic pump) | Low–medium | High (30–90 kW typical) |
For glycerol-rich biodiesel sludge, the plate press wins on cake dryness and disposal-cost reduction despite its higher CAPEX; the 7–13 percentage-point DS advantage over a belt press translates to 25–40% fewer tonnes of cake to haul, which at $30–$80/t disposal cost is the largest single OPEX line in the budget. Belt presses struggle on biodiesel sludge for two reasons: methanol residue degrades the filter cloth and shortens life to 3–6 months, and the open gravity drainage section cannot break through the soap film that encapsulates the floc. Sizing a plate press: filtration area (m²) = daily wet sludge (kg/day) × (1/DS − 1) / 16 hours / cycle time, then add 20% design margin for cake thickness variation. For an 8 t/day wet sludge stream at 3% DS, the calculation gives roughly 12–15 m² of plate area, which maps to a small-to-mid standard press unit. The plate-and-frame filter press product family covers 5–80 m² filtration area across 8 standard sizes.
Polymer Conditioning and Pre-Treatment: The Key to >35% Cake Solids
Overdosing polymer is the number-one cause of sticky, low-DS cake in biodiesel plants, and the fix is a structured jar-test protocol rather than a higher pump setting. For high-organic, neutral-pH biodiesel sludge, cationic polyacrylamide (CPAM) with charge density 60–80% and molecular weight 8–12 MDa delivers the best floc strength; anionic or nonionic polymers are largely ineffective because the sludge surface charge is dominated by soap and fatty acid anions. The typical dose is 4–8 kg CPE per tonne of dry solids — a wide range, which is exactly why jar testing is mandatory and not optional.
The three-step jar test protocol: collect a 200 mL sludge sample, prepare a 0.5–1% CPE stock solution, dose at 0.5–1.0 kg/t increments across six beakers, run 60–120 seconds of slow mix at 50–80 rpm, then 5 minutes of settling. The optimal dose is the lowest concentration that produces a clear supernatant and a compact settled solids volume; overdosing reverses the trend and produces a cloudy supernatant plus a gummy cake. Methanol residue above 200 mg/L in the sludge stream interferes with polymer bridging and inflates dose by 20–30%; pre-aeration in the equalization tank for 4–8 hours, or air-stripping with a packed column, can cut the dose back to the baseline range. An automatic polymer dosing skid with a mag-meter feedback loop holds dose within ±5% of setpoint and prevents the manual-pump drift that drives most overdosing incidents; for context on polymer selection and cost, see the PAC and PAM dosing cost optimization playbook.
Worked Cost Example: 100 t/day FAME Plant CAPEX, OPEX, and Payback
The line-item budget below is for a greenfield 100 t/day FAME plant in a coastal industrial zone with wastewater discharge to a municipal treatment plant. Retrofit cases follow the same proportions but typically run 15–25% lower because equalization and utility tie-ins are reused.
| Line item | CAPEX (USD) | Notes |
|---|---|---|
| DAF unit (25 m³/h) | $80K | Primary FOG and TSS removal |
| Equalization / pH-adjust tank | $30K | Two-compartment FRP or coated CS |
| MBR system (biological step) | $180K | COD & BOD reduction to discharge limits |
| Sludge thickener | $40K | Gravity or DAF-thickened to 4–6% DS |
| Plate-and-frame filter press (15 m²) | $220K | Cake target 35–45% DS |
| Automatic polymer dosing skid | $25K | CPAM preparation and dosing |
| Installation, piping, commissioning | $50K | 15% of equipment CAPEX typical |
| Total CAPEX | $625K | Range $400K–$900K depending on automation and reuse loop |
OPEX lines scale with throughput: polymer $0.08–$0.15 per kg of biodiesel produced (4–8 kg CPE/t DS at current CPAM prices), electricity $0.04–$0.08/m³ for aeration and pumps, labor $0.02–$0.04/m³ for one operator-hour per shift, and sludge disposal $15–$40/t wet cake depending on whether the route is landfill or co-incineration. Revenue offsets: recovered crude glycerol sells for $80–$200/t, and disposal-cost avoidance at $30–$80/t wet cake is real money once the cake tonnage is cut by a drier press. Typical payback runs 18–28 months for greenfield plants; retrofit projects that replace a failed digester or an under-performing belt press typically pay back in 12–20 months because the disposal-cost delta alone covers the press upgrade. For a parallel benchmark on a different food-and-fuel sludge stream, the starch wastewater sludge treatment process guide uses the same five-stage template. If your effluent is failing the TSS limit after the biological step, the effluent TSS exceedance troubleshooting guide walks through the diagnostic sequence.
Compliance and Sludge Disposal Routes in 2026
Effluent compliance in 2026 still maps to the same four regulatory anchors: EU Urban Waste Water Directive 91/271/EEC (COD ≤125 mg/L, SS ≤35 mg/L for plants <10,000 PE), US EPA 40 CFR Part 60 Subpart VV (BPT/BAT limits subcategory-specific), China GB 8978-1996 Class 1 (COD ≤100 mg/L, SS ≤70 mg/L, oil ≤10 mg/L), and India CPCB Schedule VI. Sludge disposal routes, ranked by 2026 economics and regulatory pressure, are: co-incineration in a cement kiln (most favorable, no pre-drying required above 35% DS), anaerobic digestion to biogas (preferred when the plant has a heat sink and the digester can handle the soap load), licensed hazardous landfill (default for non-hazardous cake, but the 2026 EU Landfill Directive 1999/31/EC amendments are tightening biodegradable waste acceptance, and biodiesel cake may need pre-drying to >45% DS for some member states), and land application (rarely allowed because of heavy metals from catalyst residue and residual methanol).
Frequently Asked Questions
What polymer dose do I need to hit 35% cake solids in a biodiesel plant?
You should dose 4–8 kg of cationic polyacrylamide (60–80% charge density) per tonne of dry solids, then confirm with a six-beaker jar test at 0.5 kg/t increments. The dose inflates by 20–30% if methanol residue in the sludge exceeds 200 mg/L; an automatic polymer dosing skid holds the setpoint within ±5% and prevents the manual drift that causes most overdosing incidents.
DAF or lamella — which one handles 10,000 mg/L FOG?
You should select DAF for any stream above 1,000 mg/L FOG; lamella clarifiers max out at 40–60% oil removal and leave 4,000–15,000 mg/L FOG in the underflow, which then kills the biological step. An industrial DAF unit for FOG and TSS removal at 4–6 m/h hydraulic loading and 20–40% recycle ratio delivers 70–90% FOG removal in a single pass.
How do I size a plate-and-frame filter press for an 8 t/day wet sludge stream?
You should calculate filtration area as daily wet sludge × (1/DS − 1) / 16 hours / cycle time, then add 20% design margin. For 8 t/day at 3% DS, this gives 12–15 m² of plate area, which maps to a mid-size plate-and-frame filter press in the 15 m² configuration.
What CAPEX should I budget for a 100 t/day FAME plant wastewater train?
You should budget $625K for a complete five-stage train (DAF, equalization, MBR, thickener, plate press, dosing) with a realistic range of $400K–$900K depending on automation level and whether a water-reuse loop is included; typical payback runs 18–28 months greenfield and 12–20 months on retrofit.