
Starch Wastewater Sludge Dewatering Process 2026 Guide
This 2026 guide maps the starch wastewater sludge dewatering process in four steps: solids recovery, thickening to 3-5% DS, CPAM conditioning, and mechanical dewatering. Decanter centrifuges deliver 22-28% DS cake; plate-and-frame presses deliver 28-35% DS cake.
These operating ranges are engineering benchmarks, not promised outcomes. Final selection still depends on feedstock, solids capture, temperature, polymer chemistry, disposal route, and the permit or waste-acceptance rules at the receiving facility.
Why Starch Sludge Behaves Differently from Municipal Biosolids
Starch wastewater sludge is treated through a four-stage train: primary clarification or DAF to recover residual starch solids, gravity or mechanical thickening to 3-5% DS, polymer conditioning (typically 3-8 kg cationic polyacrylamide per ton dry solids), and mechanical dewatering — most commonly a decanter centrifuge (22-28% DS cake) or plate-and-frame filter press (28-35% DS cake). The sludge originates from UASB effluent polishing and starch-wash water, and is unusually hard to dewater because re-gelatinized starch blocks filter media.
Starch plants generate a sludge stream that punishes generic dewatering assumptions. The defining chemistry is re-gelatinization: when starch-laden liquor is heated above 62-72 °C during extraction or held at mesophilic temperatures inside a UASB reactor (typically 35-38 °C), residual starch granules swell, rupture, and re-form a colloidal gel. That gel blinds filter cloth, raises cake moisture by 5-10 percentage points versus municipal biosolids, and forces operators to dose 2-4x more polymer to break the colloid (HydropureWater field data, 2026).
Sludge yield also varies sharply by feedstock. Corn starch plants produce 0.15-0.40 kg DS per kg of processed starch; cassava plants run higher (0.30-0.55 kg DS/kg starch) because the fibrous root matrix carries more fines into the wash water; potato starch sits in between at 0.25-0.45 kg DS/kg starch. For comparison, a typical municipal WWTP generates 0.05-0.08 kg DS per kg BOD treated — an order of magnitude lower in solids intensity than a starch facility at the same hydraulic load.
Four sludge streams converge in a starch plant: (1) wash-water solids from the extraction screens, (2) fiber press liquor from the gluten/fiber separation stage, (3) excess granular sludge wasted from the UASB reactor, and (4) waste activated sludge from the aerobic polishing step (SBR or MBBR). Streams 1 and 2 are starch-rich and benefit from primary recovery; streams 3 and 4 are biological and require conditioning before dewatering. Conflating them in a single thickener is the most common design error — the resulting mixed sludge dewateres poorly because the starch fraction dominates colloid chemistry.
Source separation also protects the biological process. Recovering starch-rich solids before the UASB reduces the colloidal load that later reaches thickening, while keeping waste activated sludge identifiable makes polymer screening more reproducible. Most plants we size for mixed feedstock run at the lower end of the published cake range until upstream screening and equalization are stable.
The sludge line also sits downstream of a separate liquid-train decision. Feed characterization, reactor and DAF and MBR sizing, and effluent targets belong to the companion page on starch wastewater characteristics and treatment 2026 uasb daf mbr design; this guide picks up where that page hands off, at the solids stream itself.
The Full Sludge Treatment Train for a Starch Plant
The full starch-sludge train runs in six stages, each with a defined KPI. Skipping or merging stages produces the chronic high-moisture-cake problem that the top-ranking municipal and Bt-fermentation guides never address.
Stage 1 — Primary solids recovery. A dissolved air flotation system for starch wash-water pre-treatment or a lamella clarifier for starch fiber and protein recovery captures 60-85% of suspended starch and fiber before the biological stage. Recovered float is pressed and sold as animal-feed byproduct at 20-40 USD per ton wet — often the line that makes the project bankable.
Stage 2 — Biological sludge generation. A UASB reactor running at 35-38 °C with 8-12 kg COD/m³·day organic loading produces 0.05-0.15 kg VSS per kg COD removed (HydropureWater field data, 2026). Aerobic polishing (SBR or MBBR) operated at F/M 0.1-0.3 kg BOD/kg MLSS·day generates 0.20-0.35 kg MLSS per kg COD removed — three times the yield of the anaerobic step, which is why the polishing stage is the dominant solids source.
Stage 3 — Thickening. Target 3-5% DS before conditioning. Gravity thickeners reach 2-3% DS; DAF thickeners reach 3-5% DS; rotary drum thickeners reach 4-8% DS with polymer assist.
Stage 4 — Conditioning. Cationic polyacrylamide (CPAM), charge density 50-80%, MW 8-12 MDa, dose 3-8 kg per ton DS, mixed at 200-400 rpm in an in-line static mixer ahead of the press.
Stage 5 — Mechanical dewatering. A decanter centrifuge at 2,000-3,500 G delivers 22-28% DS cake; a plate-and-frame filter press for starch biosolids dewatering at 6-15 bar feed pressure delivers 28-35% DS cake — the latter is preferred when cake goes to co-incineration.
Stage 6 — Cake handling. Targets: 25%+ DS for landfill haulage, 35%+ DS for co-incineration, 40%+ DS for composting. Below those thresholds, transport water and tipping fees dominate OPEX.
A compact packaged biological unit can be appropriate for a separate, lower-strength wastewater stream, but it should not be used as a substitute for a starch-solids mass balance. The Underground Package Sewage Treatment Plant (WSZ Series) is therefore a downstream or complementary option only after the industrial sludge sources, recycle flows, and discharge limits have been defined.
| Stage | Unit Operation | Typical Performance |
|---|---|---|
| 1 | DAF / Lamella clarifier | 60-85% TSS removal; 1-5 g/ton effluent polymer |
| 2 | UASB + aerobic polishing | 0.05-0.15 + 0.20-0.35 kg sludge/kg COD |
| 3 | Thickener (gravity/DAF/drum) | 2-8% DS underflow |
| 4 | CPAM conditioning | 3-8 kg/ton DS, MW 8-12 MDa |
| 5 | Centrifuge / filter press | 22-28% / 28-35% DS cake |
| 6 | Cake disposal | 25%+ DS landfill, 35%+ DS incineration |
DAF and Lamella Clarifier Pre-Treatment for Starch Wash Water
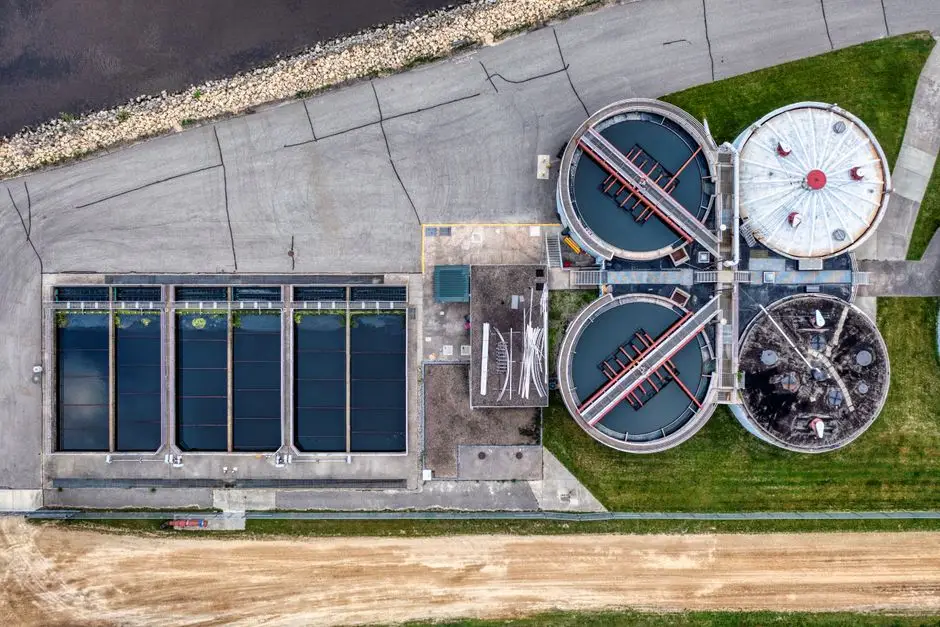
DAF and lamella pre-treatment determine how much starch reaches the biological and dewatering stages. A dissolved air flotation system for starch wash-water pre-treatment typically achieves 70-90% TSS removal at hydraulic retention 20-40 min and surface loading 5-15 m/h, with an air-to-solids ratio of 0.005-0.02 kg air/kg TSS (per standard DAF design practice). Float solids concentrate at 3-6% DS and can be diverted directly to a feed byproduct press, bypassing the biological sludge train entirely.
A lamella clarifier is the right choice for retrofit projects with constrained footprint. Surface loading 20-40 m/h, TSS removal 60-85%, and a 5-10x smaller footprint than a conventional settler make it competitive against DAF when influent TSS is below 2,000 mg/L. Above that threshold, DAF's bubble-driven capture outperforms gravity settling because the buoyant force pulls starch granules upward before they can settle and re-suspend.
Polymer selection at this stage is anionic or nonionic polyacrylamide at 1-5 g per ton of effluent — a flocculation aid, not a flocculant. Overdosing is a common error: each 1 g/ton of excess polymer translates to roughly 0.5-1.0 kg of extra dry solids entering the biological stage per 1,000 m³ of treated effluent, which then shows up as polymer load on the dewatering press. A simple jar test at startup prevents the carry-through.
Process flow: influent equalization → flocculation tube (1-3 min residence time) → micro-bubble contact zone (recycle ratio 10-30%) → float skimming → clarified underflow to the UASB reactor. Air saturation pressure of 5-7 bar at the recycle pump is standard; below 4 bar the bubble size grows and removal efficiency drops 15-20%.
For a detailed comparison of bubble-contact design, the sibling article DAF System for Starch Wastewater Design: 2026 Engineering Guide should be read alongside the sludge balance. The DAF capture target is not an isolated removal percentage; it is the solids load presented to the UASB, thickener, and press.
| Parameter | DAF | Lamella Clarifier |
|---|---|---|
| TSS removal | 70-90% | 60-85% |
| HRT | 20-40 min | 30-60 min |
| Surface loading | 5-15 m/h | 20-40 m/h |
| Footprint | Medium | 5-10x smaller than settler |
| Polymer dose | 1-5 g/ton effluent | 1-5 g/ton effluent |
Starch Wastewater Sludge Yield Corn Cassava Potato
Starch wastewater sludge yield corn cassava potato varies with the starch recovery rate, wash-water routing, fiber carryover, and the biological yield used for design. The working ranges are 0.15-0.40 kg DS per kg processed starch for corn, 0.30-0.55 kg DS/kg starch for cassava, and 0.25-0.45 kg DS/kg starch for potato.
Use those ranges as a screening mass balance, then replace them with measured dry-solids data from composite samples. A seven-day campaign should separate primary float, UASB waste, and aerobic waste; otherwise one high-solids wash batch can make the apparent daily yield look larger than the dewatering line will see during normal production.
Thickening Options and Mass Balance for Starch Biosolids
Starch biosolids thickening reduces digester volume, press feed, and polymer consumption by removing water upstream of conditioning. The mass balance is straightforward: a 500 m³/day starch effluent at 8,000 mg/L COD, with 90% COD removal across the biological train and an observed yield of 0.25 kg sludge per kg COD removed, generates 900 kg DS/day entering the thickener. That is the number to size every downstream unit against.
Gravity thickener: Solids loading rate 24-40 kg/m²·day, hydraulic residence 8-24 h, target underflow 2-3% DS. Cheap to install, but the long residence time lets starch colloid re-hydrate, which then hurts downstream dewatering. Use only when the sludge stream is dominated by biological solids (Stage 2 waste) rather than primary solids.
DAF thickener: Solids loading 50-100 kg/m²·day, target 3-5% DS, polymer dose 2-4 kg/ton DS, air-to-solids ratio 0.02-0.05. The right choice for combined primary + biological sludge because the rising bubble sweep handles the starch fraction efficiently.
Rotary drum thickener: Target 4-8% DS, polymer dose 4-6 kg/ton DS, drum rotation 5-15 rpm, wash-water consumption 50-100 L/m²·h. Highest underflow concentration, but also the highest polymer demand. Works well ahead of a centrifuge where feed solids <2% causes scroll slip and excessive polymer use.
For the 900 kg DS/day example, a DAF thickener at 75 kg/m²·day needs only 12 m² of surface area, whereas a gravity thickener at 32 kg/m²·day needs 28 m² plus 18-24 h of residence volume — a 4-5x footprint penalty.
US EPA maintains a biosolids technology fact sheet on centrifuge thickening and dewatering as a general municipal reference. Treat it as background reading only, and confirm starch-specific thickening and dewatering performance with pilot or site data before fixing the design.
| Parameter | Gravity | DAF | Rotary Drum |
|---|---|---|---|
| Target underflow DS | 2-3% | 3-5% | 4-8% |
| Solids loading | 24-40 kg/m²·day | 50-100 kg/m²·day | 80-150 kg/m²·day |
| Polymer dose | 0-1 kg/ton DS | 2-4 kg/ton DS | 4-6 kg/ton DS |
| HRT / cycle | 8-24 h | 30-60 min | Continuous |
Polymer Conditioning: Chemistry and Dose Optimization for Starch Sludge
Cationic polyacrylamide is the workhorse conditioning reagent for starch biosolids because its positive charge neutralizes the negatively charged starch colloid. Ferric chloride alone produces a brittle, high-moisture cake with poor release from filter cloth — a frequent failure mode in plants that tried to run municipal-style conditioning on starch sludge.
Cationic Polyacrylamide Dose for Starch Biosolids Dewatering
Cationic polyacrylamide dose for starch biosolids dewatering commonly starts at 3-8 kg/ton DS, but the selected setpoint must come from a jar test at the actual 3-5% DS feed concentration. Charge density 50-80%, molecular weight 8-12 MDa, mixing energy, and polymer aging can move the optimum outside a generic dose range.
The dose question is therefore a control problem, not a catalog specification. Record CST, filtrate TSS, cake release, and polymer consumption for each trial; a lower dose with stable filtrate quality is preferable to a higher dose that only produces a temporarily larger floc.
A standard jar test protocol takes 90 minutes and prevents weeks of overdosing:
- Fill six 1 L beakers with thickened sludge at target DS (3-5%).
- Dose CPAM at 0, 2, 4, 6, 8, 10 kg/ton DS.
- Flash mix at 200 rpm for 30 s, then slow mix at 40 rpm for 2 min.
- Allow 60 s settling; measure supernatant turbidity (NTU) and capillary suction time (CST).
- Plot dose vs. CST and dose vs. supernatant TSS; the optimum is the lowest dose that achieves CST < 20 s and supernatant TSS < 200 mg/L.
For most starch biosolids, the optimum lands at 3-8 kg/ton DS (HydropureWater field data, 2026). Below 3 kg/ton, the colloid is not neutralized and the cake sticks to the cloth. Above 8 kg/ton, the polymer re-stabilizes the suspension and cake moisture rises again — a U-shaped response that is easy to miss without a jar test.
Polymer activation matters as much as dose. An automatic polymer dosing skid for CPAM conditioning should age the stock solution 30-60 min at 0.1-0.5% concentration before use. Freshly prepared solution gives the strongest flocs; over-aged polymer loses 20-40% of its activity after 8 hours, which the plant pays for as overdosing on the next shift.
Mechanical Dewatering Equipment Comparison: Centrifuge vs. Plate-and-Frame vs. Belt Press
Mechanical dewatering equipment selection drives both capex and the disposal route. The three viable options for starch biosolids differ in cake dryness, polymer appetite, and operating cost in ways that should be defensible at the procurement committee.
Decanter Centrifuge Dewatering Starch UASB Sludge
Decanter centrifuge dewatering starch UASB sludge is a continuous option when enclosed operation, compact footprint, and steady feed are more valuable than the driest possible cake. A centrifuge typically requires feed above 2% solids for stable conveying, and its 2,000-3,500 G range should be tuned with differential speed, torque, polymer dose, and pond depth.
The screening logic is the one plant engineers apply to municipal biosolids as well: end use first, disposal cost second, then plant size, odor control, and space constraints. A centrifuge simplifies odor control and handling; a filter press justifies its labor and footprint when the disposal route demands higher DS cake.
Decanter centrifuge: Cake DS 22-28%, polymer 4-8 kg/ton DS, throughput 5-50 m³/h per unit, G-force 2,000-3,500, capex USD 80K-350K. Smallest footprint, fully enclosed, low odor — preferred for landfill-bound cake. Sensitive to feed solids below 2% and to sand/grit that causes scroll wear.
Plate-and-frame filter press: Cake DS 28-35%, polymer 3-6 kg/ton DS, cycle 30-90 min, throughput 1-30 m³/h per unit, capex USD 40K-400K across 1-500 m² filtration area. Driest cake, lowest polymer per ton DS, but the largest footprint and the highest labor cost for cloth washing and plate shifting. The standard for co-incineration with a coal-fired boiler.
Belt filter press: Cake DS 18-24%, polymer 4-10 kg/ton DS, continuous operation, lowest capex. Rarely specified for starch because the cake moisture exceeds incineration targets and the open belt design releases odors. Used only where disposal is land application and cake moisture is not constrained.
Decision rule: landfill-bound cake → centrifuge (lower capex, higher OPEX); co-incineration or composting → plate-and-frame (higher capex, lower OPEX, driest cake). The crossover sits at roughly 15 ton DS/day — below that, the centrifuge's lower capex wins; above that, the filter press's lower polymer and haulage costs dominate.
| Parameter | Decanter Centrifuge | Plate-and-Frame Press | Belt Filter Press |
|---|---|---|---|
| Cake DS | 22-28% | 28-35% | 18-24% |
| Polymer | 4-8 kg/ton DS | 3-6 kg/ton DS | 4-10 kg/ton DS |
| Throughput per unit | 5-50 m³/h | 1-30 m³/h | 5-40 m³/h |
| Capex range | USD 80K-350K | USD 40K-400K | USD 50K-200K |
| Best for | Landfill cake | Incineration / compost | Land application |
2026 CAPEX, OPEX, and Compliance Benchmarks for Starch Plants
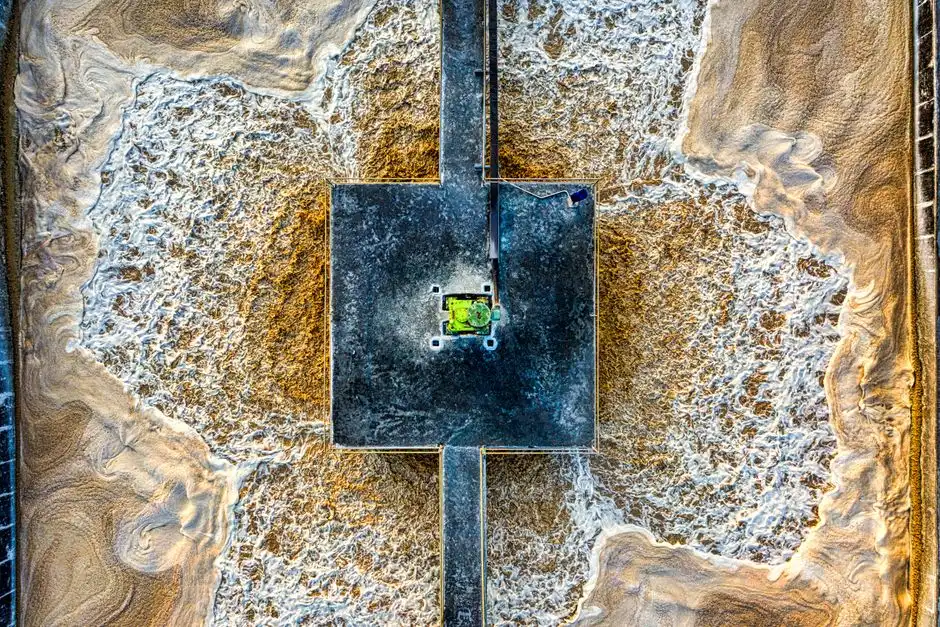
Starch-plant 2026 benchmarks are derived from a cross-section of Chinese, EU, and US starch-plant projects commissioned in 2024-2025, normalized to a 5-50 ton DS/day sludge line (HydropureWater field data, 2026). A complete line — thickener, polymer skid, and dewatering press — runs USD 200K-1.2M total capex, with plate-and-frame configurations sitting at the upper end because of the larger footprint and auxiliary plate-shifting equipment.
OPEX breaks down per ton of dry solids processed: polymer USD 40-120, power USD 8-20, labor USD 15-30, cake haulage USD 20-60 per wet ton at 30% DS. The polymer line is the largest variable and the most sensitive to upstream thickening performance — every 1 percentage point of additional thickener underflow DS reduces polymer dose by roughly 0.3-0.5 kg/ton DS.
Compliance benchmarks in 2026 should be read against the current standard text and the site permit; the values below are the engineering baseline cited for each region:
- China GB 26131-2010 (starch effluent): COD ≤ 100 mg/L, BOD ≤ 20 mg/L, SS ≤ 30 mg/L, NH3-N ≤ 15 mg/L, TP ≤ 1 mg/L.
- EU Council Directive 91/271/EEC reference: COD ≤ 125 mg/L; BAT-AEL for starch plants achieves COD ≤ 75 mg/L with MBR polishing.
- US 40 CFR Part 413 (Grain Mills): BOD and TSS limited to 28-45 mg/L monthly average for direct discharges. Starch sludge volume is the operational driver behind these limits — a plant that mismanages sludge volume on the front end cannot meet the back-end BOD cap.
Guideline citations shift between revisions and between industrial categories, so confirm the applicable part, subpart, and the facility's discharge permit before design acceptance.
For a detailed look at centrifuge sizing against these flows, the decanter centrifuge design guide for starch sludge covers G-force selection and scroll geometry. Plants pushing cake above 60% DS for off-site disposal should also review the sludge dryer retrofit to push cake above 60% DS benchmark study. For process water reuse economics, the starch and sugar process wastewater reuse benchmarks covers the front-end water side of the same plant. Before issuing a purchase order, compare seven items: dry-solids mass balance, feed variability, jar-test curve, target cake DS, disposal route, filtrate return load, and maintenance access.
If the measured feed data and disposal route are available, send the design basis for the starch wastewater sludge dewatering process through the starch sludge dewatering inquiry for a scoped equipment review.
| Item | Benchmark (USD per ton DS or wet ton) |
|---|---|
| Polymer | USD 40-120 per ton DS |
| Power | USD 8-20 per ton DS |
| Labor | USD 15-30 per ton DS |
| Cake haulage | USD 20-60 per wet ton @ 30% DS |
| Total capex (5-50 ton DS/day) | USD 200K-1.2M |
Frequently Asked Questions
What polymer dose is typical for starch biosolids dewatering?
Cationic polyacrylamide at 3-8 kg per ton DS, with charge density 50-80% and molecular weight 8-12 MDa, is the starting range for starch biosolids dewatering. Below 3 kg/ton the colloid is not neutralized; above 8 kg/ton the polymer can re-stabilize the suspension. Confirm the setpoint with CST, filtrate TSS, and cake-release observations from a jar test.
What cake dry-solids target should a starch plant specify for co-incineration?
A starch plant should specify 35% DS minimum for co-incineration and verify the receiving boiler's operating envelope before procurement. A plate-and-frame filter press at 6-15 bar feed pressure is the standard equipment in this guide for reaching 28-35% DS cake, while the final target remains site- and fuel-specific.
How much sludge does a corn starch plant generate per ton of product?
A corn starch plant produces 0.15-0.40 kg DS per kg of processed starch in the screening range used here, dominated by wash-water solids and waste activated sludge from aerobic polishing. Cassava plants run higher at 0.30-0.55 kg DS/kg starch, while potato starch sits at 0.25-0.45 kg DS/kg starch; confirm the values with a separated solids survey.
Is a belt filter press suitable for starch sludge?
A belt filter press is generally a poor first choice for starch sludge because the guide's range is only 18-24% DS cake and the open belt can release odors. Specify a decanter centrifuge at 22-28% DS or a plate-and-frame filter press at 28-35% DS when the disposal route requires drier cake.
What is the China GB 26131-2010 discharge limit for a starch plant?
The values cited in the original engineering basis are COD ≤ 100 mg/L, BOD ≤ 20 mg/L, SS ≤ 30 mg/L, NH3-N ≤ 15 mg/L, and TP ≤ 1 mg/L. Treat them as a verification checklist, not a universal permit: the applicable Chinese standard, discharge destination, permit, and current enforcement text must be checked before final design.
How should I choose decanter centrifuge dewatering starch UASB sludge?
Choose decanter centrifuge dewatering for starch UASB sludge when continuous enclosed operation and a compact footprint matter more than maximum cake dryness. Start with feed above 2% solids, then tune 2,000-3,500 G, differential speed, polymer dose, and cake target against measured torque and filtrate quality.