Why Starch Wastewater Needs a Dedicated Biological Train
Starch processing wastewater — from corn, cassava, and potato/tapioca lines — arrives at the treatment plant with COD of 6,000–12,000 mg/L, BOD/COD ratios of 0.45–0.65, TSS of 2,500–5,000 mg/L, and pH of 4.0–6.5 from upstream fermentation residues (WIT Press 2008, A Study on the Starch and Cellulose Industries' Wastewater Treatment: "a high level of COD and turbidity"). Total nitrogen is unusually low at 40–120 mg/L, giving a C:N ratio near 60:1 that drives intentional N supplementation downstream. Compare this with municipal sewage at COD 250–500 mg/L, and the case for a staged biological train is immediate: a single activated-sludge tank cannot remove >90% of COD from an 8,000 mg/L feed without massive reactor volume, and conventional activated sludge fails above 1% SS or under shock loading (Biological Wastewater Treatment, GRD Press). The 2026 design challenge is the campaign cycle — 4–8 weeks of production at 2× design flow followed by low-load standby — which makes load-equalisation and a high-rate anaerobic stage non-negotiable.
The Three-Stage Biological Treatment Flow
A purpose-built starch wastewater biological treatment process is a three-stage train: pretreatment (rotary bar screen + DAF pretreatment unit) → high-rate anaerobic digestion (UASB or IC reactor) → aerobic polishing (SBR, MBBR, or MBR) → ClO₂ disinfection. The handoff values tell the whole story: raw influent 6,000–12,000 mg/L COD and 2,500–5,000 mg/L TSS enters the DAF; the DAF effluent drops to TSS under 200 mg/L with pH corrected to 6.8–7.2; the anaerobic reactor removes 80–90% of COD at HRT 6–12 h and OLR 8–15 kg COD/m³·d, producing biogas of 65–72% CH₄ and 28–35% CO₂ via the hydrolysis → acidogenesis → methanogenesis pathway (Nov 2022 critical review, Smart Modelling of Sustainable Biological Wastewater Treatment Technologies); the aerobic polish trims residual COD below 150 mg/L and TSS below 30 mg/L; the rotary bar screen headworks protects pumps and DAF nozzles from fibrous bagasse, cassava peel, and potato pulp that would otherwise blind the system. MBR effluent routinely drops below 50 mg/L COD and 5 mg/L TSS, which is the 2026 default for plants targeting water reuse without tertiary RO.
| Stage | Unit Operation | COD (mg/L) | TSS (mg/L) | Key Output |
|---|---|---|---|---|
| Raw influent | — | 6,000–12,000 | 2,500–5,000 | Screened to 3–5 mm |
| Stage 1 — Pretreatment | DAF (air-to-solids 0.005–0.015) | 5,500–11,000 | ≤200 | Skimmings to sludge press |
| Stage 2 — Anaerobic | UASB or IC | 550–1,800 | ≤150 | 0.35–0.45 m³ biogas/kg COD |
| Stage 3 — Aerobic | SBR / MBBR / MBR | ≤150 (≤50 MBR) | ≤30 (≤5 MBR) | Disinfected reuse or discharge |
Pretreatment: Removing Suspended Starch Before Biology
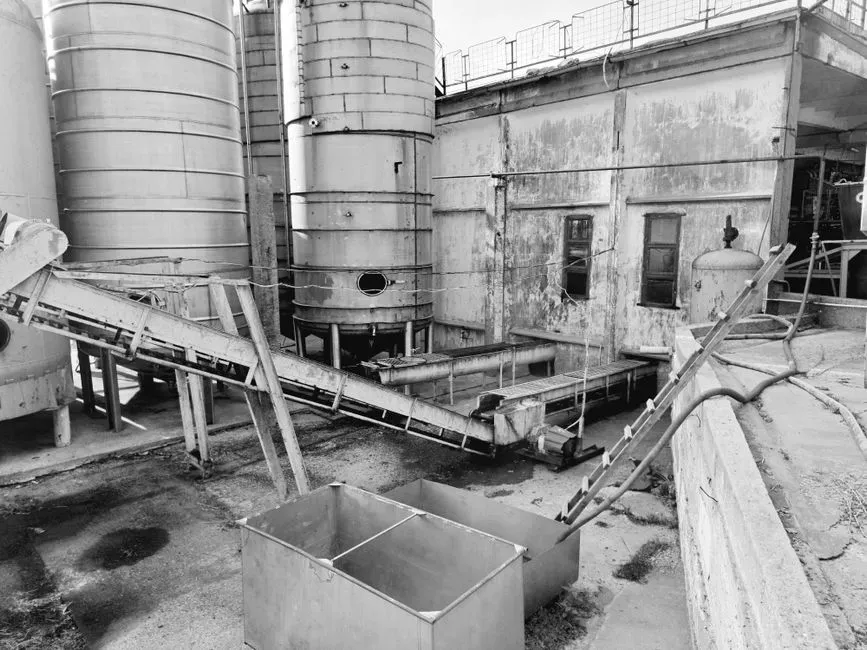
The DAF is the workhorse of front-end starch wastewater pretreatment because raw starch slurry has a specific gravity close to water and will not settle in a primary clarifier. A correctly sized DAF running at air-to-solids ratio 0.005–0.015 and surface loading 5–12 m/h delivers 85–95% TSS removal; the standard coagulant package is polyaluminum chloride (PAC) at 50–150 mg/L plus anionic flocculant at 1–3 mg/L. Upstream, a 3–5 mm rotary bar screen protects the DAF and downstream high-pressure pumps from fibrous bagasse, cassava peel, and potato pulp. pH correction with NaOH or lime to 6.8–7.2 is mandatory before the anaerobic reactor — raw pH of 4.0–6.5 will acid-crash methanogens and stall biogas production within hours. Skimmings from the DAF are routed directly to a sludge dewatering press; the clarified underflow feeds the anaerobic stage at a controlled, near-neutral pH.
Anaerobic Stage: UASB vs IC Reactor Design Parameters
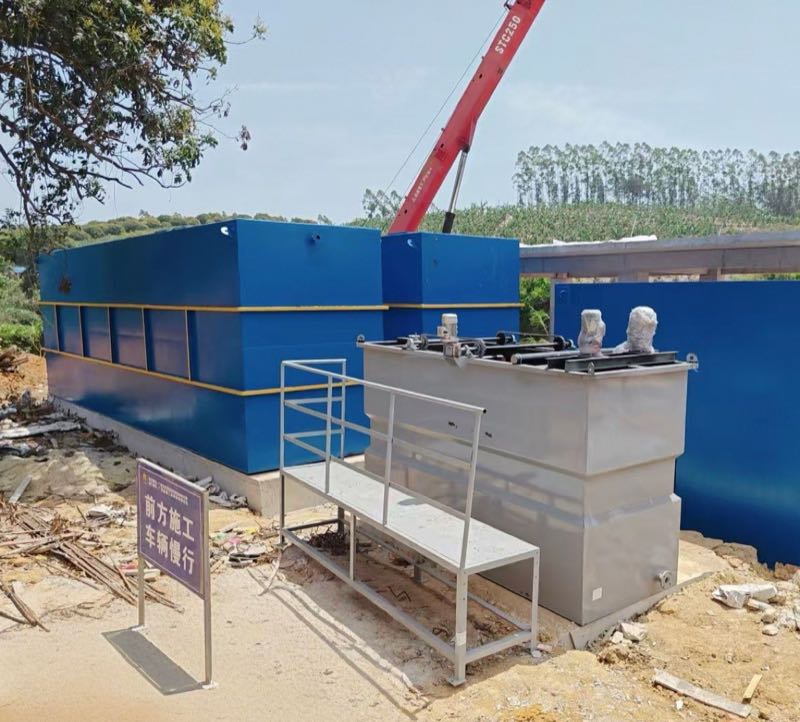
High-rate anaerobic digestion is the heart of any starch wastewater biological treatment process, and the choice between a UASB reactor and an internal circulation (IC) reactor is the first major equipment decision. A UASB reactor runs at HRT 8–12 h, OLR 8–12 kg COD/m³·d, and upflow velocity 0.7–1.0 m/h; granular sludge bed height is 2–4 m; COD removal is 80–88%; the footprint grows quickly above 1,000 m³/d because of the wider cross-section. An IC internal circulation reactor is taller (16–22 m tower) but cuts footprint by 50–60% at OLR 15–25 kg COD/m³·d, HRT 4–6 h, and 85–92% COD removal, which makes IC the preferred 2026 choice for new builds above 500 m³/d. Biogas yield for both is 0.35–0.45 m³/kg COD removed; firing it in a CHP unit offsets 30–45% of plant electricity at current natural-gas tariffs. The full design rationale and pitfalls are covered in the UASB reactor design guide.
| Parameter | UASB Reactor | IC Internal Circulation Reactor |
|---|---|---|
| HRT | 8–12 h | 4–6 h |
| OLR | 8–12 kg COD/m³·d | 15–25 kg COD/m³·d |
| Upflow velocity | 0.7–1.0 m/h | 1.5–2.5 m/h |
| COD removal | 80–88% | 85–92% |
| Reactor height | 6–10 m | 16–22 m |
| Footprint at 500 m³/d | ~120 m² | ~55 m² |
| Biogas CH₄ content | 65–72% | 68–74% |
| Indicative CAPEX (500 m³/d, 2026 USD) | $350k–$650k | $700k–$1.1M |
Aerobic Polishing: Choosing Between SBR, MBBR, and MBR
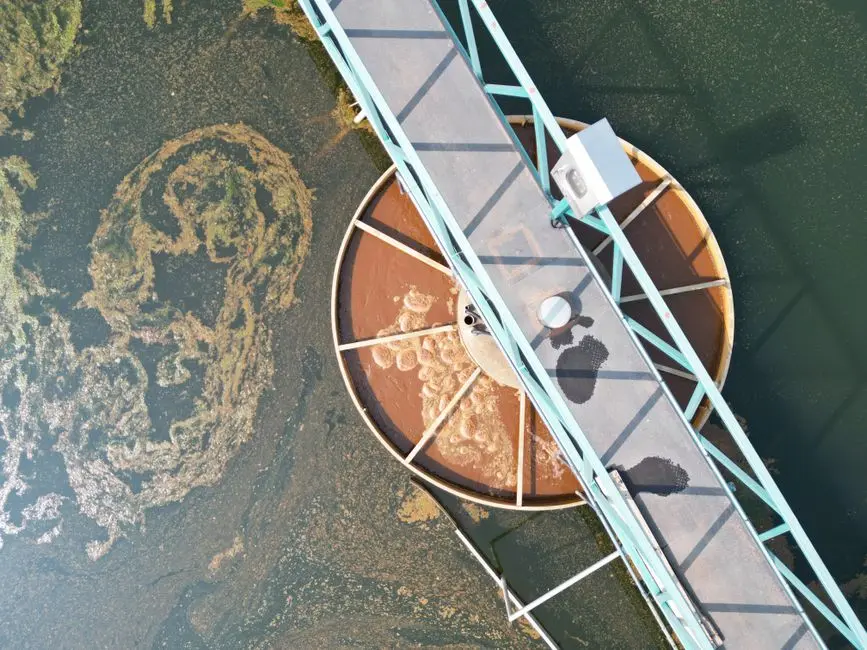
The aerobic stage is sized to take anaerobic effluent from ~800–1,800 mg/L COD down to the discharge or reuse target, and the reactor choice is driven by effluent quality and site footprint more than influent strength. An SBR (sequencing batch reactor) at HRT 18–24 h and MLSS 3,500–5,000 mg/L produces effluent COD 100–150 mg/L and TSS 20–40 mg/L, which is the lowest-CAPEX option and the right pick for plants under 300 m³/d. An MBBR at HRT 10–14 h with biofilm carrier fill at 30–40% delivers effluent COD 80–120 mg/L and tolerates campaign shock loading because the biofilm is attached, not suspended — it is the resilient middle ground. A submerged MBR bioreactor polishing stage with a submerged PVDF MBR membrane module runs at MLSS 8,000–12,000 mg/L and HRT 6–10 h, producing effluent COD ≤50 mg/L and TSS ≤5 mg/L — meeting 2026 reuse standards and all three regulatory limits without a tertiary clarifier. Because raw starch wastewater is nitrogen-limited (C:N ≈ 60:1), full nitrification requires SRT 20–30 days and supplemental urea dosing of 8–12 mg N/L.
| Parameter | SBR | MBBR | MBR (submerged PVDF) |
|---|---|---|---|
| HRT | 18–24 h | 10–14 h | 6–10 h |
| MLSS / biomass | 3,500–5,000 mg/L | Biofilm 30–40% fill | 8,000–12,000 mg/L |
| Effluent COD | 100–150 mg/L | 80–120 mg/L | ≤50 mg/L |
| Effluent TSS | 20–40 mg/L | 15–30 mg/L | ≤5 mg/L |
| Footprint at 500 m³/d | ~180 m² | ~140 m² | ~90 m² |
| Shock-load tolerance | Low | High | Medium-High |
| Reuse-ready without RO | No | No | Yes |
Sludge Management and Energy Recovery
The mass-balance loop closes in the sludge line: combined waste activated sludge and anaerobic surplus produce 0.05–0.10 kg dry solids per kg COD removed across the train. A plate-and-frame filter press dewaters this sludge to 22–28% DS, which is suitable for off-site disposal or co-incineration with biomass boiler fuel. Biogas from the IC or UASB reactor is typically scrubbed of H₂S to under 200 ppm and fired in a CHP unit sized at 60–80% of the reactor's gas output; the remaining 20–40% is flared during low-demand periods. Best-practice 2026 plants also recycle DAF skimmings back to the anaerobic digester headworks, which lifts biogas yield by another 4–7% and trims hauled sludge volume.
2026 Compliance Targets and Cost Benchmarks
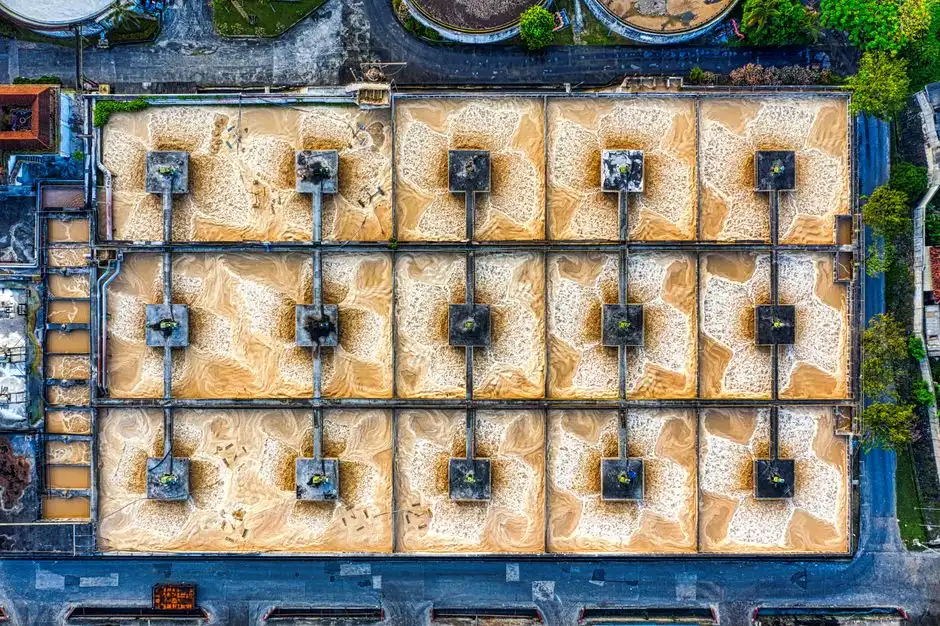
Three regulatory limits anchor the design choice. China GB 25462-2010 sets COD ≤100 mg/L and ammonia ≤15 mg/L (discharge standard GB 25462); EU 91/271/EEC sets COD ≤125 mg/L for agro-food effluent; US EPA 40 CFR Part 408 grain-processing limits set COD ≤250 mg/L on a 30-day average. An MBR train meets all three; an SBR train meets China and EU; a conventional activated-sludge train only meets US 40 CFR 408. CAPEX for a 500 m³/d starch plant in 2026 USD runs $1.4–$3.2M for a DAF + UASB + MBR train, $2.1–$3.9M for a DAF + IC + MBR train, and $0.9–$1.8M for the SBR variant. OPEX lands at $0.18–$0.42/m³ treated (energy, chemicals, sludge hauling); biogas CHP credit can drop net OPEX by 12–18%. For a deeper MBBR-specific OPEX picture, see the MBBR OPEX breakdown.
| Train Configuration (500 m³/d, 2026 USD) | CAPEX | OPEX ($/m³) | Net OPEX w/ Biogas | Discharge Compliance |
|---|---|---|---|---|
| DAF + UASB + MBR | $1.4–$3.2M | $0.22–$0.42 | $0.18–$0.36 | CN, EU, US |
| DAF + IC + MBR | $2.1–$3.9M | $0.24–$0.45 | $0.20–$0.38 | CN, EU, US |
| DAF + UASB + SBR | $0.9–$1.8M | $0.18–$0.32 | $0.15–$0.28 | CN, EU only |
| DAF + Conventional ASP | $0.6–$1.2M | $0.16–$0.28 | $0.14–$0.24 | US only |
Frequently Asked Questions
What biological treatment is best for starch wastewater? A three-stage train of DAF → UASB or IC → MBR is the 2026 default; it handles 6,000–12,000 mg/L COD, drops effluent to under 50 mg/L COD, and produces enough biogas to offset 30–45% of plant power (HydropureWater field data, 2026).
How much COD can anaerobic digestion remove from starch wastewater? 80–92% at OLR 8–25 kg COD/m³·d and HRT 4–12 h, depending on whether a UASB or IC reactor is used; biogas yield is 0.35–0.45 m³/kg COD removed.
Can starch wastewater meet reuse standards after biological treatment? Yes — MBR + RO polishing produces effluent suitable for cooling-tower or boiler-feed makeup at COD ≤50 mg/L, TSS ≤5 mg/L, and conductivity under 50 µS/cm post-RO.
How much does a 500 m³/d starch wastewater biological treatment plant cost in 2026? CAPEX runs $1.4–$3.2M for a DAF + UASB + MBR train, $2.1–$3.9M for DAF + IC + MBR, and $0.9–$1.8M for the SBR variant (2026 USD, HydropureWater field data).
Why does conventional activated sludge fail on starch wastewater? Two documented failure modes: it cannot treat feed with over 1% suspended solids, and it cannot tolerate the 2× shock loading of campaign production cycles (Biological Wastewater Treatment, GRD Press). If bulking already appears in an existing ASP train, the bulking sludge troubleshooting guide covers the diagnostic steps before retrofit.