Why Sugar Mills Are Moving to Wastewater Recycling
Sugar mill wastewater recycling typically recovers 60–85% of freshwater intake when a five-stage train matches cooling, boiler, and imbibition demand. A 5,000 TCD cane mill draws 7,500–15,000 m³/day at 1.5–3.0 m³ per ton crushed; beet plants use 8–15 m³ per ton. India's CPCB sets 250 mg/L COD for irrigation discharge and 100 mg/L COD for inland surface water.
A sugar mill processing 5,000 TCD of cane draws 7,500–15,000 m³/day of freshwater. In 2026 the business case for recycling that water is no longer driven by goodwill alone. Cane mills consume 1.5–3.0 m³ of freshwater per ton of cane crushed. Beet operations run higher at 8–15 m³ per ton of beet processed. Rating agencies and ESG auditors now flag that intensity in mandatory disclosures (per FAO 2024–2025 AQUASTAT regional stress indices).
Regulators are closing the gap in parallel. India's Central Pollution Control Board enforces 250 mg/L COD for sugar-sector discharge to irrigation land. The inland-surface-water limit is 100 mg/L COD under Sugar and Distillery industry-specific standards. EU Industrial Emissions Directive revisions in 2025 tightened BAT reference documents for food-sector effluent, including sugar. The IFC Performance Standards 2024 update pushes lenders to require intake reduction before greenfield capex is approved.
Geography is making the decision for many operators. FAO's 2024–2025 water-stress projections classify Maharashtra, São Paulo State, Punjab, and central Thailand as high water-risk cane regions. Beet zones in the EU face recurring summer restrictions. Freshwater tariffs run USD 0.30–1.20 per m³ in stressed basins (per World Bank 2024 pricing data). Discharge fees and the iScience 2025 wastewater-harvesting framing push the same way: a 2026 reuse retrofit beats once-through discharge on cost.
Sugar Mill Wastewater: Sources and Influent Characterization
Five discrete streams define the design basis at most mills: imbibition water carry-over, condenser cooling bleed, intermittent boiler blowdown, mill-house wash water, and — where a distillery is co-located — spent wash. Each carries a different load, and conflating them at the head of the treatment plant is the single most common sizing error engineers make on sugar-mill retrofits.
| Stream | COD (mg/L) | BOD (mg/L) | TSS (mg/L) | Temp (°C) | pH | Notes |
|---|---|---|---|---|---|---|
| Imbibition carry-over | 1,800–4,500 | 600–1,800 | 800–2,500 | 50–70 | 4.5–6.5 | High color (1,500–4,000 Pt-Co), bagasse fines |
| Condenser cooling bleed | 100–400 | 30–120 | 50–200 | 35–45 | 6.5–7.5 | Low load, high volume, scale risk |
| Boiler blowdown | 200–600 | 20–80 | 50–150 | 60–90 | 9.0–11.5 | High TDS, silica, hardness |
| Mill house wash | 2,500–6,000 | 900–2,500 | 1,500–3,500 | 30–45 | 5.0–7.0 | Oil/grease, lubricants, intermittent |
| Distillery spent wash (if co-located) | 80,000–120,000 | 35,000–55,000 | 15,000–30,000 | 90–105 | 3.8–4.5 | Separate high-strength train typically required |
Beet-sugar effluent runs cooler (25–40 °C) and lower in BOD/COD, but carries higher color (3,000–5,000 Pt-Co) and salt load, which matters when you send the polished stream to a cooling tower or a boiler. Cane mills see higher temperatures and stronger BOD: COD ratios that favor anaerobic pretreatment.
Seasonality drives equalization design. Crushing seasons in India and Brazil compress 6–7 months of operation into a high-intensity window. A 12–24 h HRT equalization tank, typically sized at 1.5–2.0× average hourly flow, is the minimum buffer. That volume keeps downstream biology stable across shift changes and wash-down spikes. Microplastics and trace organics from bagasse, lubricants, and cleaners now constrain irrigation reuse (per Springer Discover 2024). Screen any food-adjacent reuse spec for those contaminants before design freeze.
What is sugar mill spent wash?
Sugar mill spent wash is the high-strength stillage discharged from a co-located distillery after molasses fermentation and distillation. Typical spent wash runs 80,000–120,000 mg/L COD and 35,000–55,000 mg/L BOD. TSS sits at 15,000–30,000 mg/L, temperature at 90–105 °C, and pH at 3.8–4.5. TDS often lands in the 30,000–50,000 mg/L range. Most plants we size keep spent wash on a separate anaerobic-plus-evaporation path. Blending it into the cane-mill train collapses biology and RO recovery.
Does spent wash need a separate train?
Spent wash almost always needs its own high-strength train when a distillery sits on the same site. COD at 80,000–120,000 mg/L and TDS at 30,000–50,000 mg/L overwhelm a mill-house DAF–MBR–RO loop. That loop is sized for 1,800–6,000 mg/L COD cane effluent. A dedicated UASB or digester plus evaporator/crystallizer or composting is the usual path. Mill streams then follow the five-stage reuse train below.
Sugar Mill Wastewater Recycling: Primary to Polishing Train
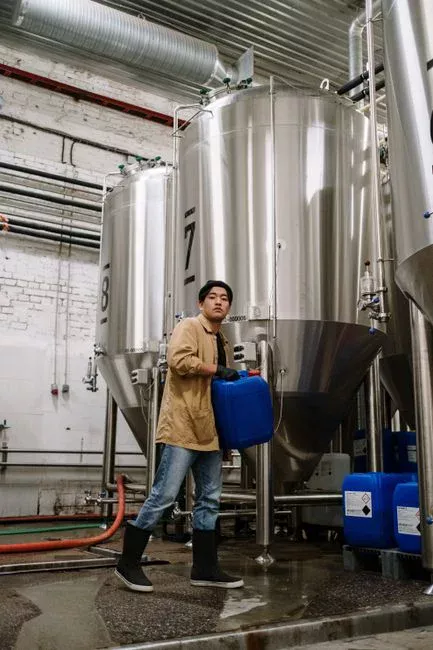
A defensible 2026 reuse train runs five stages, each with a measurable removal target. The goal is raw effluent at 1,800–6,000 mg/L COD down to single-digit mg/L COD. Skip unit operations the downstream end-use does not require.
Stage 1 — Primary. Bar screening (6–10 mm aperture) plus grit removal comes first. A dissolved air flotation system for primary sugar-mill effluent then strips suspended solids, oil, and grease. Well-operated DAF delivers 80–95% TSS removal and 70–90% FOG removal at 20–30 m³/m²·h hydraulic loading. That rate compresses footprint versus settling for high-organic cane streams.
Stage 2 — Biological. A mesophilic anaerobic UASB or IC reactor cuts high-strength COD by 70–85%. Biogas yield is 0.30–0.45 m³/kg COD removed, which offsets aeration cost downstream. Effluent then goes to an aerobic MBBR or conventional activated sludge. Residual BOD is driven below 30 mg/L. For mills without a distillery, this stage alone handles 60–70% of the COD load.
Stage 3 — MBR polishing. A submerged PVDF flat-sheet HydropureWater integrated MBR system for sugar-mill reuse polishing delivers sub-1 µm filtration. Effluent TSS stays <10 mg/L and COD <50 mg/L. Compared to conventional activated sludge, MBR cuts tankage footprint by roughly 60%. It also eliminates the secondary clarifier and simplifies reuse-train hydraulics. Capacities for sugar-mill reuse projects typically run 10–2,000 m³/day per skid.
Stage 4 — RO polish. Cooling-tower make-up and boiler feed need a salt polish. A brackish or low-pressure industrial RO system for boiler-feed water from sugar-mill effluent drives conductivity below 50 µS/cm. Silica drops below 0.1 mg/L under the same pass. Single-pass recovery is set at 65–75%. Two-stage concentrate recycling can reach 95% overall recovery.
Stage 5 — Disinfection. A chlorine dioxide generator for sugar-mill reuse-water disinfection is sized from 50–20,000 g/h ClO₂ output. It handles pathogen control ahead of cooling-tower or imbibition reuse. UV is the parallel barrier where residual oxidant cannot be tolerated.
| Stage | TSS (mg/L) | BOD (mg/L) | COD (mg/L) | Color (Pt-Co) | Conductivity (µS/cm) | Typical removal |
|---|---|---|---|---|---|---|
| Raw influent | 800–3,500 | 600–2,500 | 1,800–6,000 | 1,500–5,000 | 1,500–3,500 | — |
| After DAF (Stage 1) | 80–350 | 540–2,250 | 1,600–5,400 | 1,200–4,000 | 1,500–3,500 | 80–95% TSS, 10% COD |
| After anaerobic + aerobic (Stage 2) | 60–250 | 15–30 | 250–700 | 800–2,500 | 1,400–3,200 | 70–85% COD overall |
| After MBR (Stage 3) | <10 | <10 | <50 | 200–600 | 1,400–3,200 | ~90% residual COD |
| After RO (Stage 4) | <1 | <5 | <10 | <20 | <50 | 95–99% salts |
| After ClO₂/UV (Stage 5) | <1 | <5 | <10 | <20 | <50 | Pathogen control |
Satellite wash-water or staff-camp flows under roughly 200 m³/day should not load the main reuse header. An Underground Package Sewage Treatment Plant (WSZ Series) can treat those low-strength streams on a separate skid. Polished water then goes to green-belt irrigation.
Matching Treated Effluent to Reuse End-Uses
The process train only pays back when polished water matches an end-use that actually consumes it. Not every mill needs an RO polish. Over-specifying reuse water is the most common 2026 budget overrun I see on sugar-mill enquiry documents.
| Reuse end-use | TSS | BOD/COD | TDS / Conductivity | Hardness / Silica | Pathogen / Disinfection | Typical train |
|---|---|---|---|---|---|---|
| Cooling-tower make-up | <10 mg/L | BOD <20 mg/L | TDS <500 mg/L; cond. <1,000 µS/cm | Hardness <100 mg/L CaCO₃; silica <50 mg/L | Free Cl₂ 0.2–0.5 mg/L | MBR + RO (partial) |
| Boiler feed (low-pressure) | <1 mg/L | COD <5 mg/L | Cond. <10 µS/cm after mixed-bed | Hardness <1 mg/L; silica <0.1 mg/L | — | MBR + RO + mixed-bed |
| Imbibition water | <30 mg/L | BOD <30 mg/L | No tight spec | No tight spec | Color & pathogen control | MBR only |
| Equipment wash | <30 mg/L | BOD <50 mg/L | No tight spec | — | — | MBR only |
| Agricultural irrigation | <100 mg/L | BOD <100 mg/L | EC <2.0 dS/m; SAR <10 | — | Fecal coliform <1,000 MPN/100 mL | DAF + biological + chlorination |
| Landscape / green-belt | <30 mg/L | BOD <30 mg/L | EC <1.5 dS/m | — | — | MBR + chlorination |
Per the iScience 2025 framing, irrigation norms reference FAO 56 and CPCB sugar-industry limits. Those limits are pH 5.5–9.0, EC <2.0 dS/m, SAR <10, and BOD <100 mg/L. A typical 2026 reuse split for a 5,000 TCD cane mill sends 40–55% to cooling-tower make-up. Boiler feed takes 15–25%, and imbibition takes 10–20%. The balance goes to irrigation and green-belt use. That split drives roughly 60–85% net freshwater intake reduction versus once-through baseline (per HydropureWater commissioning data, 2025–2026).
Designing the Reuse Loop: Capacity, Storage, and Controls
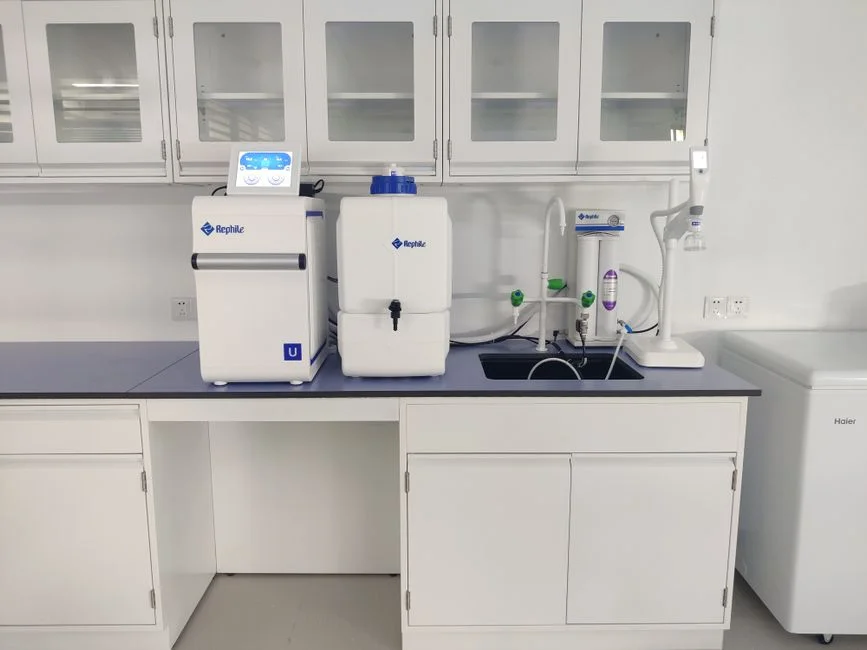
Storage and controls are what turn a treatment train into an operational reuse system. Treated-effluent storage is sized at 8–12 h of the design reuse flow. Use a dual-compartment tank so one side holds disinfection contact time. Contact time is minimum 30 min at peak ClO₂ residual of 0.5 mg/L; the other side feeds the reuse pumps. For a 5,000 TCD mill with 4,000 m³/day of polished reuse water, that means a 1,500–2,000 m³ tank. Glass-fused-to-steel or concrete keeps maintenance low over a 20-year design life.
Control logic runs on a PLC with conductivity and TDS interlocks on the cooling-tower make-up header. Automatic diversion to drain trips if treated-water quality slips below spec. Boilers and cooling fill cannot tolerate hardness or silica excursions. Online instruments at the reuse header should cover pH, conductivity, turbidity, and free chlorine as a minimum. Put silica and hardness analyzers on the boiler-feed line. VFDs on recycle pumps and an energy-recovery device on the RO high-pressure pump are baseline 2026 practice, per the iScience 2025 energy-optimization emphasis.
Run this selection checklist before freezing P&IDs. Measure each stream's COD, BOD, TSS, TDS, and temperature separately for one full crushing week. Confirm cooling-tower and boiler make-up demand in m³/day. Decide whether imbibition reuse is allowed under food-contact policy. Size equalization at 12–24 h HRT and 1.5–2.0× average hourly flow. Set diversion interlocks on conductivity and silica. Budget membrane replacement at 6–12% of membrane CAPEX per year. Leave a 90-day outage window for skid install if crushing season is booked.
CAPEX, OPEX, and Payback: 2026 Cost Benchmarks
Budget envelopes for 2026 sugar-mill reuse retrofits follow the treatment level, not the flow alone. The table below reflects 2025–2026 Asia and Latin America project benchmarks. Treat the figures as a scoping tool rather than a quotation.
| Treatment level | CAPEX (USD per m³/day) | OPEX electricity (kWh/m³) | OPEX chemicals (USD/m³) | Membrane replacement (% CAPEX/yr) |
|---|---|---|---|---|
| Primary + biological (no reuse) | 180–320 | 0.4–0.8 | 0.02–0.05 | — |
| + MBR polishing | 380–520 | 0.7–1.1 | 0.04–0.08 | 8–12% |
| + RO polish (cooling/boiler) | 520–650 | 0.8–1.6 | 0.05–0.12 | 6–9% RO, 8–12% MBR |
| Full ZLD (evaporator + crystallizer) | 900–1,400 | 2.5–4.5 (thermal) | 0.15–0.30 | 10–15% (mechanical + thermal) |
Freshwater at USD 0.30–1.20 per m³ plus avoided discharge fees of USD 0.05–0.40 per m³ in CPCB-regulated Indian states typically delivers 3–5 year payback on a reuse-and-discharge train. Full ZLD retrofits usually show 5–8 year payback (per HydropureWater project finance models, 2025–2026). Integrated skid packages combining MBR, RO, and dosing on a single frame compress site installation by 30–40% versus stick-built. That schedule advantage matters when crushing season is booked and only a 90-day outage window remains. Spirulina-based sugar-mill treatment studies also show combined water recycling, energy savings, and protein output. ESG-mandated boards increasingly accept that resource-recovery line as a capex offset.
Reuse Versus Zero Liquid Discharge: How to Choose
Five questions usually settle the reuse-versus-ZLD choice without a consultant. First: is discharge permitted, or is the receiving water on a no-discharge list? CPCB 100 mg/L COD inland-surface-water and 250 mg/L irrigation standards are workable for reuse-and-discharge. If the regulator has moved to zero-discharge, ZLD is forced. Second: what is the local freshwater tariff, and is there a discharge fee? In water-stressed Maharashtra or São Paulo, both are punitive, and reuse pays back in 3–5 years. Third: is a distillery co-located? Spent-wash TDS in the 30,000–50,000 mg/L range often tips the math toward ZLD because brine disposal becomes limiting. Fourth: does the board have a public zero-discharge commitment in its 2026 sustainability report? Once published, ZLD is the only defensible answer. Fifth: can cooling and boiler circuits absorb >75% of treated water at MBR+RO quality? If yes, reuse is sufficient; if not, evaporation or brine management brings ZLD into scope.
South Asian mills face tighter 2026 discharge ceilings. The ZLD versus reuse decision framework for South Asian sugar mills walkthrough lays out evaporator and crystallizer sizing once the reuse train is fully loaded. Compact camps or remote packing houses may need sewage treatment off the cane-mill reuse header. An Underground Package Sewage Treatment Plant (WSZ Series) covers those flows without enlarging the main MBR–RO plant.
Who This Is For and Next Step
This guide is for plant engineers, EPC contractors, and procurement managers. It covers sugar mill wastewater recycling for cane or beet mills in the 500–15,000 m³/day range. Operators with permitted irrigation discharge, no intake-cost pressure, and no cooling or boiler make-up demand should look elsewhere. A primary-plus-biological train without membranes is usually enough for that case. If you have stream samples, cooling-tower demand, and a target reuse split, send them through our sugar-mill reuse design enquiry. We will map CAPEX bands and stage cuts against your end-uses.
Frequently Asked Questions
What COD removal can a five-stage sugar-mill reuse train deliver?
A DAF + anaerobic UASB + aerobic MBBR + MBR + RO train takes influent at 1,800–6,000 mg/L COD to <10 mg/L in the RO permeate, an overall reduction of 99%+. The MBR alone is usually enough to hit the CPCB 100 mg/L inland-surface-water standard for discharge or imbibition reuse. Skip RO when cooling and boiler circuits do not need sub-50 µS/cm permeate (HydropureWater commissioning data, 2025–2026).
How much freshwater can a sugar mill displace with reuse in 2026?
Mills with a five-stage train sized to match cooling-tower and boiler demand report 60–85% net freshwater intake reduction. The upper end is reachable only when imbibition water is also part of the reuse loop. Beet mills typically land at 55–75% because the higher baseline water intensity of 8–15 m³ per ton of beet leaves more low-grade reuse opportunities outside the RO polish.
Is MBR necessary if the end-use is imbibition water only?
No. MBR is justified when reuse demands sub-50 mg/L COD or pathogen control beyond what conventional activated sludge delivers. For imbibition water, biological treatment plus multimedia filtration and chlorination is usually sufficient. Capex can then stay at the lower end of the 380–520 USD per m³/day MBR band by skipping the membrane step when food-contact policy allows.
What flow rate makes a five-stage reuse train economically viable?
Below roughly 500 m³/day, containerized skid packages begin to outcompete stick-built plants on installed cost. At 200 m³/day the per-m³ capex rises sharply because fixed control and disinfection costs dominate. In that range, a three-stage train of DAF + biological + MBR without RO is usually the right answer for sugar-mill wash and cooling bleed streams.
How are microplastics and trace organics handled in a 2026 reuse spec?
RO and tight MBR cut microplastics to below detection in most pilots reported for industrial reuse. Residual trace-organic load is flagged in the iScience 2025 special issue as a parameter worth specifying for any reuse end-use that touches food contact or irrigation of food crops. Advanced oxidation with UV/H₂O₂ is the typical polish when the reuse spec demands non-detect for those compounds.