Why Edible Oil Wastewater Is Uniquely Expensive to Treat
Edible oil refining concentrates four to ten times more organic load per cubic meter than municipal sewage, which is the single largest reason treatment capex and opex run higher than for generic food processing streams. Refining, bleaching, deodorization, and spent caustic streams arrive at the treatment plant with COD 5,000–25,000 mg/L, a BOD/COD ratio of 0.35–0.50, FOG 1,000–8,000 mg/L, and sulfate 200–1,500 mg/L from acidified oil washing. Temperatures of 40–70 °C and emulsified FOG defeat conventional primary clarifiers — the density differential between oil droplets and water collapses at elevated temperature, and emulsified oil simply passes through a gravity settler. Dissolved air flotation is the minimum viable primary step, and most plants without it are paying for it in aeration tank foaming, scum buildup, and lost biogas yield downstream. The 2024 Springer review of Greek olive oil operations (Waste and Biomass Valorization, 2024) confirms that both three-phase and two-phase centrifuge systems generate a high-strength wastewater that needs dedicated biological treatment, not dilution into a municipal sewer.
| Parameter | Refining/bleaching | Olive mill (OMW) | Palm oil mill (POME) | Spent caustic |
|---|---|---|---|---|
| COD (mg/L) | 5,000–15,000 | 10,000–25,000 | 15,000–25,000 | 20,000–50,000 |
| FOG (mg/L) | 1,000–3,000 | 2,000–8,000 | 3,000–6,000 | 500–2,000 |
| Sulfate (mg/L) | 200–800 | 100–400 | <100 | 500–1,500 |
| Temperature (°C) | 40–65 | 25–35 | 60–80 | 30–50 |
| pH | 4–9 | 4.5–6.5 | 4.0–5.0 | 12–14 |
The 2026 Standard Process Train for Edible Oil Wastewater
The defensible 2026 process train for vegetable oil refinery wastewater is five stages, in this order: DAF pre-treatment → equalization and pH correction → anaerobic (UASB or IC) → aerobic MBR polishing → optional RO for water reuse or ZLD. Each stage is non-optional in a well-designed plant; collapsing two stages to save capex almost always inflates opex downstream.
Stage 1 — DAF. A properly sized dissolved air flotation system removes 85–95% of oil and grease and 70–90% of TSS at hydraulic loading of 4–25 m³/m²/h, with polymer dosing to break oil-in-water emulsions. Without DAF, emulsified FOG carries into the anaerobic reactor and forms a scum blanket that reduces biogas yield and forces unplanned shutdowns.
Stage 2 — Equalization. 8–24 hours of HRT buffers the pH and load spikes from spent caustic and acid wash streams. A PLC-controlled chemical dosing system handles the neutralizing reagent (typically NaOH or H₂SO₄) and keeps the feed to the anaerobic reactor in the pH 6.5–7.5 window where methanogens operate.
Stage 3 — Anaerobic (UASB or IC). COD removal 70–85% at organic loading rate 8–15 kg COD/m³/day, with biogas yield 0.30–0.45 m³/kg COD removed (CH₄ content 60–70%). IC reactors are preferred above 200 m³/day for their higher upflow velocity and tolerance of suspended solids; UASB remains cost-effective at 50–150 m³/day. This stage is the OPEX offset that justifies the front-end capex — biogas typically displaces 20–35% of the plant's energy bill.
Stage 4 — Aerobic MBR. An integrated MBR membrane bioreactor with a DF-series PVDF flat sheet MBR module at 0.1 μm pore size delivers effluent COD <100 mg/L, TSS <10 mg/L, and FOG <5 mg/L — comfortably below EU IPPC BREF and EPA 40 CFR 432 discharge limits. The flat-sheet geometry cuts aeration energy by 10–20% compared with hollow-fiber or external cross-flow designs because it operates at low suction vacuum (typically 0.05–0.15 bar) without recirculation pumps.
Stage 5 — Optional RO. Reverse osmosis at 10–15 bar with 65–75% recovery is added when the plant targets 80% water reuse or full ZLD. Antiscalant dosing and CIP every 4–8 weeks are standard.
| Stage | Equipment | Key parameter | Typical performance |
|---|---|---|---|
| 1. DAF | DAF line | Loading 4–25 m³/m²/h | FOG −85–95%, TSS −70–90% |
| 2. Equalization | Lined tank + dosing | HRT 8–24 h | pH smoothed to 6.5–7.5 |
| 3. Anaerobic | UASB / IC reactor | OLR 8–15 kg COD/m³/d | COD −70–85%, biogas 0.30–0.45 m³/kg |
| 4. MBR | DF-series flat sheet | Flux 15–25 L/m²/h | Effluent COD <100, TSS <10 mg/L |
| 5. RO (optional) | BWRO skid | 10–15 bar, recovery 65–75% | Reuse quality <50 mg/L TDS |
2026 CAPEX Breakdown by Plant Capacity
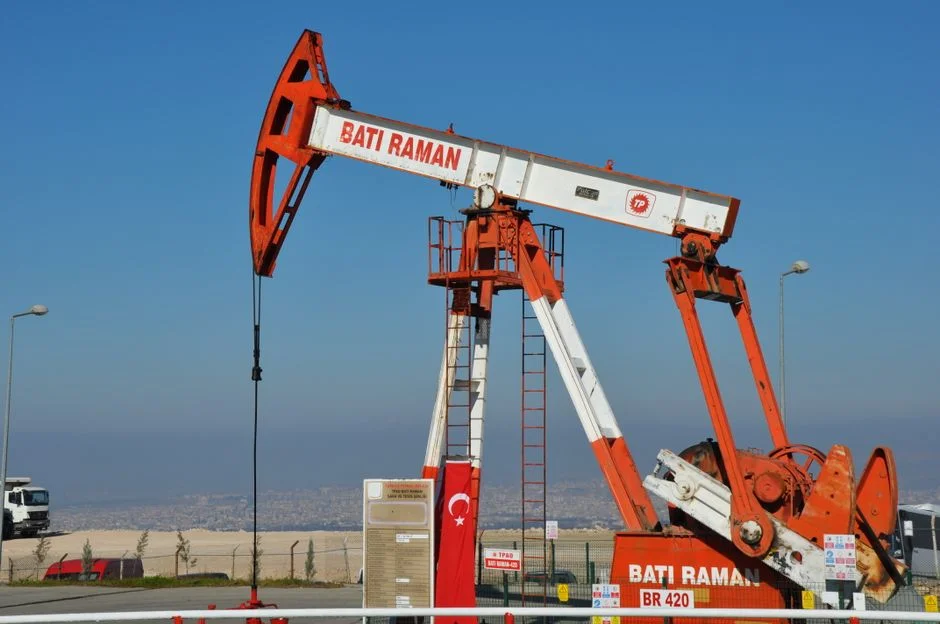
For a 50–500 m³/day edible oil wastewater treatment plant, 2026 capex ranges from $1.2M to $6.5M, scaling roughly with the 0.6 power of capacity. The split is stable across sizes: equipment 55%, installation 20%, civil works 15%, engineering and commissioning 10%.
- 50 m³/day: $1.2M–$2.5M capex. Typically DAF + UASB + SBR (MBR is uneconomic at this scale unless discharge requires <50 mg/L TSS).
- 200 m³/day: $2.8M–$4.2M capex. Full DAF + UASB + MBR with PLC/SCADA, biogas holder, and flare.
- 500 m³/day: $4.5M–$6.5M capex. IC reactor + MBR + RO, biogas holder with CHP, full automation.
Add 20–30% for plants built in the EU or North America versus Asia, driven by 304/316 stainless-steel specification, stricter compliance with EU IPPC BREF for food processing and EPA 40 CFR 432 for edible oils, and higher labor and certification costs. Plants in India and China typically reference CPCB and GB 8978 respectively, which allow slightly looser discharge ceilings and therefore lower capex for the same biological train.
| Capacity (m³/day) | Process scope | CAPEX (USD, Asia) | CAPEX (EU/NA) | Discharge target |
|---|---|---|---|---|
| 50 | DAF + UASB + SBR | $1.2M–$1.8M | $1.5M–$2.5M | COD <250 mg/L |
| 200 | DAF + UASB + MBR | $2.8M–$3.4M | $3.4M–$4.2M | COD <100 mg/L |
| 500 | DAF + IC + MBR + RO | $4.5M–$5.5M | $5.4M–$6.5M | COD <50 mg/L, reuse |
2026 OPEX Line Items: Where the Money Goes
For a 200 m³/day plant, 2026 opex runs $0.45–$1.80/m³ of treated effluent, dominated by energy.
- Energy — 35–45% of opex. Aeration is the largest single line. A flat-sheet MBR cuts blower power 10–20% versus hollow-fiber designs by avoiding recirculation pumps. Pairing the MBR with on-site CHP running on captured biogas reduces net grid draw by 25–40%.
- Chemicals — 15–20%. Coagulant (PAC or FeCl₃) and flocculant (polyacrylamide) for DAF typically run $0.02–$0.05/m³. Antiscalant for RO adds $0.01–$0.03/m³ when RO is installed.
- Sludge handling — 10–15%. A plate and frame filter press dewaters DAF scum and biological sludge to 20–25% dry solids, cutting offsite disposal tonnage and cost by 75–80% versus liquid hauling.
- Labor — 10–15%. Plants at 200 m³/day and above with full PLC/SCADA typically need only 1–2 operators per shift.
- Maintenance and membranes — 5–10%. MBR membrane replacement every 5–7 years at $25–$45/m² is the predictable major item. Pump rebuilds, instrument calibration, and gear service account for the rest.
ROI, Payback, and the Case for Water Reuse
Payback for a discharge-only plant with biogas recovery is 4–6 years, driven by avoided discharge penalties, avoided freshwater intake, and biogas displacing purchased fuel. Adding 80% water reuse (MBR + RO) and crediting freshwater savings of $0.80–$1.50/m³ against the local potable or process water tariff typically compresses payback to 3–4 years for plants above 200 m³/day. Full ZLD is a 5–7 year payback but eliminates discharge permit risk entirely, which is becoming the deciding factor in water-stressed basins — Mediterranean olive oil regions, Indian palm oil states, and Chinese soybean processors in the Yellow River basin all face tightening allocations. Biogas revenue at $0.25–$0.40/m³ of methane offsets 20–35% of opex where the plant has on-site boilers; selling to grid or to a CHP unit improves the offset by another 5–10%. For comparison, a similar-sized paper mill wastewater plant operating cost breakdown shows broadly the same energy-to-chemicals ratio, but edible oil plants run hotter influents and benefit from higher methane yield per kg COD removed.
Frequently Asked Questions
How much does an edible oil wastewater treatment plant cost in 2026?
For a 50–500 m³/day plant, 2026 capex is $1.2M–$6.5M and opex is $0.45–$1.80/m³. A 200 m³/day plant with DAF + UASB + MBR typically lands at $3.0M–$3.8M in Asia, $3.6M–$4.2M in the EU or North America (HydropureWater field data, 2026).
What is the best treatment process for palm oil mill effluent (POME)?
POME at COD 15,000–25,000 mg/L and 60–80 °C is best treated by DAF for FOG → equalization → IC anaerobic reactor at OLR 10–15 kg COD/m³/d → MBR polishing. Biogas yield of 0.35–0.45 m³/kg COD removed typically covers 30–40% of plant opex.
How is olive oil mill wastewater (OMW) different from palm oil wastewater?
OMW runs cooler (25–35 °C) and more acidic (pH 4.5–6.5) with a shorter, seasonal campaign (3–4 months/year). Treatment train is similar — DAF + UASB/IC + MBR — but equalization tank sizing must absorb a 3–5× daily flow variation typical of batch pressing operations.
What discharge limits apply to edible oil refineries in 2026?
EU refiners comply with IPPC BREF for food processing (COD <125 mg/L, TSS <50 mg/L). US plants follow EPA 40 CFR 432 with BPT limits of COD <450 mg/L, FOG <100 mg/L. Indian plants reference CPCB and Chinese plants GB 8978, both of which allow COD <250 mg/L for discharge to municipal sewer.
Is MBR or SBR better for a 200 m³/day edible oil plant?
MBR delivers lower effluent TSS (<10 mg/L versus <50 mg/L for SBR) and a smaller footprint, at 10–20% higher capex. Choose MBR when discharge limits are tight or when the plant targets 80% water reuse; SBR is the economical pick when discharge is to a municipal sewer with biological treatment downstream. For similar sizing logic in another sector, the biodiesel wastewater treatment plant supplier guide walks through the same MBR-versus-SBR trade-off for a comparable high-FOG stream.
Related Equipment
- DF-series PVDF flat sheet MBR module — specifications, capacity range, and technical data