What Is Starch Wastewater and Why It Is a Unique Industrial Stream
Starch wastewater is the combined process water discharged from extraction lines that convert corn, cassava (tapioca), wheat, sweet potato or potato into native or modified starch. Every wet stage contributes load: washing, steeping, grinding, fibre screening, gluten separation, refining and dewatering all run on the same water loop, so the combined effluent carries dissolved sugars, suspended starch granules, fine fibre, residual protein and process chemicals. Cai (2019, IOP Conf. Ser. 358(2):022054) classifies the stream as a "high concentration and non-toxicity" industrial effluent, which is the technical justification for sending it down a biological train rather than a chemical-oxidation route. Zhou (2010) adds that the effluent carries high turbidity and a heavy odor once it passes through anaerobic stages, which is why polishing and deodorisation sit at the end of the flow sheet, not the beginning.
Two metrics define the design envelope. First, water intensity: 5–20 m³ of process water is consumed per tonne of starch produced, so a 100 t/d cassava line generates 500–2,000 m³/d of effluent. Second, the discharge is seasonal and cyclic — most starch plants run campaigns of 60–120 days tied to harvest, and a single shift changeover can swing influent COD by a factor of three within an hour. That is why every reliable 2026 flow sheet starts with equalisation before any biological reactor, and why a DAF system for starch wastewater pretreatment is specified upstream of the anaerobic stage to strip suspended starch before it loads the biomass.
Starch Wastewater Characteristics: Typical Influent Parameters by Source
The table below consolidates 2026 design values drawn from Cai (2019), Zhou (2010), the AIT (2000) tapioca-starch UASB dataset, and HydropureWater field data from corn, cassava and wheat projects in 2024–2025. Use P95 (95th-percentile) values for equipment sizing and P50 for OPEX modelling.
| Source | pH | COD (mg/L) | BOD₅ (mg/L) | BOD/COD | TSS (mg/L) | TN (mg/L) | TP (mg/L) | Temp (°C) |
|---|---|---|---|---|---|---|---|---|
| Corn starch | 4.0–6.5 | 5,000–15,000 | 2,500–6,000 | 0.40–0.50 | 1,500–3,500 | 80–250 | 20–60 | 25–40 |
| Cassava / tapioca | 3.5–5.5 | 8,000–25,000 | 4,000–10,000 | 0.45–0.55 | 2,000–5,000 | 120–400 | 30–80 | 30–45 |
| Wheat starch | 4.0–6.0 | 6,000–18,000 | 3,000–7,000 | 0.42–0.50 | 2,000–4,000 | 150–450 | 25–70 | 20–35 |
| Sweet potato | 3.8–6.0 | 5,000–12,000 | 2,500–5,500 | 0.45–0.55 | 1,500–3,000 | 90–280 | 20–55 | 25–38 |
Three facts drive reactor selection. First, BOD₅/COD ratios of 0.40–0.55 confirm the stream is highly biodegradable, which is why anaerobic + aerobic is the default train and advanced oxidation is reserved for refractory polishing. Second, cassava/tapioca is the strongest stream because of fermentation-sour pH (3.5–5.5) and the highest soluble-sugar fraction, which is why it tolerates — and benefits from — high-rate IC and EGSB reactors operating at OLR 12–20 kg COD/m³·d. Third, the values above assume upstream protein recovery (gluten) and wash-water recycle are operating normally; once those are bypassed, TSS can climb to 6,000–8,000 mg/L and COD to 30,000+ mg/L, so the equalisation basin must be sized for the upset case, not the average.
How Starch Wastewater Is Treated: The 2026 Process Flow
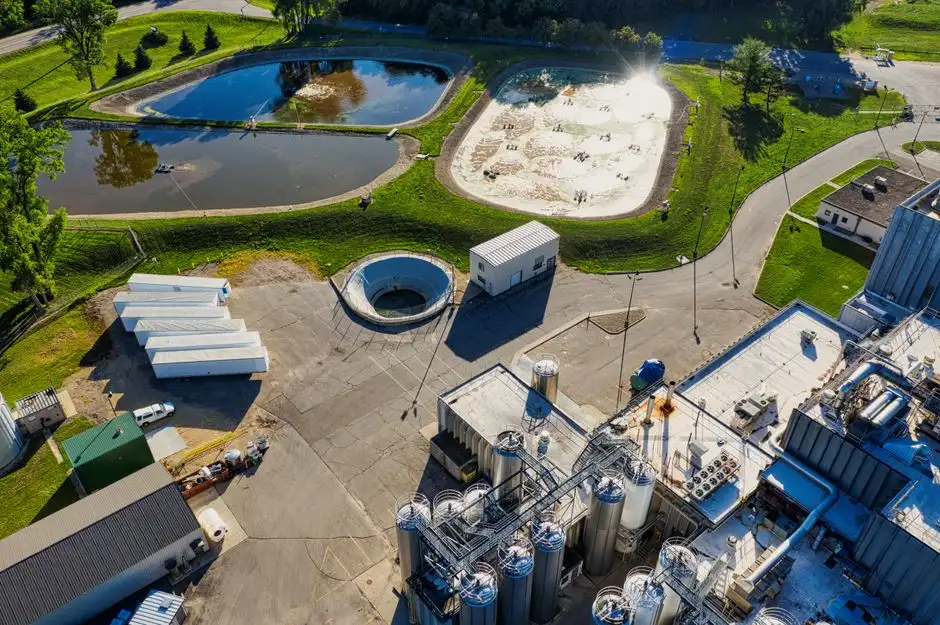
The standard 2026 treatment train runs in eight steps. Each step has a specific design duty, and skipping one step almost always reappears as an OPEX penalty two or three steps downstream.
- Screening and grit removal. A rotary bar screen for starch plant headworks at 5–10 mm opening plus a grit chamber protects downstream pumps and prevents starch granules from settling in pipes and channels. Flow velocity in the grit chamber is held at 0.25–0.40 m/s to drop sand but keep organics in suspension.
- Equalisation. An 8–24 h HRT buffer tank damps pH swings (3.5–6.5 raw, corrected to 6.5–7.5 before the biological stage) and absorbs COD peaks from campaign batch processing. Mechanical mixing at 4–6 W/m³ is typical; aeration is avoided to prevent souring.
- Primary clarification / DAF. A lamella clarifier or DAF unit strips suspended starch, protein and fine fibre. A well-designed DAF removes 60–85% of TSS and 30–45% of COD upfront, which roughly halves the load on the anaerobic reactor and shrinks its capex by 20–30%.
- Anaerobic biological treatment. UASB, IC or EGSB at OLR 8–15 kg COD/m³·d, HRT 24–72 h, upflow velocity 0.7–1.5 m/h. Biogas yield is 0.30–0.45 m³ CH₄ per kg COD removed; the AIT (2000) study and Cai (2019) both confirm UASB applicability to tapioca starch at full scale.
- Aerobic biological treatment. A2/O, SBR or MBR. The MBR variant with submerged PVDF 0.1 µm membranes lifts MLSS to 8,000–12,000 mg/L, eliminates the secondary clarifier, and roughly halves the aerobic-tank footprint. See the UASB reactor design for high-COD food-industry wastewater guide for the upstream sizing logic.
- Polishing. A second DAF or lamella clarifier plus a high-efficiency sedimentation tank for residual TSS and phosphorus. PLC-based coagulant and flocculant dosing of PAC 20–60 mg/L plus PAM 1–3 mg/L is typical when irrigation or cooling-tower reuse is the target.
- Disinfection. Chlorine dioxide (ClO₂) at 1–2 mg/L with 30-min contact time (CT ≥ 1.5 mg·min/L) or UV at 40 mJ/cm². A chlorine dioxide generator is the standard choice for closed-loop reuse lines because of its 30-day residual and biofilm-control benefit.
- Sludge handling. A plate-and-frame filter press for combined sludge dewatering dewaters primary + biological sludge to 22–28% DS; the biogas stream from step 4 offsets thermal demand for the press's wash water and the plant's boiler.
An MBR polishing for reuse-quality starch effluent block is the typical upgrade path when a plant moves from discharge compliance to a water-reuse loop; the MBR slot is what makes the difference between meeting 125 mg/L COD and reliably hitting 50 mg/L.
Anaerobic Reactor Selection: UASB vs IC vs EGSB for Starch Effluent
Reactor choice is driven by flow, footprint, influent temperature and the fraction of soluble starch — not by marketing claims. The table below is built from Cai (2019), the AIT (2000) tapioca dataset, and HydropureWater commissioning data from 2022–2025.
| Reactor | OLR (kg COD/m³·d) | HRT (h) | Upflow (m/h) | Footprint | COD removal | CAPEX index | Best-fit starch source |
|---|---|---|---|---|---|---|---|
| UASB | 8–12 | 24–72 | 0.7 | Large | 75–85% | 1.0× | Corn / wheat, 500–3,000 m³/d, land available |
| IC (Internal Circulation) | 12–20 | 8–16 | 1.5 | Small | 80–90% | 1.4× | Cassava / tapioca, 1,000–5,000 m³/d, tight sites |
| EGSB | 15–25 | 6–12 | 4–6 | Compact | 80–88% | 1.5× | Cool influent (<25 °C) or high dissolved-starch streams |
Decision rule for 2026: choose UASB below ~1,000 m³/d and above ~3,000 m³/d where land is available and the stream is corn or wheat based; choose IC for 1,000–5,000 m³/d with a tight footprint, which is the typical cassava/tapioca case in Southeast Asia and southern China; choose EGSB when influent temperature is unstable or starch is heavily solubilised. Zhou (2010) notes that anaerobic effluent can carry residual turbidity and odor; this is the reason a polishing DAF sits immediately downstream of the anaerobic reactor regardless of which high-rate design is selected — see the DAF design for bakery and starch streams reference for hydraulic-loading numbers.
Aerobics, MBR Polishing and Reuse-Quality Effluent Targets
Anaerobic effluent still carries 1,000–3,000 mg/L COD, 200–600 mg/L BOD₅ and significant colour. The aerobic block finishes the job. A conventional A2/O at MLSS 3,000–5,000 mg/L and HRT 12–24 h removes 70–85% of the remaining COD and reliably delivers <150 mg/L COD and <30 mg/L NH₃-N. The MBR upgrade (submerged PVDF 0.1 µm at MLSS 8,000–12,000 mg/L) eliminates the secondary clarifier, cuts the aerobic footprint by roughly 60%, and reaches <50 mg/L COD, <10 mg/L TSS, turbidity <1 NTU and NH₃-N <5 mg/L — parameters that close the gap to actual water reuse. The relevant MBR module reference lists membrane flux at 15–25 L/m²·h under these MLSS conditions.
Reuse targets for 2026 are specific: boiler-feed makeup ≤5 mg/L COD (after RO polish), cooling-tower makeup ≤30 mg/L COD, irrigation ≤100 mg/L COD per WHO 2006 reuse guidelines, and EU 91/271/EEC discharge compliance at ≤125 mg/L COD / ≤25 mg/L BOD₅. Disinfection is the final gate: chlorine dioxide at 1–2 mg/L delivers 99.9% microbial kill and a 30-day residual that protects closed-loop reuse piping; UV at 40 mJ/cm² is the chemical-free alternative. For any 2026 starch plant targeting water reuse, the standard polishing train is MBR + DAF + ClO₂.
2026 Cost, Compliance and ROI for a Starch Wastewater Treatment Plant
Convert the technical case into procurement language with the table below. Values are 2026 equipment-only CAPEX and 12-month OPEX from HydropureWater project data, China + Southeast Asia sites.
| Item | 1,000 m³/d plant | 5,000 m³/d plant | Notes |
|---|---|---|---|
| CAPEX (USD, equipment-only) | $1.2M–$3.5M | $4.5M–$12M | DF-4408 DAF + UASB/IC + A2/O + MBR + ClO₂ scope |
| OPEX (USD per m³ treated) | $0.18–$0.42 | $0.15–$0.32 | Lower unit OPEX at larger scale |
| Electricity share of OPEX | 35–45% | 35–45% | Aerobic blowers dominate |
| Chemicals (PAC/PAM) share | 10–15% | 10–15% | PLC-based dosing cuts overuse |
| Sludge handling share | 15–20% | 15–20% | Hauling + filter-press OPEX |
| Biogas CHP energy offset | 30–50% | 30–50% | Reduces net OPEX by 15–25% |
| Payback period | 2.5–4.0 years | 2.5–4.0 years | Freshwater + discharge-fee avoidance + CHP |
Compliance benchmarks for 2026: China GB 8978-1996 Table 4 sets COD ≤ 100 mg/L, BOD₅ ≤ 30 mg/L, SS ≤ 70 mg/L for Class-I secondary discharge; the EU Urban Waste Water Directive 91/271/EEC sets COD ≤ 125 mg/L and BOD₅ ≤ 25 mg/L for discharges from food-industry plants; India's CPCB applies starch-industry specific limits under the Effluent Discharge Standards. The cleanest trade-off to defend to procurement: skipping the anaerobic stage cuts CAPEX by ~25% but lifts OPEX by ~60%, triples the wet-sludge output, and forfeits the CHP revenue stream — payback stretches from ~3 years to ~7 years and reuse is no longer technically or economically viable.
Frequently Asked Questions
What is the typical COD of starch wastewater? Raw starch wastewater runs 5,000–25,000 mg/L COD depending on source — cassava/tapioca is the strongest at 8,000–25,000 mg/L, while corn starch typically sits at 5,000–15,000 mg/L (Cai 2019; HydropureWater field data, 2024–2025).
Is starch wastewater biodegradable? Yes. BOD₅/COD ratios of 0.40–0.55 across all four starch sources place it firmly in the highly biodegradable band, which is why anaerobic + aerobic is the standard 2026 train rather than advanced oxidation.
Which anaerobic reactor is best for cassava starch wastewater? IC (Internal Circulation) reactors at OLR 12–20 kg COD/m³·d and HRT 8–16 h are the standard choice for 1,000–5,000 m³/d cassava/tapioca plants with tight footprints; EGSB is preferred when influent is below 25 °C.
What effluent quality is needed to reuse starch plant wastewater? Cooling-tower reuse requires ≤30 mg/L COD, irrigation ≤100 mg/L COD (per WHO 2006), and boiler-feed makeup ≤5 mg/L COD after RO polish. MBR + DAF + ClO₂ reliably hits these targets in 2026.
What is the 2026 CAPEX for a 1,000 m³/d starch wastewater plant? Equipment-only CAPEX for a full DAF + UASB/IC + A2/O + MBR + ClO₂ scope is $1.2M–$3.5M, with OPEX of $0.18–$0.42 per m³ and a 2.5–4.0 year payback once biogas CHP and water reuse are credited (HydropureWater field data, 2026).