What a Brewery Wastewater Treatment Plant Supplier Actually Delivers
A brewery wastewater treatment plant supplier delivers a multi-stage system — screening, flow equalization, dissolved air flotation (DAF), anaerobic (UASB/IC) or aerobic (MBR/SBR) biological treatment, and disinfection — engineered for brewery effluent with influent COD of 2,000–6,000 mg/L. Qualified suppliers provide process design, equipment fabrication, installation supervision, and commissioning to meet local discharge standards such as China's GB 8978-1996 or EU Directive 91/271/EEC.
Supplier scope falls into four tiers, and choosing the wrong one is the single most common procurement mistake: equipment-only vendors ship skids but stop at the plant fence; skid-mounted package suppliers deliver a containerized plug-and-play system suited to flows under 500 m³/day; turnkey EPC contractors take responsibility from influent characterization through commissioning and performance warranty; and BOT/operate-maintain contractors finance the plant and sell treated water or biogas back to the brewery. The upper benchmark for brewery-specific delivery is the supplier (referenced in industry literature as Paques) reporting 594+ turnkey brewery and beverage installations globally — a reference count no other vendor matches and a useful threshold for shortlisting.
What separates a qualified brewery WWTP supplier from a general industrial vendor is the deliverable package: brewery-specific influent/effluent characterization across at least one CIP cycle, P&ID development, equipment fabrication with material certificates, installation supervision by a qualified site engineer, commissioning with performance testing, and a 12-month performance warranty tied to effluent numbers — not just equipment uptime. Brewery effluent is uniquely challenging because of high organic load, pH swings from 3 to 12 caused by CIP acid and caustic dosing, temperature spikes of 40–55°C from kettle discharge, and intermittent high-strength batches that hit the biological stage in slug loads. The regulatory envelope suppliers must design around includes GB 8978-1996 in China, EU Urban Waste Water Treatment Directive 91/271/EEC, US EPA categorical brewery standards, and local consent limits that often run tighter than national floors.
Brewery Effluent Characteristics and Discharge Standards
Brewery influent is high-strength, hot, and pH-volatile — typically COD 2,000–6,000 mg/L, BOD 1,500–4,000 mg/L, TSS 500–2,500 mg/L, pH 3–12, temperature 20–55°C, TN 20–80 mg/L, and TP 5–30 mg/L. These ranges come from composite sampling across fermentation, bottling, and CIP cycles at working breweries (HydropureWater field data, 2026).
| Parameter | Typical Brewery Influent | China GB 8978-1996 (Sec.) | EU 91/271/EEC | Reuse Target (GB/T 18920-2020) |
|---|---|---|---|---|
| COD (mg/L) | 2,000–6,000 | ≤150 | ≤125 | ≤50 |
| BOD₅ (mg/L) | 1,500–4,000 | ≤30 | ≤25 | ≤10 |
| TSS (mg/L) | 500–2,500 | ≤30 | ≤35 | ≤5 (MBR effluent) |
| pH | 3–12 | 6–9 | — | 6.5–8.5 |
| Temperature (°C) | 20–55 | — | — | ≤35 (cooling makeup) |
| TN (mg/L) | 20–80 | — | ≤15 | ≤15 |
| TP (mg/L) | 5–30 | — | ≤2 | ≤1 |
Discharge limits are the regulatory ceiling, but reuse targets drive a tighter polishing envelope. China's GB/T 18920-2020 for urban miscellaneous water reuse — a common benchmark for breweries aiming to send effluent to cooling tower makeup or boiler feed — caps COD at 50 mg/L, BOD at 10 mg/L, and TSS at 5 mg/L. That is 3–10× tighter than basic GB 8978-1996 secondary standard compliance, and it pushes breweries in water-stressed regions (northern China, inland Spain, southern California) toward MBR or RO polishing trains. Suppliers must also design for peak-to-average flow ratios of 2:1 to 3:1 because CIP and fermentation tank discharges arrive as slug loads rather than steady streams — undersized equalization is the most common cause of biological-stage upset in brewery plants commissioned in the last five years.
Core Process Stages: Screening, Equalization, DAF, Biological, and Polishing
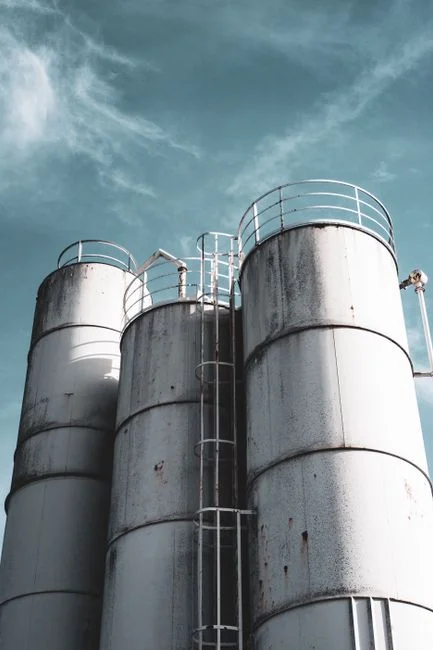
A compliant brewery WWTP runs five sequential stages, and a missing or undersized unit at any point propagates into biological upset, sludge carryover, or discharge-limit exceedance downstream. Stage 1 — coarse screening — uses a GX series rotary bar screen with 3–6 mm aperture to remove grain husks, label fragments, and bottle cap debris that would otherwise blind downstream pumps and DAF nozzles. Stage 2 — equalization — sizes the buffer tank for 8–24 hours of hydraulic retention to flatten CIP slug loads and pH swings, with inline pH/temperature probes feeding a PLC-controlled chemical dosing system that injects lime or CO₂ to hold pH in the 6.5–7.5 range the biological stage tolerates.
Stage 3 — DAF pre-treatment — uses a dissolved air flotation system (capacity range 4–300 m³/h) to remove 70–90% of suspended solids and 60–80% of fats, oils, and grease before the biological reactors, dropping biological loading by 30–50% and protecting downstream biomass from shock. Stage 4 — biological treatment — is where supplier proposals diverge most: anaerobic UASB/IC reactors deliver high-rate COD destruction with biogas recovery, conventional activated sludge (AS) and sequencing batch reactors (SBR) are proven and simple, and MBR membrane bioreactor systems combine activated sludge with membrane separation for compact, high-quality effluent. The current best practice for breweries in the 500–5,000 m³/day range is an anaerobic + aerobic hybrid: UASB/IC upstream for COD destruction and biogas, followed by a polishing aerobic stage for residual organics and ammonia. Stage 5 — polishing and disinfection — uses DF series flat sheet membrane modules with sub-1 μm pore size to deliver near-reuse quality, followed by chlorine dioxide or UV for final microbial control to meet downstream reuse or discharge coliform limits. For related process context, see the Beverage Wastewater Aeration System Design: 2026 Engineering Guide.
Technology Comparison: Anaerobic vs Aerobic vs MBR for Brewery Effluent
Technology choice for brewery effluent is driven by flow size, water cost, and discharge target — and it is the single decision that most reshapes both CAPEX and OPEX. The four leading options are UASB/IC anaerobic, conventional activated sludge (CAS), sequencing batch reactor (SBR), and membrane bioreactor (MBR).
| Parameter | UASB/IC Anaerobic | CAS (Activated Sludge) | SBR | MBR |
|---|---|---|---|---|
| COD removal % | 75–85% | 85–92% | 88–94% | 95–99% |
| Effluent COD (mg/L) | 300–900 | 100–300 | 80–200 | ≤50 |
| Effluent TSS (mg/L) | 100–300 | 20–50 | 20–40 | ≤5 |
| Relative footprint | 0.4× | 1.0× (baseline) | 0.9× | 0.4× |
| Energy demand (kWh/m³) | 0.05–0.15 | 0.5–0.9 | 0.6–1.0 | 0.6–1.2 |
| Biogas yield (m³ CH₄/kg COD) | 0.35–0.45 | — | — | — |
| CAPEX tier | High | Low–Medium | Medium | High |
| OPEX tier | Low (with biogas offset) | Medium | Medium | High |
Biogas recovery from UASB/IC at 0.35–0.45 m³ CH₄ per kg COD removed offsets 50–70% of plant aeration energy at large breweries and can drive net plant energy to near zero when paired with a CHP unit (HydropureWater field data, 2026). MBR's footprint advantage — roughly 60% smaller than CAS at equivalent load — matters on constrained urban brewery sites, and its effluent (TSS ≤5 mg/L, COD ≤50 mg/L) closes the loop to cooling tower or boiler feed without a separate polishing stage. A working selection logic: <500 m³/day brewery → packaged SBR or MBR skid; 500–5,000 m³/day → anaerobic UASB/IC plus aerobic polishing; >5,000 m³/day with high water cost or a reuse mandate → anaerobic UASB/IC plus MBR with biogas CHP. For deeper context on the IFAS process design trade-offs that often sit between these options, see the IFAS working principle and process design 2026 industrial data analysis. For adjacent industry benchmarks, the Winery Effluent Treatment Plant: 2026 Process Design & Buyer's Guide covers a closely related high-strength beverage flow.
How to Vet a Brewery Wastewater Treatment Plant Supplier
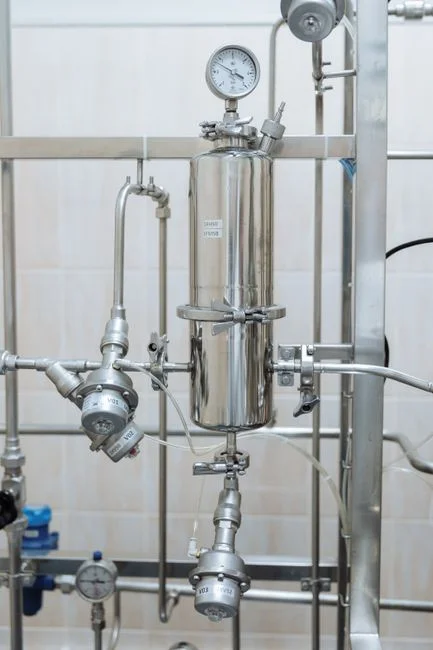
Vetting a brewery WWTP supplier on technical claims alone is how procurement teams end up with undersized equalization tanks and uncommissioned biological stages. Use this eight-criterion scorecard to reduce a long list to three bidders, and weight each criterion 1–5 based on your plant's risk profile.
| # | Criterion | Pass Threshold | Weight (1–5) |
|---|---|---|---|
| 1 | Brewery-specific references | ≥3 installations in last 5 years, brewery effluent | 5 |
| 2 | In-house P&ID and electrical design | Not outsourced; CAD deliverables sample-able | 4 |
| 3 | ISO 9001 + CE/UL certification | Current certificates, audit dates within 24 months | 4 |
| 4 | Factory acceptance test (FAT) capability | Dedicated FAT bay, witnessed test protocol | 4 |
| 5 | On-site commissioning crew | Named lead engineer, brewery commissioning history | 5 |
| 6 | Post-commissioning SLA | ≤48 h response, spare parts in region | 4 |
| 7 | Spare parts inventory in buyer's region | Membranes, blowers, probes stocked locally | 3 |
| 8 | Manufacturing capacity for long-lead items | Reactor internals, membranes deliverable in 16–24 weeks | 4 |
Red flags that should disqualify a supplier regardless of price: no brewery-specific reference they will put in writing, electrical control panel fabrication outsourced to a third party (you lose single-point accountability), and a quote issued before an influent characterization study. The 2026 supply-chain reality is that lead times for European-manufactured anaerobic reactor internals now run 16–24 weeks, and membrane modules from major OEMs sit at similar windows — verify manufacturing capacity and stock of critical long-lead items before signing. Reference visits to operating brewery plants remain the single most reliable qualification method; a half-day walk-through with the plant manager at a comparable brewery will surface commissioning gaps, control system quirks, and OPEX realities that no datasheet reveals. Comparable vendor evaluation logic for adjacent food and beverage flows is laid out in the Snack Food Wastewater Treatment Equipment: 2026 Process & Buyer's Guide.
CAPEX and OPEX Benchmarks for Brewery WWTPs in 2026
Defensible 2026 cost ranges — drawn from recent brewery WWTP bids and HydropureWater project data — let procurement teams validate supplier quotes before issuing an RFQ. CAPEX scales with technology choice: packaged systems run $250–$500 per m³/day, mid-range anaerobic + aerobic turnkey plants run $400–$700 per m³/day, and full anaerobic + MBR trains with biogas utilization run $600–$900 per m³/day (all 2026 USD).
| Plant Configuration | CAPEX (USD/m³/day) | OPEX (USD/m³) | Energy (kWh/m³) | Biogas Offset |
|---|---|---|---|---|
| Packaged SBR / MBR skid (<500 m³/d) | $250–$500 | $0.20–$0.35 | 0.6–1.0 | None |
| Anaerobic (UASB/IC) + aerobic | $400–$700 | $0.08–$0.18 | 0.2–0.4 | 50–70% aeration energy |
| Anaerobic + MBR + CHP | $600–$900 | $0.10–$0.22 | 0.3–0.5 (net after CHP) | Near-net-zero plant |
OPEX for anaerobic-dominant systems with biogas offset runs $0.08–$0.18/m³; fully aerobic MBR systems run $0.18–$0.35/m³. Chemical cost adds 10–20% in high-pH or high-CIP breweries where pH correction and nutrient dosing are continuous. Energy intensity separates the trains sharply: 0.6–1.2 kWh/m³ for aerobic MBR versus 0.2–0.4 kWh/m³ for anaerobic-dominated trains, and biogas CHP can drive net plant energy to near zero at large breweries. For cross-industry cost anchoring, the rendering plant wastewater treatment cost guide places comparable food-industry projects in the $0.4M–$8M bracket, and the municipal sewage treatment plant 2026 price analysis ($5K–$25M) brackets the same scale from a different angle. For MBR-specific cost and adoption trends, see the MBR Market Growth 2026 Outlook: Size, Drivers & Tech Shifts.
Five-Step RFQ and Procurement Workflow
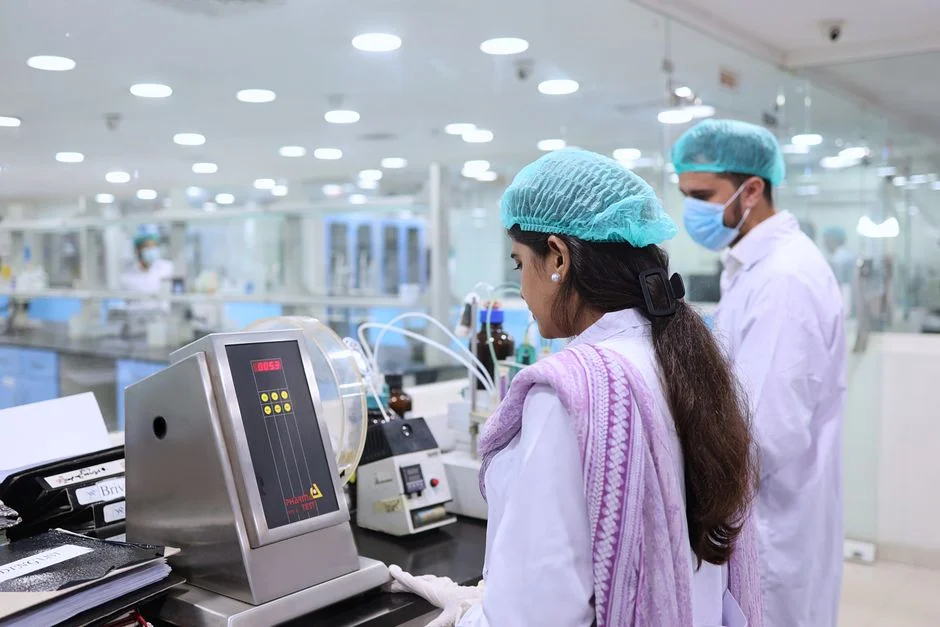
The five-step workflow below converts the supplier scorecard and cost benchmarks into an actionable procurement sequence.
- Influent audit. Collect 7-day composite samples for COD, BOD, TSS, pH, temperature, and flow; include a CIP peak event. Share only with shortlisted suppliers to suppress generic catalog quotes.
- Technical specification. Define design flow (average and peak), discharge limits, reuse targets, available footprint, and utility constraints (power, steam, compressed air). Freeze this document before the bid.
- Supplier long-list and pre-qualification. Apply the 8-criteria scorecard from the vetting section; reduce the long list to three bidders. Request documentary evidence for each criterion.
- Technical and commercial bid evaluation. Weight process performance (40%), CAPEX (25%), OPEX (15%), schedule (10%), and warranty/service (10%). Normalize bids on the same flow basis before comparing.
- Reference visit, contract, FAT, SAT. Visit at least one operating brewery reference. Negotiate liquidated-damages clauses tied to effluent performance. Set factory acceptance test (FAT) and site acceptance test (SAT) milestones with holdback retention through the 12-month warranty period.
Frequently Asked Questions
What is the average cost of a brewery wastewater treatment plant in 2026?
Packaged skids run $250–$500 per m³/day, mid-range anaerobic + aerobic turnkey plants run $400–$700 per m³/day, and full anaerobic + MBR with biogas utilization runs $600–$900 per m³/day (2026 USD). A 1,000 m³/day plant therefore lands in the $400K–$900K CAPEX range depending on technology choice.
What is the best biological treatment for brewery effluent?
For breweries of 500–5,000 m³/day, anaerobic UASB/IC followed by aerobic polishing is the current best practice, delivering 75–85% COD destruction upstream and biogas recovery of 0.35–0.45 m³ CH₄ per kg COD removed. Smaller plants typically use packaged SBR or MBR skids; details on the biological stage options are covered above with the MBR membrane bioreactor system as one leading compact option.
What effluent quality is achievable for reuse?
MBR polishing with sub-1 μm DF series flat sheet membrane modules delivers COD ≤50 mg/L, BOD ≤10 mg/L, and TSS ≤5 mg/L — meeting China GB/T 18920-2020 reuse thresholds for cooling tower makeup and boiler feed at most breweries.
What is the typical payback on anaerobic biogas recovery?
UASB/IC biogas offsets 50–70% of plant aeration energy at large breweries, and at sites with CHP utilization the simple payback on the anaerobic premium typically falls in the 3–6 year range, depending on local electricity tariffs and biogas yield.
How long does a brewery WWTP installation take?
From contract signing to commissioned operation, a turnkey 500–5,000 m³/day brewery WWTP typically takes 9–14 months, with European-sourced anaerobic reactor internals and membrane modules on 16–24 week lead times as the long-pole items in the 2026 supply chain.