What Makes Snack Food Wastewater Different from Generic Food Effluent
Snack effluent is not brewery or dairy wastewater, and treating it with municipal-style equipment is the most common cause of foam events, MLSS washout, and failed BOD5 compliance. Fryer condensate arrives at 60–80 °C carrying 500–3,000 mg/L of emulsified oil, free fatty acids, and Maillard-reaction melanoidins — brown recalcitrant polymers that resist standard activated sludge. The seasoning-coating wash stream is the second shock: suspended starch and protein from batter, plus salt and MSG, generate hydraulic peaks of 3–5× average daily flow during a flavor changeover. A typical snack plant effluent runs 2,000–15,000 mg/L COD, 500–3,000 mg/L TSS, and 200–1,500 mg/L oil & grease, with a BOD/COD ratio of 0.4–0.55 — well below the 0.6+ seen in brewery and dairy (HydropureWater field data, 2026). That low ratio is the diagnostic flag: it means the carbon is partially refractory, and biological treatment alone will not close the loop without fats, oils, and grease (FOG) removal upstream. Skip the dissolved air flotation (DAF) system and the aeration basin foams within hours, scours biomass off the media, and sheds 30–50% of mixed liquor suspended solids during a slug load.
Standard Process Flow for a Snack Plant Effluent Train
The six-step train below is the 2026 baseline for any plant discharging to sewer or reusing water on-site. Each step has a defined hydraulic envelope and a removal target; engineers can hand the sequence to a draftsperson as a PFD starter.
- Rotary mechanical bar screen — 3–6 mm openings, sized for peak instantaneous flow; removes packaging film, potato peel, corn solids, and seasoning agglomerates that would otherwise blind downstream equipment.
- Equalization tank — 8–24 hours HRT to damp CIP and fryer-cleanout surges; aerobic mixing with coarse-bubble diffusers keeps TSS in suspension and prevents short-circuiting to biology.
- Dissolved air flotation (DAF) — micro-bubble 20–80 μm, surface loading 5–15 m/h, recycle 20–50% of throughput; target removal 90–95% oil & grease and 70–85% TSS before any biological reactor.
- Biological stage — anaerobic BVF or UASB for plants above 200 m³/d (organic loading 2–6 kg COD/m³·d, biogas yield 0.30–0.45 m³/kg COD), or MBBR for smaller plants; both protect downstream membranes from FOG fouling.
- MBR membrane bioreactor — 0.1 μm PVDF flat-sheet membrane module operating at 8,000–12,000 mg/L MLSS; produces <50 mg/L COD and <10 mg/L TSS with 60% of the footprint of a conventional activated-sludge + clarifier train.
- Disinfection — chlorine dioxide or UV to meet EPA and EU microbiological targets for either discharge or reuse.
Two upstream caveats drive the order. First, an automatic rotary mechanical bar screen must precede DAF; without it, peel and starch lumps clog the recycle pump and float-cell scraper. Second, equalization must precede DAF, not follow it — once oil is emulsified into the DAF effluent, downstream biology cannot recover the design loading rate. The compact MBR membrane bioreactor system is normally delivered as a skid integrating anoxic, aerobic, and membrane tanks, with the final chlorine dioxide disinfection generator sized for ≥30 minutes contact time at CT 1.6 mg·min/L.
Key Equipment Parameters Engineers Must Lock In
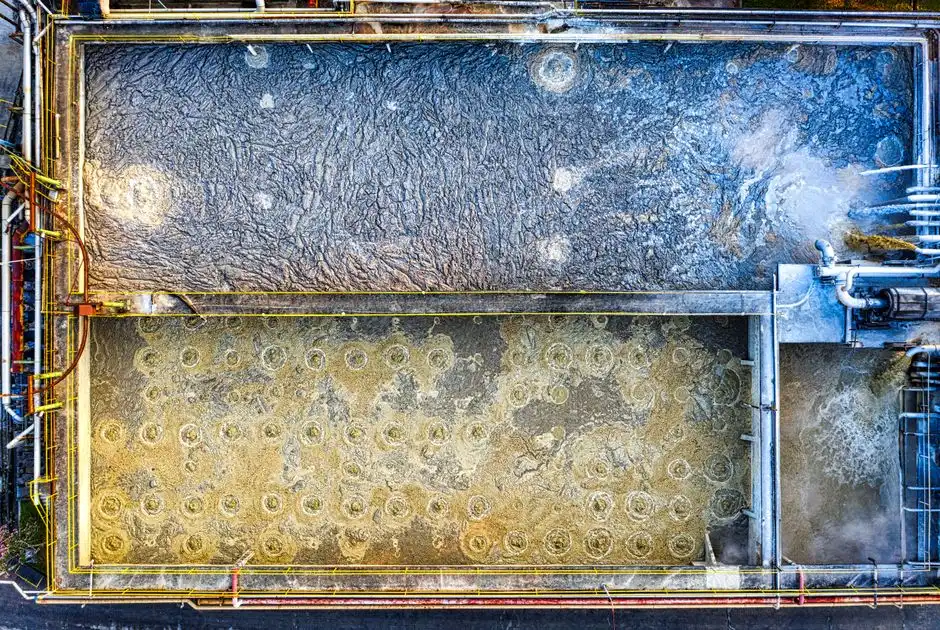
These are the spec lines a procurement engineer should paste directly into a 2026 RFQ. Anchor each to a verifiable operating range, not a marketing claim.
| Unit Operation | Parameter | 2026 Design Range | Notes |
|---|---|---|---|
| DAF | Air-to-solids ratio | 0.005–0.02 mg air/mg TSS | Lower bound for high-TSS snack streams |
| DAF | Surface loading | 5–15 m/h | 15 m/h cap for oily streams |
| DAF | Recycle rate | 20–50% of throughput | Drives micro-bubble density |
| MBR module | Membrane area | 80–225 m² per cassette | PVDF flat-sheet, 0.1 μm nominal |
| MBR module | Flux | 10–20 L/m²·h | 10–15 L/m²·h at peak FOG load |
| MBR module | MLSS | 8,000–12,000 mg/L | Higher than CAS to cut tank volume |
| Chemical dosing | PAC / polymer / antifoam | 50–150 / 1–5 / 1–3 mg/L | PLC-controlled skid cuts overdose 15–25% |
| Lamella clarifier | Surface loading | 20–40 m/h | Replaces conventional clarifier, 30% polymer reduction |
| ClO₂ generator | Capacity | 50 g/h compact to 20 kg/h industrial | CT 1.6 mg·min/L, ≥30 min contact |
The dosing skid is the most underestimated line item. A PLC-controlled coagulant and polymer dosing system with flow-paced injection will hold coagulant use within ±5% of setpoint, while manual dosing routinely drifts 20–30% high and inflates sludge yield. For plants chasing the lowest polymer consumption, a high-efficiency lamella sedimentation tank ahead of DAF reduces polymer demand by roughly 30% and protects the MBR flat-sheet membrane module from inorganic fouling.
Anaerobic vs. Aerobic Train: Which Fits Your Plant?
Three biological configurations dominate 2026 snack plant specs. The decision hinges on plant flow, electricity price, and whether the project must hit a water-reuse target.
| Train | COD Removal | Energy (kWh/m³) | Footprint vs. CAS | Biogas | Best-Fit Plant |
|---|---|---|---|---|---|
| Anaerobic BVF / UASB | 80–95% | 0.10–0.20 | ~50% | 0.30–0.45 m³/kg COD | >200 m³/d, electricity <$0.08/kWh |
| MBR (aerobic) | 90–97% | 0.45–0.70 | ~60% | None | Any size with reuse mandate |
| MBBR (hybrid) | 60–80% | 0.25–0.40 | ~75% | None | 50–200 m³/d, moderate limits |
Anaerobic BVF (Buoyant Filter) or UASB delivers the lowest OPEX in kWh terms and produces a usable biogas stream — but it always needs a downstream polish. Pair anaerobic with an MBR membrane bioreactor system to reach <50 mg/L COD for either reuse or tight discharge consent. MBBR alone is the right answer for the 50–200 m³/d band when the discharge consent is <150 mg/L COD and capital is the binding constraint. Below 50 m³/d, packaged DAF + MBR skids almost always win on footprint, control simplicity, and reuse compatibility — even at slightly higher kWh/m³.
2026 CAPEX and OPEX Ranges by Plant Size
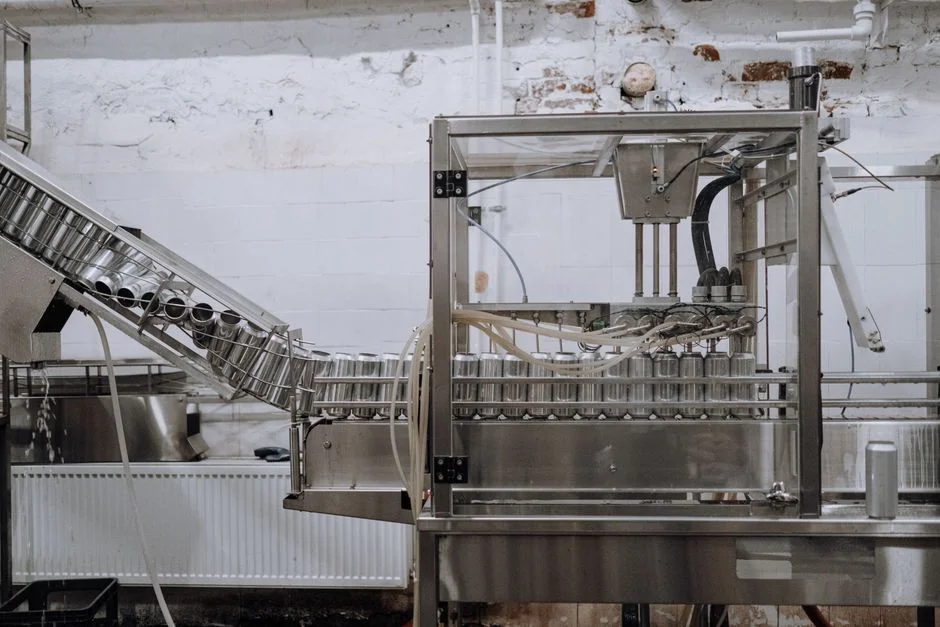
Numbers below are turnkey, including civil, installation, and commissioning. OPEX assumes electricity at $0.10/kWh, labor $8/h, and polymer at $3.50/kg. The 2026 cost band has widened 8–12% versus 2024 due to stainless and membrane-grade PVDF price escalation (HydropureWater field data, 2026).
| Plant Size | Train | CAPEX (USD) | OPEX (USD/m³) | Notes |
|---|---|---|---|---|
| 20–50 m³/d | Packaged DAF + MBR skid | 180,000–420,000 | 0.45–0.95 | Containerized, 4–6 week install |
| 50–200 m³/d | DAF + MBBR or MBR | 450,000–1,100,000 | 0.35–0.70 | MBR for reuse; MBBR for discharge |
| 200–500 m³/d | DAF + Anaerobic BVF + MBR polish | 1,200,000–1,800,000 | 0.28–0.55 | Biogas credit 0.05–0.10 USD/m³ |
| All sizes | Sludge handling add-on | +40,000–260,000 | +0.04–0.09 | Plate & frame press, 1–500 m² |
The OPEX delta between a 200 m³/d plant running MBR-only and one running anaerobic + MBR polish is roughly $0.12/m³ in favor of anaerobic, and the biogas credit extends that further when the digester is heated by recovered fryer exhaust. A plate and frame filter press for sludge dewatering is the standard add-on; without it, sludge hauling can swing OPEX by 20–30%.
Matching Equipment to Snack Sub-Type
Sub-type matters more than plant size for the upfront equipment spec. The table below ties the dominant stream characteristic to the unit operations that should be prioritized.
| Snack Sub-Type | Dominant Stream | Influent Flags | Recommended Train |
|---|---|---|---|
| Fried chips (potato, tortilla) | Fryer condensate | 1,000–1,500 mg/L oil & grease, melanoidins | Oversized DAF with oil-skimming hood + Anaerobic + MBR |
| Puffed corn / extruded | Starch cook water | 200–500 mg/L oil, high starch | Fine screening + MBBR or MBR alone |
| Coated nuts, seasoning line | Salt & TSS wash | Peaks 3–5× average flow | Equalization + lamella clarifier + DAF + MBBR |
| Sauce mixer, condiment rinse | Sugar / organic acid | High BOD, low oil | Full MBR train with denitrification |
For a coated-nut line, the lamella clarifier protects the DAF from salt-driven coagulation failure; salt above 2,000 mg/L depresses floc formation and polymer demand rises sharply without that upstream buffer.
2026 Compliance and Water-Reuse Considerations
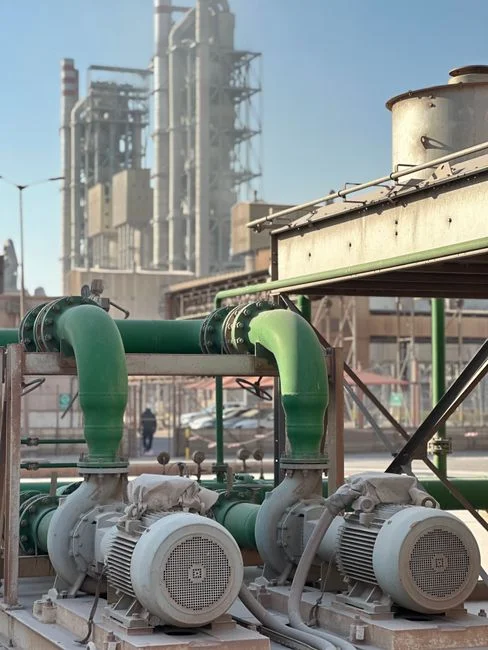
Three regulatory anchors now drive equipment selection for snack plants in 2026. U.S. EPA Effluent Guidelines at 40 CFR Part 407 cap BOD5 at 26 mg/L daily max and TSS at 31 mg/L daily max for direct-discharge snack-food lines. EU Regulation 2020/741 sets microbial limits of E. coli ≤10 CFU/100 mL for any water reused on-site, which only MBR + ClO₂ or UV combinations reliably hit. Corporate Scope-3 water targets now dominate the boardroom case for upgrades — frame MBR reuse as a Scope-3 reduction of 30–60% per metric ton of product, not a compliance cost. A chlorine dioxide disinfection generator sized at 1.5× the average reuse flow is the typical 2026 spec to hold the CT above 1.6 mg·min/L during peak demand.
Frequently Asked Questions
Q1: What influent COD is typical for snack food wastewater?
A: 2,000–15,000 mg/L COD with 200–1,500 mg/L oil & grease. A dissolved air flotation (DAF) system is mandatory as the first biological step; without it, oil emulsions carry over and foul membranes within weeks.
Q2: How much does a 100 m³/d snack wastewater plant cost in 2026?
A: $450,000–$1.1 million CAPEX for a turnkey DAF + MBBR or MBR train; OPEX runs $0.35–$0.70/m³. Add $40,000–$90,000 for a plate and frame filter press for sludge dewatering.
Q3: Can MBR effluent be reused directly in a snack plant?
A: Yes. MBR followed by ClO₂ or UV meets EU 2020/741 reuse limits for cooling-tower make-up and CIP rinse. See the water reuse 2026 trends and ROI guide for plant-specific payback.
Q4: Is anaerobic digestion worth it for a small snack line?
A: Below 200 m³/d, payback drops sharply because biogas volume cannot cover the digester CAPEX; aerobic MBBR or MBR is usually cheaper and simpler to operate. For starch-dominant lines, the starch wastewater recycling system engineering guide compares the MBBR vs. MBR economics directly. For control architecture, the PLC control for food processing wastewater plants guide walks through the 2026 instrumentation spec, and engineers sizing biological reactors can reference the MBBR design and engineering guide for the moving-bed biofilm math.