Why Starch Wastewater Needs a Dedicated Recycling System
A starch wastewater recycling system in 2026 is an integrated four-stage train — pre-concentration/screening, anaerobic digestion (UASB/IC/EGSB), aerobic polishing (MBR or A/O + DAF), and RO reuse — designed to drop influent COD from 8,000–25,000 mg/L to <50 mg/L and recover 60–80% as in-process water. MBR effluent is typically reused for cooling, washing, or boiler feed, reducing freshwater intake by up to 70%.
Corn, cassava, and wheat starch lines generate a high-strength stream that municipal treatment plants were never designed to handle: COD typically lands at 8,000–25,000 mg/L, TSS at 2,000–10,000 mg/L, with a BOD/COD ratio of 0.4–0.6 and elevated sulfate from the steep liquor. The economic pain is concrete. 2026 effluent surcharges in China and Southeast Asia run $0.30–$1.20/m³, and freshwater intake in arid regions costs $0.50–$2.00/m³ — together pushing a 1,000 m³/day plant past $500K/year in avoidable outflow. That arithmetic drives 2–4 year payback on a retrofit and explains why 2026 is seeing tightened local standards: provincial rules increasingly cap discharge COD at <50 mg/L, and EU BAT-AEL for the food sector is pushing Total Suspended Solids to <35 mg/L. Customer audit pressure on water reuse in food supply chains is now a procurement requirement, not a sustainability line item. The rest of this article delivers the four-stage train that turns 60–80% of that effluent back into reusable in-process water.
Starch Wastewater Influent Characteristics by Sub-Sector
Cassava and corn starch lines produce wastewater with similar peaks but very different fingerprints, and the difference dictates reactor choice downstream. Cassava lines trend higher in COD (15,000–25,000 mg/L) and carry trace cyanide from the root; corn lines trend higher in sulfate (often 600–1,200 mg/L) and soluble protein. Wheat and potato starch sit in between on organics but run cooler, which changes anaerobic OLR ceilings.
| Sub-sector | COD (mg/L) | BOD (mg/L) | TSS (mg/L) | pH | TKN (mg/L) | SO₄²⁻ (mg/L) |
|---|---|---|---|---|---|---|
| Corn starch | 8,000–18,000 | 4,000–10,000 | 2,000–6,000 | 4.0–6.5 | 150–400 | 600–1,200 |
| Cassava starch | 15,000–25,000 | 7,000–14,000 | 3,000–10,000 | 3.8–5.5 | 200–500 | 100–400 |
| Wheat starch (A-line) | 10,000–20,000 | 5,000–11,000 | 4,000–8,000 | 4.5–6.8 | 300–700 | 300–700 |
| Potato starch | 6,000–14,000 | 3,500–8,000 | 2,500–6,000 | 5.0–7.0 | 180–450 | 150–500 |
Batch variability is the parameter that breaks underdesigned equalization tanks: a single plant can swing 50–200% in COD within a week as steep-water and wash-water cycles overlap (HydropureWater field data, 2026). Most starch effluent also discharges hot — 35–55°C — which is an opportunity for mesophilic anaerobic operation at 35±2°C, but a hard ceiling for standard MBR membranes rated only to 40°C. Cassava lines in the upper end of that range demand a PVDF flat sheet module rated explicitly for 40°C continuous duty, or membrane integrity loss shows up inside 18 months. Equalization should be sized for 8–12 h HRT to flatten these peaks before they reach the anaerobic reactor.
The 2026 Four-Stage Process Train: Pre-Concentration, Anaerobic, Aerobic, Reuse
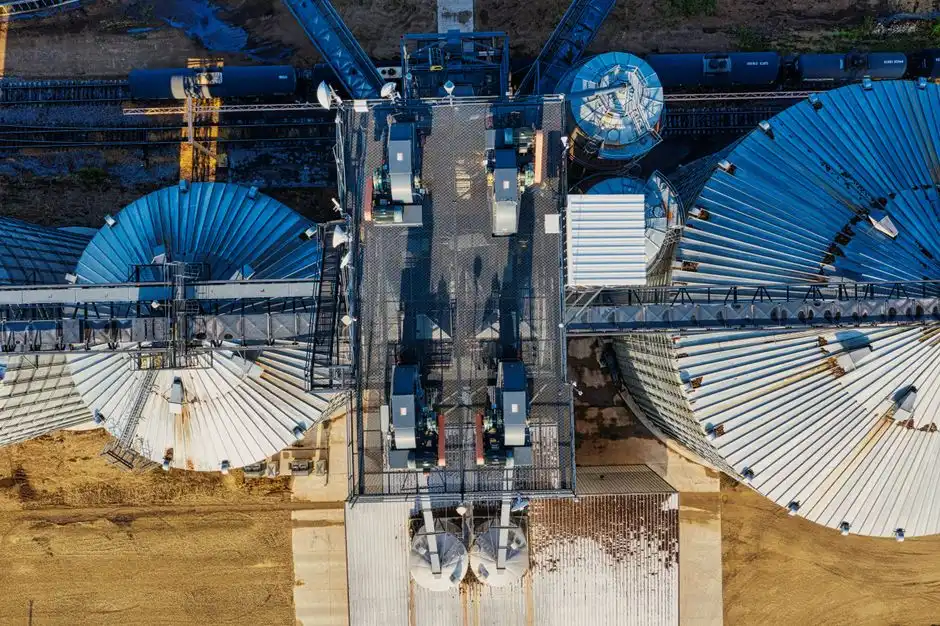
The train that consistently hits <50 mg/L COD at the lowest $/m³ is staged as pre-concentration, anaerobic, aerobic polishing, and reuse polishing. Each stage has hard numbers attached.
Stage 1 — Pre-concentration and starch recovery. A rotary drum screen (60–120 mesh) followed by a DAF system for starch wastewater pre-concentration removes settleable solids and floatable protein before biological treatment. DAF units in this duty run 4–300 m³/h; with proper polymer dosing they capture 30–60% of incoming BOD as recoverable solids — material that is saleable back to the process rather than hauled off as waste (HydropureWater field data, 2026).
Stage 2 — Anaerobic. UASB, IC, or EGSB reactors at 35±2°C, HRT 18–36 h, OLR 8–15 kg COD/m³/day, achieving 75–90% COD removal. Biogas yield typically lands at 0.30–0.45 m³ CH₄ per kg COD removed, worth $0.05–$0.12/kWh thermal in 2026.
Stage 3 — Aerobic polishing. A/O, A²O, SBR, or MBR. An MBR system for starch wastewater polishing with a PVDF flat sheet membrane module at MLSS 8,000–12,000 mg/L delivers <50 mg/L COD and <5 mg/L TSS in a footprint roughly 40% smaller than SBR. For nitrification, SRT is held at 25–40 days.
Stage 4 — Reuse polishing. Multi-media filter plus RO unit for starch plant water reuse for boiler or food-contact applications, or chlorination/UV for cooling-tower make-up. Reuse thresholds (COD ≤30 mg/L, turbidity ≤5 NTU) follow GB/T 19923-2005. Sludge from DAF and MBR waste is sent to a filter press for starch wastewater sludge with a cake dryness target of ≥22% for off-site disposal.
| Stage | Equipment | Key parameters | Effluent target |
|---|---|---|---|
| 1. Pre-concentration | Rotary screen + DAF | 4–300 m³/h; 30–60% BOD recovery | TSS <800 mg/L |
| 2. Anaerobic | UASB / IC / EGSB | HRT 18–36 h; OLR 8–15 kg COD/m³/d; 35±2°C | COD 1,500–4,000 mg/L |
| 3. Aerobic / MBR | A/O, SBR, or MBR | MLSS 8,000–12,000 mg/L; SRT 25–40 d | COD <50 mg/L; TSS <5 mg/L |
| 4. Reuse polishing | MMF + RO (or UV) | RO recovery 65–75%; flux 15–25 L/m²/h | COD ≤30 mg/L; turbidity ≤5 NTU |
Choosing the Right Reactor: UASB vs IC vs EGSB and SBR vs MBR vs A²O
Reactor choice is where most starch-plant retrofits either win or burn CAPEX. The headline trade-offs:
Anaerobic. UASB has the lowest CAPEX but needs 10–12 m reactor height and a competent granulation startup; for brownfield sites with height limits, that is often a deal-breaker. IC (Internal Circulation) is more compact at 14–18 m total height and is well matched to 8,000–25,000 mg/L COD, which is exactly the cassava and wheat window. EGSB (Expanded Granular Sludge Bed) is the pick for low-strength or post-DAF effluent where HRT can drop to 4–6 h and upflow velocities of 6–10 m/h are acceptable.
Aerobic. SBR is the simplest, batch-flexible, with the lowest OPEX of the three and the largest footprint. A²O is the right call when total-N discharge limits drop below 15 mg/L. MBR carries ~30% higher CAPEX than SBR, but offsets that with a 20% lower sludge yield, the smallest footprint, and the best effluent for downstream RO. The capital premium is recovered inside 3–4 years on any plant with reuse as a stated goal.
Decision rule of thumb. Flows <300 m³/day → SBR + DAF + RO. Flows 300–2,000 m³/day → MBR. High reuse target → mandatory MBR + RO. Total-N <15 mg/L required → A²O/MBR hybrid. For high-temperature cassava lines (45–55°C), recommend IC + MBR with PVDF membranes rated to 40°C, paired with a cooling loop or a post-anaerobic cooling stage to protect membrane integrity.
| Reactor | Footprint | Energy (kWh/m³) | COD removal | Relative CAPEX | Best fit |
|---|---|---|---|---|---|
| UASB | Medium | 0.05–0.10 | 75–85% | Low (baseline) | Steady, lower-strength streams |
| IC | Small | 0.08–0.15 | 80–90% | Medium (+20%) | 8,000–25,000 mg/L COD |
| EGSB | Small | 0.10–0.18 | 80–90% | Medium (+15%) | Post-DAF, low-strength |
| SBR | Large | 0.30–0.50 | 90–95% | Low | <300 m³/day, discharge-only |
| A²O | Medium | 0.35–0.55 | 90–95% | Medium | TN <15 mg/L required |
| MBR | Small | 0.40–0.65 | 95–98% | High (+30%) | Reuse target, tight footprint |
2026 CAPEX and OPEX Benchmarks by Plant Size
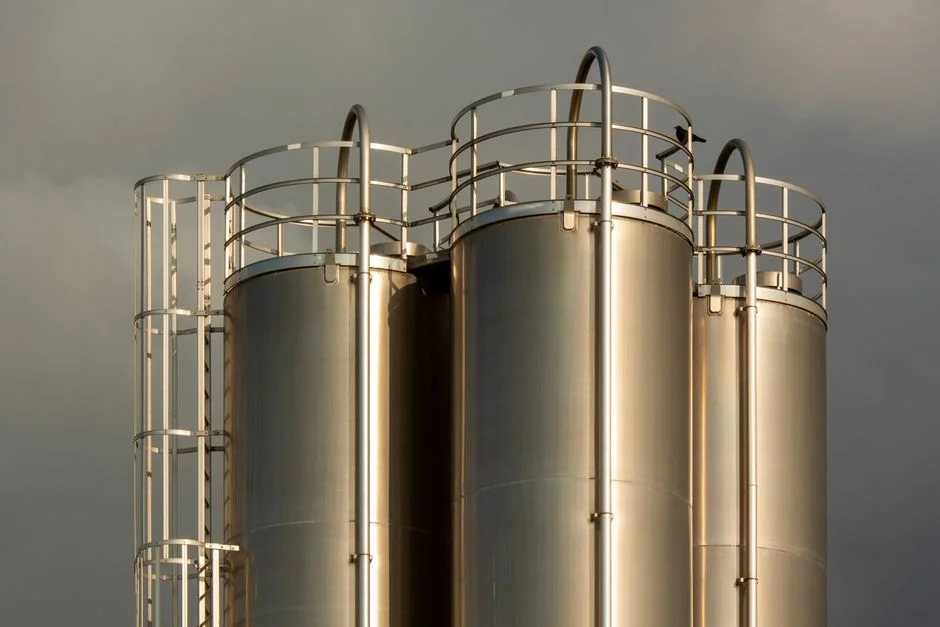
Vendor quotes for starch wastewater recycling systems in 2026 sit in well-defined bands. A 100 m³/day turnkey line runs $180K–$420K; 500 m³/day lands at $480K–$1.2M; 2,000 m³/day at $2.1M–$4.8M; a 5,000 m³/day turnkey system with full ZLD runs $6M–$14M. OPEX for an MBR + RO scheme is $0.85–$1.40/m³; SBR + sand filter runs $0.55–$0.95/m³. Energy dominates OPEX at 35–45%, with aeration and the RO high-pressure pump as the two largest line items; the automatic chemical dosing for coagulation and pH control adds another 8–12%.
Sludge handling is the line item engineers routinely under-budget. A starch line produces 1.8–2.4 kg dry solids per 1,000 L of influent at 20% dryness — a 1,000 m³/day plant therefore generates 1.8–2.4 t DS/day, or roughly 9–12 t wet cake after a filter press. Hauling at $40–$80/t wet is $360–$960/day, which has to be in the OPEX envelope, not tacked on later.
| Plant size | CAPEX (USD, 2026) | OPEX ($/m³) | 10-yr TCO envelope |
|---|---|---|---|
| 100 m³/day | $180K–$420K | $0.85–$1.40 (MBR+RO) | $0.5M–$0.9M |
| 500 m³/day | $480K–$1.2M | $0.70–$1.15 | $1.8M–$3.5M |
| 2,000 m³/day | $2.1M–$4.8M | $0.55–$0.95 | $6.0M–$11.0M |
| 5,000 m³/day (ZLD) | $6M–$14M | $0.95–$1.60 | $22M–$45M |
ROI math is straightforward: a 1,000 m³/day plant replacing 70% freshwater at $1.20/m³ and avoiding $0.60/m³ in effluent surcharges recovers roughly $590K/year. At 2026 CAPEX of $1.5M–$2.5M for a 1,000 m³/day turnkey MBR + RO system, payback lands at 2.5–4.0 years; a 2,000 m³/day plant with the same logic returns 2.0–3.0 years.
Compliance and Water-Reuse Standards in 2026
Three regulatory frameworks dominate procurement specs for 2026 retrofits.
China. GB 8978-1996 remains the base reference, but provincial tightening in Shandong, Henan, and Guangxi is pushing COD limits below 50 mg/L for new and expanded lines. Industrial reuse thresholds follow GB/T 19923-2005: COD ≤30 mg/L, turbidity ≤5 NTU. Reuse for cooling-tower make-up typically adds a chlorine residual target of 0.3–0.5 mg/L — handled reliably by a chlorine dioxide generator for water reuse disinfection downstream of the RO.
European Union. Industrial Emissions Directive 2010/75/EU and the BAT-AEL for the food, drink, and milk industries set the discharge envelope. Where reuse is in scope, EU Regulation 2020/741 minimum requirements apply for water reuse in agriculture and most industrial contexts.
United States. EPA effluent guidelines at 40 CFR Part 405 cover grain processing. For food-contact reuse, the practical threshold is WHO guidance — <10 CFU/100 mL E. coli and no detectable pathogens — which forces RO + UV or ozone into the polish train.
Selecting a Supplier and Avoiding Common Engineering Mistakes
Most recycling retrofits fail on five recurring engineering mistakes, not on equipment quality.
Mistake 1 — Undersized equalization. With 50–200% COD swings in a week, an equalization tank at 4 h HRT will pass the spikes straight to the anaerobic reactor and kill granulation. Specify 8–12 h HRT.
Mistake 2 — Skipping starch recovery. Leaving 30–60% of revenue-generating solids in the wastewater is a pure economic loss. A DAF and rotary screen pre-step changes plant economics inside the first operating quarter (HydropureWater field data, 2026). For an industrial perspective on integrating DAF into a four-stage train, see this DAF troubleshooting guide for industrial wastewater.
Mistake 3 — Wrong membrane rating. Standard MBR membranes rated to 40°C fail inside 18 months on a 45–55°C cassava line. Specify PVDF 0.1 μm flat sheet, MLSS 8,000–12,000 mg/L, with explicit 40°C continuous-duty certification. For 2026 sizing data, see the 2026 MBR market data and forecast and the RO system process and design guide.
Mistake 4 — Ignoring sludge. A 1,000 m³/day line generates 6–8 t DS/day. Specify the plate-and-frame press early; retrofits added after commissioning cost 30–50% more.
Mistake 5 — Buying on CAPEX only. Over a 10-year TCO, energy and chemical dosing are 50–60% of lifecycle cost. A lower-CAPEX SBR scheme often costs more than MBR once reuse and sludge handling are priced in.
Frequently Asked Questions
What COD removal can a starch wastewater recycling system achieve? A properly staged train (pre-concentration + anaerobic + MBR + RO) removes 95–99% of COD, taking a 15,000 mg/L influent to <50 mg/L and, after RO, to <30 mg/L for reuse.
How much does a starch wastewater recycling system cost in 2026? CAPEX runs $180K–$14M by plant capacity (100–5,000 m³/day), with OPEX of $0.85–$1.40/m³ for an MBR + RO scheme and $0.55–$0.95/m³ for SBR + sand filter.
Is the treated water safe to reuse in a food starch plant? Yes — MBR + RO + UV meets WHO reuse thresholds (<10 CFU/100 mL E. coli, no detectable pathogens) for food-contact and boiler-feed duty.
How long does payback take? A 1,000 m³/day plant replacing 70% freshwater and avoiding effluent surcharges typically sees 2.5–4.0 year payback at 2026 freshwater and discharge pricing; a 2,000 m³/day plant compresses that to 2.0–3.0 years.
Which is better for a 1,000 m³/day starch plant, SBR or MBR? MBR is the right call when reuse is the target (smaller footprint, better effluent, lower sludge yield). SBR wins on CAPEX and OPEX when the plant only needs to meet discharge compliance.