Why Beverage Wastewater Breaks Standard Aeration Designs
Beverage wastewater aeration systems fail when designers transplant municipal assumptions into a high-strength, high-temperature, shock-loaded stream — and the failure shows up first as chronic diffuser fouling and DO sag, not as a missed effluent number. Brewery, soft-drink, and bottling plant effluents run BOD 1,500–4,000 mg/L, COD 3,000–8,000 mg/L, and TSS 200–1,500 mg/L, with BOD:N:P ratios that often fall below 100:5:1 because nitrogen and phosphorus are scarce relative to fermentable sugars. CIP (clean-in-place) discharges push temperature to 25–40 °C and pH to 3–12, which depresses the alpha factor (wastewater-to-clean-water oxygen transfer ratio) to 0.5–0.7 and shifts the saturation concentration C* downward at elevated temperature even as BOD loading spikes. Without equalization for pH and temperature, the aeration basin cannot hold a stable F/M ratio, and the biomass either washes out or foams.
Sugar-rich streams are particularly prone to rapid diffuser fouling and stable foam blankets that cap oxygen transfer. The practical response is staged hardware: coarse-bubble or jet aeration in the equalization/pre-aeration zone where shock loads and foam are worst, and fine-bubble EPDM membrane diffusers only in the downstream aerobic zone where the waste is more uniform. Research on biohydrogen production from beverage industrial wastewater using bioaugmentation with facultative anaerobic strains (Kumar et al., as reviewed in the top-ranked biohydrogen study) confirms that beverage streams degrade readily under staged anaerobic-aerobic configurations, which is the same logic that supports a two-stage aeration train rather than a single well-mixed basin.
| Parameter | Typical beverage WW range | Municipal WW (reference) | Design implication |
|---|---|---|---|
| BOD (mg/L) | 1,500–4,000 | 150–400 | Aeration basin 4–8× larger per m³ flow |
| COD (mg/L) | 3,000–8,000 | 300–800 | Pre-aeration/equalization mandatory |
| TSS (mg/L) | 200–1,500 | 100–350 | Pre-screening with a rotary mechanical bar screen and DAF pre-treatment |
| Temperature (°C) | 25–40 (CIP surges) | 10–25 | Alpha correction required; C* recalc |
| pH | 3–12 (CIP surges) | 6.5–8.0 | Equalization + pH correction upstream |
| BOD:N:P | 100:2–5:0.5–1 | 100:20:5 | Nutrient supplementation typically required |
Designers should treat the equalization basin — not the aeration tank — as the buffer that protects the diffuser grid. For a defensible effluent basis, align local discharge limits against the 2026 brewery wastewater discharge standard before any hardware selection. OPEX framing should reference the dairy wastewater OPEX benchmark as a conservative proxy for food-stream energy intensity, since dairy and beverage plants share CIP-driven thermal and organic loading profiles.
Aeration Tank Geometry and Hydraulic Design
Tank geometry sets the floor on diffuser performance: a poorly proportioned basin can halve effective SOTE before any equipment decision is made. For fine-bubble diffuser tanks, the width-to-length ratio should sit between 1:2 and 1:4, with water depth 4–6 m to keep diffuser submergence in the 25–40% SOTE range and freeboard 0.5–0.8 m to contain the foam blanket that consistently forms over high-sugar mixed liquor. Roll-call or serpentine inlet-outlet patterns produce near-plug-flow contact time and prevent short-circuiting; a perfectly square tank with a single inlet and outlet will not, regardless of diffuser density. For jet aeration, the tank can be deeper (5–8 m) and more compact because the jet nozzle drives bulk mixing independently of the diffuser grid layout, which is one reason jet systems are favored in tight brownfield retrofits.
Hydraulic retention time is the second geometry decision. HRT = V/Q should land at 6–24 h for conventional beverage activated sludge, with the upper end of that range used when influent BOD exceeds 3,000 mg/L or when effluent COD limits fall below 500 mg/L. SBR (sequencing batch reactor) fill phases run shorter (1–4 h fill, 2–6 h react), and MBBR aerobic zones typically run 4–10 h depending on carrier fill fraction. Baffle and wall-clearance details are unglamorous but consequential: maintain a minimum 0.3 m clearance between the tank wall and the outer row of fine-bubble diffusers, and avoid placing diffusers directly under the influent pipe, where influent short-circuits across the surface before mixing.
For sites with limited footprint, packaged underground integrated sewage treatment units can serve as a pre-aeration or equalization stage ahead of the main aeration basin, particularly in beverage plants where head-of-works space is consumed by CIP skid and bottling line utilities. The geometry decisions made here propagate directly into blower sizing in the next section.
Diffuser and Aerator Technology Selection
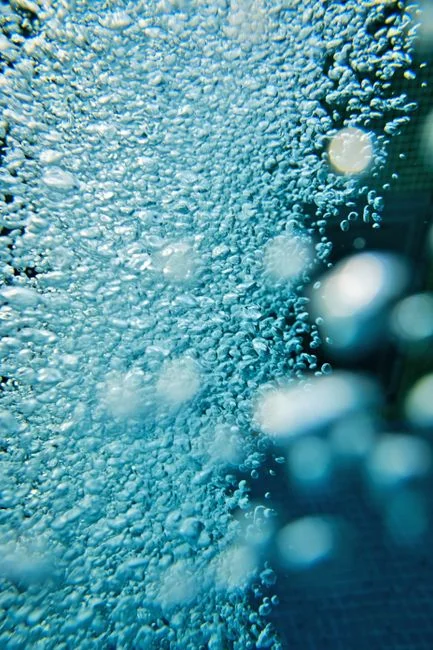
Diffuser selection is the single largest lever on aeration OPEX, and it is where most vendor pitches overstate performance. Fine-bubble EPDM membrane disc or tube diffusers deliver 25–40% SOTE at 4–6 m submergence, with a single disc typically handling 0.3–0.5 m³/h of air at standard conditions — they are the right answer for large (>500 m³) aeration basins with relatively uniform loading, but they are vulnerable to fouling from fats, oils, and starches that survive pre-treatment in beverage streams. A documented cleaning regime is part of the spec: in-situ acid wash (typically 10% hydrochloric or citric, 2–4 h soak) every 3–6 months, with membrane replacement on a 5–7 year cycle. Coarse-bubble diffusers sacrifice SOTE (10–18%) but compensate with mechanical reliability and tolerance of fouling; they are the right primary choice in equalization zones and a sound backup to fine-bubble grids in the main aerobic zone.
Jet aeration, as positioned by custom aeration system vendors serving large industrial and municipal sites, sits at 25–35% SOTE with mixing performance that no diffuser grid can match. For beverage plants with BOD above 3,000 mg/L, temperatures consistently above 30 °C, or CIP surges that arrive several times per day, jet systems are usually the lowest-risk hardware choice even though published energy-efficiency claims are vendor-sourced and should be verified against site-specific alpha-factor testing. Mechanical surface aerators remain a legacy option: lower capital cost, but poor oxygen transfer below 5 °C, high visual impact, and vulnerability to wind-driven cooling in open tanks make them a poor fit for a beverage plant co-located with production.
Blower sizing ties directly to diffuser choice. Fine-bubble grids typically need 30–80 Nm³ air per kg BOD removed; coarse-bubble grids need 50–120 Nm³/kg. These ranges assume alpha 0.6–0.8 and beta 0.95 — if on-site alpha testing shows values below 0.5, the airflow figure must increase proportionally. The rotary mechanical bar screen for beverage plant headworks protects downstream diffusers by removing rags and labels that would otherwise accumulate on the grid.
| Technology | SOTE (clean water, 4–6 m) | Air demand per kg BOD | Fouling tolerance | Best fit in beverage WW |
|---|---|---|---|---|
| Fine-bubble EPDM disc/tube | 25–40% | 30–80 Nm³ | Low–medium (CIP cleaning required) | Main aerobic basin, BOD < 3,000 mg/L |
| Coarse-bubble | 10–18% | 50–120 Nm³ | High | Equalization, pre-aeration, backup |
| Jet aeration | 25–35% | 35–90 Nm³ | High | High-BOD, high-T, frequent CIP surges |
| Mechanical surface | 15–25% (process-dependent) | N/A (mechanical) | High | Legacy fallback only |
Process Control and Aeration Sequencing
Process control turns a static aeration tank into a responsive system. The dissolved oxygen setpoint should be 1.5–2.5 mg/L for carbonaceous BOD removal only, and 2.0–4.0 mg/L when the basin must also nitrify — values below 1.0 mg/L collapse nitrification rates, while values above 4.0 mg/L waste blower energy without proportional treatment gain. The F/M ratio target for beverage activated sludge is 0.15–0.4 kg BOD/kg MLVSS·d, with SRT held at 5–15 days. At 30–40 °C the maximum specific growth rate μmax for heterotrophs roughly doubles versus 20 °C, so the temperature-corrected SRT must satisfy SRT > 1/(μmax − kd) with adequate margin to prevent washout during CIP surges.
SBR and MBBR configurations both handle beverage waste, and the choice usually tracks plant flow stability. SBRs offer flexible aeration cycling (fill/react/idle/decant) that absorbs batch CIP discharges cleanly; MBBRs offer shock-load tolerance through carrier-protected biomass and easier retrofitting into existing rectangular tanks. If the plant uses an MBR for polishing, flat-sheet membrane modules require a continuous scour-air supply of 0.1–0.3 Nm³/m²·h — a separate aeration design layer that must be summed into total airflow when an MBR membrane bioreactor for beverage wastewater polishing follows the activated-sludge stage. Control hardware, including DO probes, airflow control valves, and VFD-driven blowers, integrates cleanly with a PLC-based food processing wastewater aeration control architecture, and the same aeration grid benefits from the documented gains in AI-driven aeration DO control savings of 18–32% versus fixed-setpoint operation.
2026 OPEX, Energy Benchmark, and Sizing Verification

Aeration is the single largest OPEX line in a beverage wastewater plant, typically consuming 50–65% of total plant electricity. The 2026 best-in-class benchmark is 0.9–1.6 kWh per kg BOD removed at an industrial tariff of $0.08–0.12/kWh, which translates to $0.04–0.12 per m³ treated for a stream at 1,500–3,000 mg/L BOD (HydropureWater field data, 2026). Values above 2.0 kWh/kg BOD indicate diffuser fouling, alpha-factor drift, or oversized blowers without VFD control. The dominant OPEX contributors are blower energy (70–80% of aeration cost) and diffuser membrane replacement on a 5–7 year cycle (10–20%); the rest is routine maintenance, DO probe calibration, and CIP-compatible acid wash chemicals.
Three verification steps protect the design before performance guarantee testing. First, conduct an on-site clean-water SOTE test per the ASCE 2-06 standard to establish baseline diffuser performance — vendor curves are typically optimistic by 10–20%. Second, run an alpha-factor test on-site with the actual beverage wastewater at operating temperature; an alpha below 0.5 invalidates the original SOTR calculation. Third, calibrate DO probes in saturated air and against a Winkler titration reference before any acceptance test. The automatic chemical dosing system for pH/CIP neutralization is often the supporting piece that stabilizes alpha by holding pH within the 6.5–8.0 range that biofilm and activated-sludge microbiology need.
| OPEX line | 2026 benchmark | Unit | Source / note |
|---|---|---|---|
| Energy — best in class | 0.9–1.6 | kWh/kg BOD removed | HydropureWater field data, 2026 |
| Energy — typical | 1.6–2.5 | kWh/kg BOD removed | Includes fouled or oversized plants |
| Total aeration OPEX | 0.04–0.12 | USD/m³ treated | Tariff $0.08–0.12/kWh |
| Diffuser membrane replacement | 5–7 | years | EPDM service life |
| AI DO control savings | 18–32 | % vs fixed setpoint | Per AI wastewater 2026 review |
For engineers preparing for a vendor handoff, the following checklist consolidates the basis-of-design inputs a supplier will request: influent characterization (BOD, COD, TSS, temperature, pH, BOD:N:P ratio, peak vs average flow), target SOTE and required SOTR in kg O₂/h, tank dimensions and water depth, expected alpha-factor from site or literature, DO setpoint, CIP and equalization flow profile, and ambient conditions for blower selection. Bringing this list to the first meeting cuts the technical clarification cycle by half.
Frequently Asked Questions
What is the difference between SOTE, SOTR, and AOTR for aeration design?
SOTE (standard oxygen transfer efficiency) is the percentage of oxygen in supplied air that transfers to clean water at 20 °C, standard pressure, and zero dissolved oxygen. SOTR (standard oxygen transfer rate) is the absolute oxygen mass transferred per hour under those standard conditions, calculated as SOTR = SOR / (alpha × beta × ((C*−C)/9.07) × θ^(T−20)), where SOR is the actual process oxygen requirement, alpha and beta are wastewater correction factors, C* is the saturation concentration at field temperature, C is the operating DO setpoint, and θ is typically 1.024. AOTR (actual oxygen transfer rate) is what the system actually delivers in the field after all corrections — the number the blower must satisfy.
Fine-bubble versus jet aeration for beverage wastewater — which wins?
Use fine-bubble EPDM diffusers when influent BOD stays below 3,000 mg/L, temperature stays below 30 °C, and the basin is large enough (>500 m³) to justify a dense diffuser grid. Use jet aeration when BOD exceeds 3,000 mg/L, temperature routinely exceeds 30 °C, or CIP surges hit the basin several times per day.
How do I calculate blower power for a 100 m³/h beverage stream?
Assume BOD 2,500 mg/L, target removal 95%, and fine-bubble diffusers at alpha 0.7, beta 0.95, DO setpoint 2.0 mg/L, temperature 30 °C. The hourly BOD removed is 100 × 2.5 × 0.95 = 237.5 kg/h. Air demand at 50 Nm³/kg BOD gives 11,875 Nm³/h, which at 0.6 bar gauge and a blower isentropic efficiency of 70% requires roughly 250–280 kW of installed blower power, with one operating and one standby unit.
How do I prevent diffuser fouling in a beverage plant?
Spec an in-situ acid-wash capability (10% HCl or citric acid, 2–4 h contact) accessible without basin drain, and run the wash on a 3–6 month interval tied to observed SOTE drift. Pair this with an upstream DAF system for beverage pre-treatment to strip fats, oils, and starch before they reach the diffuser grid.
What energy savings can AI-driven aeration control deliver in 2026?
Documented field results show 18–32% energy reduction versus fixed DO setpoint operation when AI controllers modulate blower VFDs and valve positions in real time, taking a typical plant from 1.8 kWh/kg BOD to 1.2–1.5 kWh/kg BOD. The full MBR-side design assumptions, including flux rates and membrane-aeration interaction, are detailed in the 2026 MBR design for dairy wastewater reference, which shares the same food-stream hydraulic and organic load envelope as beverage plants.