2026 OPEX Benchmark for Dairy Wastewater Treatment
Dairy wastewater plant operating cost in 2026 typically runs $0.18–$0.92 per m³ treated, with an industry average of $0.41/m³ for a 500–2,000 m³/day milk processing facility. Energy (aeration, pumping) accounts for 38–45% of OPEX, chemicals 18–24%, sludge handling 12–18%, and labor 10–15%. High-strength dairy effluent (COD 3,000–8,000 mg/L) sits at the upper end; facilities using anaerobic pretreatment (UASB/IC) plus DAF achieve the lowest OPEX at $0.18–$0.34/m³.
The benchmark is wide because dairy effluent is a moving target. A cheese plant washing curds generates a stream dominated by lactose, protein, and milk fat; a yogurt line adds acid and sugar from product losses; a milk powder dryer discharges condensate with high BOD and dissolved salts. The 2017 Life Cycle Inventory study of an anaerobic-digesting dairy plant quantifies the typical load as 1,000–5,000 mg/L COD, 400–2,000 mg/L BOD₅, 200–800 mg/L total suspended solids, and 100–500 mg/L fats/oils/grease (FOG), which is 2–3× stronger than domestic sewage (per the 2017 Life Cycle Inventory, Ecoinvent dataset). That organic load is what drives aeration duty, coagulant demand, and surplus sludge production, and therefore what pushes OPEX up.
For a defensible budget, finance needs the number broken into buckets. The table below is the structure plant engineers should present.
| OPEX Bucket | Share of Total OPEX | Typical $0.41/m³ Allocation | Primary Cost Drivers in Dairy Service |
|---|---|---|---|
| Energy (aeration + pumping) | 38–45% | $0.156–$0.185/m³ | Blower load from BOD removal; CIP pump fouling |
| Chemicals (coagulant, flocculant, pH adjust) | 18–24% | $0.074–$0.098/m³ | FOG emulsions, CIP acid/caustic neutralization |
| Sludge handling (dewatering, disposal) | 12–18% | $0.049–$0.074/m³ | High dry-solids yield from milk solids recovery |
| Labor (operations, sampling) | 10–15% | $0.041–$0.062/m³ | Manual CIP, 24-h coverage for receiving shifts |
| Maintenance + consumables | 5–8% | $0.021–$0.033/m³ | Membrane replacement, UV lamps, pump seals |
| Compliance testing + disinfection | 3–6% | $0.012–$0.025/m³ | BOD/COD/TSS/FOG panels; ClO₂ or UV |
High-strength dairies running COD above 6,000 mg/L — typical for cheese whey and butter plants — will land at $0.55–$0.92/m³. Plants that invested in an upstream dissolved air flotation system to strip FOG before biology, plus a UASB reactor for energy recovery, cluster at the low end. For a parallel benchmark structure outside dairy, the pharmaceutical wastewater OPEX breakdown uses the same four-bucket framework and is a useful cross-check when presenting to finance.
Energy Costs: Why Aeration Dominates Dairy Plant OPEX
Aerobic treatment of dairy effluent typically consumes 0.8–1.4 kWh per m³ treated, and 60–70% of that electricity is blower power driving dissolved-oxygen transfer in the aeration tank (HydropureWater field data, 2026). Because dairy BOD₅ loads are 2–3× municipal strength, blowers run longer and at higher airflow to maintain the 1.5–2.0 mg/L residual DO that keeps flocs alive — the unit power draw works out to 1.0–1.5 kWh per kg BOD removed on fine-bubble diffused systems, consistent with published aeration design curves for high-strength food-industry wastewater.
Pumping is the second electrical load, at 8–12% of total plant kWh. Transfer pumps, RAS pumps, and the CIP return pump all draw baseline power, and that baseline drifts up by 10–18% when milk-fat fouling builds on impellers and diffuser membranes. A missed CIP cycle on the equalization or RAS line is the most common cause of unexplained kWh creep in dairy plants. Submerged flat-sheet MBR designs — such as the DF series submerged MBR module — eliminate the cross-flow circulation pump entirely, cutting membrane-loop pumping energy by 80–90% versus external crossflow designs and giving an additional 0.05–0.12 kWh/m³ saving.
The most defensible 2026 lever is DO-based aeration control with VFD blowers. Field retrofits on dairy SBRs and MBRs show 18–28% gross energy reduction, with the higher end on plants that previously ran constant-speed blowers at fixed setpoints. At an industrial tariff of $0.11/kWh and 8,000 operating hours/year, payback lands at 14–22 months — a number finance will sign off on without a long debate. An integrated integrated MBR system with factory-tuned DO loops delivers this without custom PLC work.
Chemical Consumption and Dosing Costs in Dairy Effluent
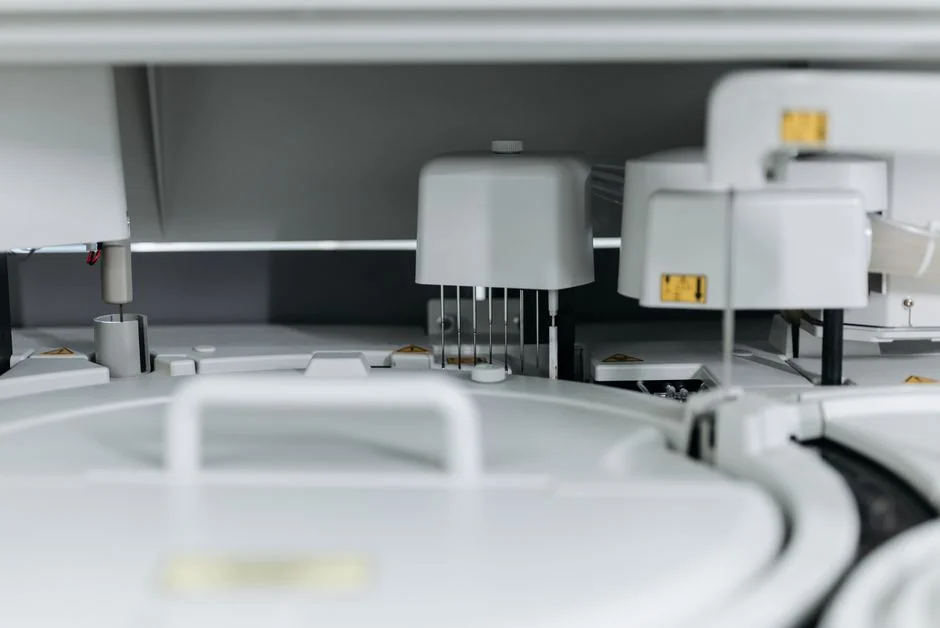
Coagulant and flocculant dosing is the largest chemical line item, and it is driven by the FOG and suspended milk solids that survive primary screening. Polyaluminum chloride (PAC) at 150–400 mg/L or ferric chloride at 100–300 mg/L is standard for primary treatment, with anionic polyacrylamide (PAM) flocculant at 2–8 mg/L as a polishing aid (HydropureWater field data, 2026). On a 1,000 m³/day plant that runs to $0.04–$0.07/m³ of OPEX before any pH correction.
pH adjustment adds a separate line, and dairy is harder than most food sectors because CIP streams swing between caustic (pH 11–13 from detergent circuits) and acid (pH 2–4 from nitric or phosphoric acid rinses). NaOH or lime dosing to neutralize the acid half-cycle adds $0.02–$0.06/m³. Fenton's oxidation as a tertiary polish step is a real option for high-strength streams, but it is expensive: the comparative physicochemical study on simulated dairy wastewater (pH 7.3) reports H₂O₂ demand of 0.3–1.2 g/L and Fe²⁺ at 0.05–0.20 g/L, which translates to $0.08–$0.22/m³ just in reagent (per the International Journal of Environmental Science study on simulated dairy effluent, 2024).
The single largest chemical-saving intervention is upstream FOG and suspended-solids removal with a dissolved air flotation system. DAF pre-removes 60–85% of FOG and 40–70% of TSS, which drops downstream coagulant demand by 35–50% and reduces the BOD loading on the biological stage by 20–35%. The second lever is a PLC-controlled chemical dosing system with flow-paced setpoints; field comparisons on dairy plants show 15–22% chemical savings over manual dosing, with payback under 12 months at typical 2026 reagent prices.
Process Train Comparison: OPEX by Treatment Configuration
The cheapest OPEX figure on the previous benchmark belongs to one specific train: DAF plus UASB/IC plus MBR. The table below compares four realistic configurations a dairy plant engineer will see quoted in 2026, with OPEX ranges drawn from operating data and normalized to a 1,000 m³/day plant with influent COD 4,000–6,000 mg/L.
| Process Train | Typical 2026 OPEX ($/m³) | Energy (kWh/m³) | Sludge Yield | Best-Fit Application |
|---|---|---|---|---|
| DAF + UASB/IC + MBR | $0.18–$0.34 | 0.45–0.75 (net of biogas credit) | 0.08–0.12 kg TSS/kg COD | 500–5,000 m³/day, COD > 3,000 mg/L, water reuse optional |
| DAF + SBR | $0.28–$0.48 | 0.85–1.20 | 0.15–0.22 kg TSS/kg COD | 200–1,500 m³/day, intermittent flow, no anaerobic capex appetite |
| Chem + SBR (no anaerobic) | $0.55–$0.92 | 1.10–1.50 | 0.25–0.35 kg TSS/kg COD | < 300 m³/day, low capex tolerance, moderate-strength influent |
| MBR + RO polish (water reuse) | $0.42–$0.68 (+ $0.05–$0.12 concentrate disposal) | 1.20–1.80 | 0.10–0.14 kg TSS/kg COD | Plants targeting > 60% water recovery for CIP or boiler feed |
The DAF + UASB/IC + MBR train wins on OPEX because the UASB or internal-circulation anaerobic reactor recovers 0.18–0.35 kWh/m³ as biogas — a direct electricity credit on a CHP-equipped plant that offsets 30–50% of downstream aeration duty on medium-to-large dairies. Sludge yield also drops by 50–60% versus a purely aerobic train because anaerobic conversion mineralizes roughly 80–90% of the influent COD to CH₄ and CO₂ instead of biomass. The MBR polish stage then handles residual COD, ammonia, and TSS to a discharge or reuse standard. Plants specifying a packaged version of this train often start with the integrated MBR system and retrofit anaerobic pretreatment in a second phase once the influent profile is confirmed.
The DAF + SBR train is the conservative default when anaerobic capex is hard to justify — smaller dairies, sites with no gas utilization plan, or plants with highly variable influent. It costs $0.10–$0.14/m³ more to operate, but the simplicity and the smaller footprint are real advantages. Plants under 200 m³/day with low-to-moderate strength (COD < 3,000 mg/L) and no water-reuse target often default to a packaged WSZ underground integrated sewage treatment unit in the Chem + SBR configuration. The MBR + RO configuration is only cost-effective when the water-reuse value exceeds $0.30–$0.50/m³ — otherwise the RO concentrate disposal line alone wipes out the savings.
Sludge Handling: The Dairy-Specific Cost Burden
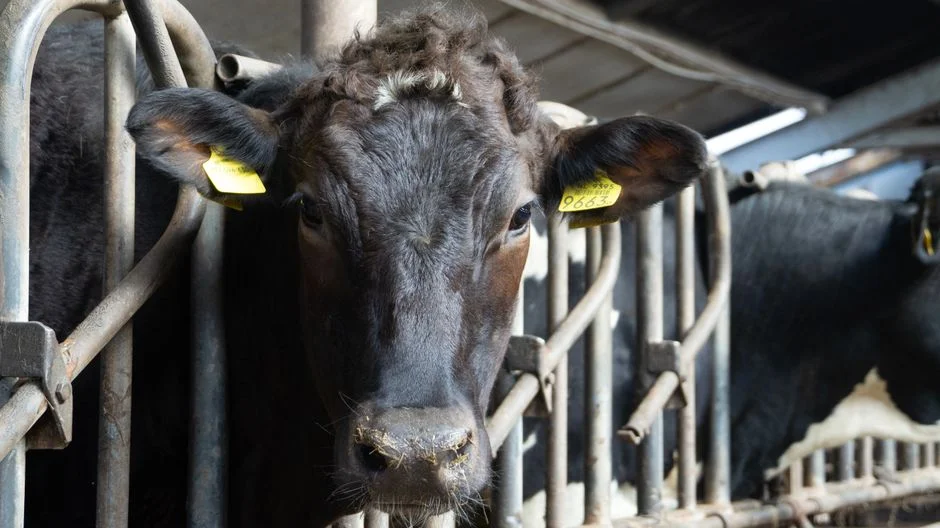
Dairy plants generate 1.4–1.8 kg dry sludge per m³ treated — roughly 2–3× the dry solids yield of a municipal plant working on the same flow — because primary clarification and DAF recover milk solids, fat, and protein into a sludge stream that has to be dewatered and disposed of (HydropureWater field data, 2026). At a 1,000 m³/day plant that is 1.4–1.8 tonnes of dry solids per day, and dewatering cost is the single largest controllable line item under the sludge bucket.
Belt filter presses are the dairy default: $8–$14 per m³ of sludge feed, dry solids 14–18% in the cake, polymer dose 4–8 kg/tDS. Plate-and-frame filter presses run cheaper on a per-ton-of-cake basis: $5–$9 per m³ of sludge feed, dry solids 20–24%, polymer dose 3–5 kg/tDS, because the higher pressure extracts more water and the cake goes out at a lower tonnage to landfill or land application. Centrifuges are $10–$18 per m³ of sludge feed at 18–22% dry solids, with higher power draw but a much smaller footprint — they win on space-constrained sites.
The decision hinges on what the cake is worth on the back end. A plate-and-frame filter press cuts sludge disposal cost by 20–35% per ton of cake versus a belt press on the same feed, which compounds into $0.015–$0.035/m³ of OPEX savings. Upstream, a high-efficiency sedimentation tank using lamella plate packs thickens sludge before it reaches the press and cuts the hydraulic load to the dewatering stage by 25–35%, which lets a smaller press handle the same plant. For a parallel view of mechanical dewatering economics, the belt filter press cost and ROI guide covers biodiesel plants with similar cake-disposal economics.
Labor, Maintenance, and Compliance: The Remaining 25% of OPEX
Labor runs 10–15% of OPEX because dairy plants run 24 hours a day, 7 days a week through receiving. A 1,000 m³/day plant typically needs 1.5–2.5 FTE operators on rotating shifts at a fully loaded 2026 cost of $18,000–$28,000 per year per FTE, depending on regional labor rates and the level of automation (HydropureWater field data, 2026). Plants with full SCADA and remote monitoring sit at the lower end of the FTE range; plants with manual CIP and hand-dosed chemicals sit at the upper end.
Maintenance and consumables land at 5–8% of OPEX and cover the things that wear out on a predictable cycle. MBR membrane replacement is the biggest single line, at $0.02–$0.05/m³ annualized assuming 5–8 year membrane life in dairy service with proper CIP — running CIP on schedule is what protects the membrane replacement line. UV lamps run 12,000–18,000 hours before output drops; pump seals and bearings on transfer and RAS pumps are a 12–24 month replacement item.
Compliance testing and disinfection close out the residual. A monthly BOD/COD/TSS/FOG/pH panel plus quarterly nitrogen and phosphorus typically runs $800–$2,200/month at a 2026 commercial lab, which is $0.025–$0.07/m³. Disinfection to a surface-water discharge standard with chlorine dioxide from a chlorine dioxide generator adds $0.01–$0.04/m³, depending on dose and contact time. UV is comparable at $0.015–$0.045/m³ but carries a higher lamp-replacement OPEX line.
5 Cost-Saving Levers a Dairy Plant Can Pull in 2026
- Add DAF upstream of the biological stage. A dissolved air flotation system removes 60–85% of FOG and 40–70% of TSS before biology, which cuts downstream aeration energy by 25–35% and coagulant demand by 35–50%. Payback at $0.11/kWh and current reagent pricing is 10–18 months.
- Install DO-based aeration control with VFD blowers. Field retrofits on dairy SBRs and MBRs show 18–28% blower energy reduction. The control package pays back under 14 months at 8,000 operating hours/year and an industrial tariff of $0.11/kWh, and the blower soft-start also extends blower bearing life.
- Switch from belt press to plate-and-frame filter press. A plate-and-frame filter press delivers 20–24% dry solids versus 14–18% on a belt press, which lowers disposal cost per ton of cake by 20–35%. The capex premium over a belt press is recovered in 18–30 months at typical dairy disposal rates.
- Recover biogas from a UASB/IC reactor. A UASB or IC reactor on influent COD above 3,000 mg/L produces 0.18–0.35 kWh/m³ of biogas-derived electricity, which offsets 30–50% of plant electricity on medium-to-large dairies. For a parallel mechanical-dewatering view, the belt thickener vs centrifuge cost comparison covers adjacent dewatering choices.
- Tighten CIP chemical recovery and reuse caustic rinse. Capturing the final caustic rinse for reuse on the next CIP pre-rinse cuts total chemical OPEX by 8–15% with no new equipment beyond a small rinse tank and a conductivity-based diversion valve. Payback is typically under 6 months.
Frequently Asked Questions
What is the average OPEX per m³ for dairy wastewater in 2026?
The 2026 industry average is $0.41/m³ for a 500–2,000 m³/day milk processing facility, with a full range of $0.18–$0.92/m³ depending on influent strength and process train. Plants running DAF + UASB/IC + MBR cluster at $0.18–$0.34/m³ (HydropureWater field data, 2026).
Which process train has the lowest operating cost for milk processing effluent?
DAF + UASB/IC + MBR delivers the lowest OPEX at $0.18–$0.34/m³, driven by anaerobic energy recovery of 0.18–0.35 kWh/m³ and a 50–60% reduction in sludge yield versus purely aerobic trains.
How much does sludge dewatering cost in a dairy plant?
Belt filter press: $8–$14 per m³ of sludge feed at 14–18% dry solids. Plate-and-frame: $5–$9 per m³ at 20–24% dry solids — the lowest disposal cost per ton of cake. Centrifuge: $10–$18 per m³ at 18–22% dry solids.
Can a dairy plant offset its electricity bill with biogas from wastewater?
Yes. A UASB or IC reactor on influent COD above 3,000 mg/L produces 0.18–0.35 kWh/m³ of biogas-derived electricity, which offsets 30–50% of plant electricity on medium-to-large dairies when a CHP unit is installed.
How much does DAF pretreatment reduce dairy wastewater OPEX?
A DAF upstream of the biological stage cuts downstream aeration energy by 25–35% and coagulant demand by 35–50%, translating to a total OPEX reduction of $0.05–$0.12/m³ at 2026 reagent and energy prices. Payback is 10–18 months at $0.11/kWh.