What a Pharmaceutical Wastewater Plant Actually Costs to Run in 2026
Pharmaceutical wastewater plant operating cost in 2026 typically runs USD 2.90–4.50 per cubic meter treated (≈21–32 CNY/m³ at current rates), up from the 21 CNY/m³ baseline documented by Lyu et al. in 2020. The six cost drivers — energy, chemicals, sludge handling, membrane replacement, labor, and compliance monitoring — each represent 8–28% of total OPEX depending on whether the train uses Fenton polishing, MBR, or RO reuse.
The Lyu 2020 study of chemical industrial parks in China set a 21 CNY/m³ (~USD 3.00/m³ at then-prevailing rates) figure for the pharmaceutical sector, alongside a 29 CNY/m³ figure for dyestuff (Lyu et al., 2020, Exploring the cost of wastewater treatment in a chemical industrial park). Five years of chemical inflation, energy tariff revisions, and stricter discharge rules push the realistic 2026 band to USD 2.90–4.50/m³ — a 20–40% increase for plants that have not already optimized. The capex counterpart is meaningful: a 5,000 m³/day pharmaceutical WWTP sits on a USD 0.8–2.5 million installed-cost base, derived from the Lyu benchmark of USD 160/kLd capital cost excluding construction (Lyu et al., 2020).
Pharma OPEX runs 30–60% above municipal WWTP OPEX for three engineering reasons: influent COD often lands at 2,000–8,000 mg/L versus 250–500 mg/L municipal; sulfate and solvent fractions suppress biological kinetics; and discharge limits are tighter on residual APIs, color, and total nitrogen. The six OPEX buckets and their typical 2026 weight in a well-run plant are:
- Energy — 22–28% of OPEX, dominated by aeration and RO high-pressure pumping
- Chemicals — 18–24%, dominated by Fenton reagents and DAF polymer
- Sludge handling — 12–18%, dominated by hazardous-waste hauling
- Membranes and replacement parts — 8–14%, dominated by MBR and RO element replacement
- Labor — 10–15%, dominated by skilled shift coverage
- Monitoring and compliance — 5–8%, dominated by online instrumentation and third-party sampling
Membrane and consumables budgeting is where most procurement teams underestimate the bill — the full RO system spare parts and consumables OPEX breakdown for 2026 shows how RO trains quietly add USD 0.10–0.25/m³ on top of headline reagent costs.
Energy: The Largest Single OPEX Line for a Pharma WWTP
Energy is 22–28% of total pharmaceutical WWTP OPEX and the single line item most sensitive to equipment choice. Aeration in the biological stage — whether activated sludge, MBR, or SBR — consumes 0.8–1.4 kWh per cubic meter treated, which is 50–65% of total plant electricity in a typical configuration (HydropureWater field data, 2026). The next-largest draws are influent and recycle pumping at 0.10–0.20 kWh/m³ and RO high-pressure pumping at 0.6–1.1 kWh/m³ for reuse trains.
Two equipment swaps pay back fastest. First, switching fixed-speed blowers to DO-controlled VFD blowers with a 1.5–2.5 mg/L setpoint cuts aeration energy 15–25% (HydropureWater field data, 2026). On a 5,000 m³/day plant with 1.2 kWh/m³ aeration draw, that is a 180–360 kWh/day reduction, or roughly USD 5,000–15,000 per year at Chinese industrial tariffs. Second, RO energy recovery devices (ERDs) on reuse trains reclaim 30–50% of high-pressure pump input; for a 70–80% recovery RO, this drops RO energy from 0.6–1.1 kWh/m³ toward 0.3–0.7 kWh/m³.
MBR scouring air adds 0.15–0.25 kWh/m³ versus a CAS basin, but is largely offset by eliminating return-activated-sludge (RAS) pumping and the smaller basin footprint. Worked example: 1.2 kWh/m³ total plant draw at USD 0.10/kWh lands USD 0.12/m³ in electricity — exactly the 24% energy OPEX share that anchors our 2026 baseline. 2026 industrial electricity tariffs sit at USD 0.07–0.12/kWh in China, USD 0.10–0.18/kWh in the EU, and USD 0.08–0.14/kWh in India, which is why a plant with the same equipment stack can run 30–50% higher OPEX in Europe than in China.
Chemicals: The Most Variable Cost Line — and Where DAF and Fenton Pull the Most Weight
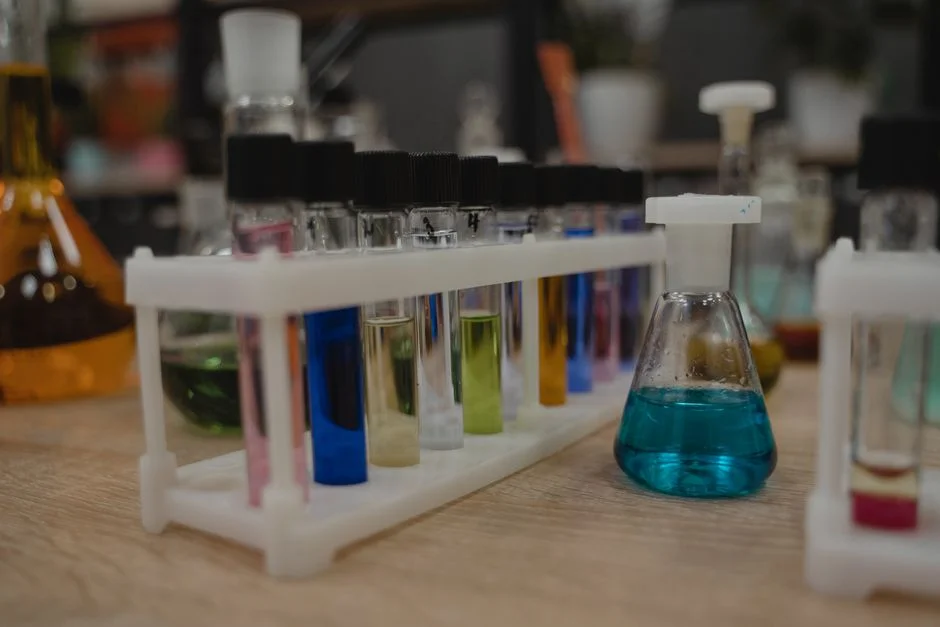
Chemical OPEX in pharmaceutical wastewater plants varies from USD 0.45 to 0.90 per cubic meter across the documented treatment trains, and is the line where over-dosing wastes the most money. The biggest individual contributors are Fenton reagents for refractory COD polishing, DAF polymer for suspended-solids removal, and pH adjusters for the equalization tank.
| Reagent | Typical Dose | Unit Cost (USD/kg) | Cost Contribution (USD/m³) |
|---|---|---|---|
| Cationic polyacrylamide (DAF) | 0.5–3 mg/L | 2.50–5.50 | 0.03–0.08 |
| Fenton H₂O₂ (30%) | 0.5–2.0× stoichiometric | 0.40–0.70 | 0.18–0.45 |
| Fenton FeSO₄·7H₂O | 1:1 molar with H₂O₂ | 0.20–0.40 | 0.07–0.20 |
| NaOH / H₂SO₄ (pH adjust) | Site-specific | 0.30–0.60 | 0.05–0.15 |
| Urea / H₃PO₄ (nutrients) | C:N:P = 100:5:1 | 0.30–0.80 | 0.02–0.06 |
| NaClO / ClO₂ (disinfection) | 5–15 mg/L free Cl₂ | 0.80–2.20 | 0.04–0.10 |
Fenton is only justifiable when biological effluent COD exceeds ~400 mg/L — below that threshold, sand filtration or MBR polishing delivers equivalent discharge quality at 60–80% lower reagent cost. DAF polymer is the most over-dosed reagent in the train: jar testing for the actual feed rather than the historical 3 mg/L default typically saves 30–50% of polymer spend. An automatic chemical dosing skid for Fenton and DAF reagent lines with flow-paced control recovers 20–30% of over-spend versus manual dosing, and pays back in 6–14 months on chemical savings alone. The DAF unit for suspended solids and pre-biological removal is the workhorse for the upstream chemical-spend bucket.
Sludge Handling: A Cost That Hides Until Year Two
Pharma biological sludge yield runs 0.25–0.45 kg dry solids per kg COD removed — roughly 1.5–2× higher than municipal sludge for the same COD load, because of the lower F/M ratio and frequent cell-decay dynamics in pharmaceutical influent (HydropureWater field data, 2026). On a 5,000 m³/day plant removing 4,000 mg/L COD, that is 5–9 wet tons per day of dewatered cake to haul.
Dewatering equipment choice swings sludge OPEX by 30–50%. A plate-and-frame filter press at 8–15 bar produces 22–28% DS cake; a belt press only manages 16–20%. Every additional point of cake dryness cuts hauling cost by roughly USD 2–4 per wet ton — and at 5–9 wet tons per day, that compounds to USD 30,000–80,000 per year in disposal savings for a mid-sized plant. On-site dewatering with a 50 m² plate-and-frame filter press typically runs USD 0.20–0.40/m³ of influent versus USD 0.35–0.75/m³ for outsourced thickening (HydropureWater field data, 2026). The high-efficiency sedimentation tank is the upstream choice that decides how much sludge the press sees.
Off-site hazardous sludge disposal is the OPEX line that quietly doubles the bill once residuals trigger hazardous-waste classification. Most regional hazardous-waste frameworks — including China's HW06 and HW11 categories and the EU's 19 02 EWC codes — flag pharmaceutical sludge as hazardous when residual APIs exceed detection limits. 2026 disposal costs run USD 80–220 per wet ton across major producing regions, which is why a 5-percentage-point improvement in cake dryness is the single most leveraged mechanical upgrade a plant can make in year one.
Membrane and Replacement Parts: MBR vs. RO Cost Curves
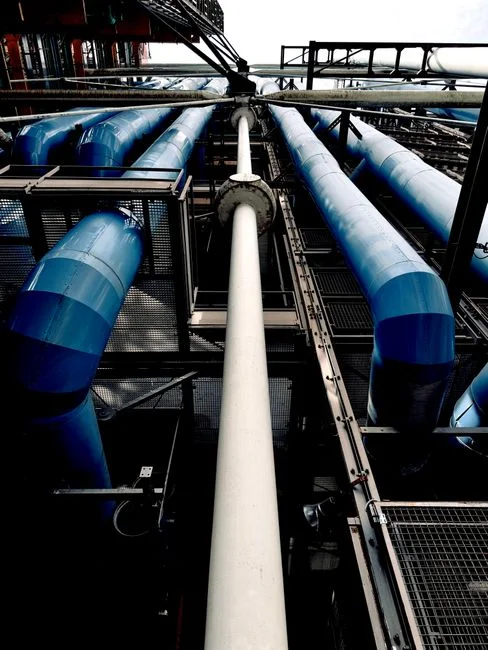
Membrane and replacement-part OPEX is 8–14% of total cost and is where the MBR-versus-RO reuse decision actually lands on the spreadsheet. MBR PVDF flat-sheet membranes last 5–8 years with proper aeration scouring; replacement runs USD 30–60 per m² of membrane area, which annualizes to USD 0.18–0.35/m³ depending on flux and MLSS operating point. RO membrane elements in pharma reuse service last 3–5 years; replacement runs USD 800–1,800 per element, landing OPEX at USD 0.10–0.25/m³ at 70–80% recovery.
The supporting equipment is where the budget typically goes underfunded. Pump rebuilds, valve actuators, instrument sensors, and DO probes add a combined USD 0.05–0.12/m³ — predictable but rarely budgeted because the spend is lumpy. The rule of thumb for pharma plants is to ring-fence a spare-parts budget equal to 3–5% of capex per year, which covers the predictable replacement cycle without emergency procurement. The full cost stack for RO consumables is mapped in the RO system spare parts and consumables OPEX breakdown for 2026.
For spec-side readers comparing trains, the practical options are an MBR membrane bioreactor for the biological stage (biological effluent polishing and sludge retention in one skid), an MBR membrane module for retrofit or capacity expansion, and a stand-alone RO system for water reuse and ZLD pre-concentration. The MBR+RO combination is the standard answer for plants with internal reuse targets or jurisdictions pushing toward ZLD.
Process-by-Process OPEX Allocation: Where Each Unit Operation Sits
The clearest way to defend a pharma WWTP budget to procurement is to show where each unit operation contributes to the per-cubic-meter cost. The 2026 allocation for a typical 5,000 m³/day train — equalization, DAF, biological (MBR or A/O), Fenton or tertiary, RO reuse, sludge dewatering — is summarized below.
| Unit Operation | 2026 OPEX (USD/m³) | Dominant Cost Driver |
|---|---|---|
| Equalization + screening | 0.05–0.15 | Pumping, screen debris |
| DAF / primary clarification | 0.15–0.30 | Polymer, saturator air, skimmer |
| Biological (A/O, A2O, SBR, MBR, HHAT) | 0.80–1.50 | Aeration energy |
| Tertiary (Fenton / sand / MBR / RO) | 0.40–1.20 | Configuration-dependent |
| Disinfection (NaClO / ClO₂ / UV / O₃) | 0.05–0.20 | Reagent or lamp replacement |
| Sludge dewatering and disposal | 0.30–0.75 | Polymer, hauling |
| Subtotal (process train) | 1.75–4.10 | — |
| Overhead, monitoring, labor | 1.15–1.40 | Compliance instrumentation, shifts |
| Total plant OPEX | 2.90–4.50 | — |
The biological stage is the single largest contributor, which is why DO control and blower selection dominate the energy-savings discussion in section two. Tertiary treatment is the most variable line: a Fenton-only polish lands at USD 0.40–0.65/m³, an MBR+RO reuse train at USD 0.85–1.20/m³, and a sand-filter-only polish below USD 0.30/m³. The MBR+RO configuration for high-strength API effluent is detailed in the parallel MBR engineering guide for industrial wastewater; while that article is bakery-specific, the cost methodology transfers directly to pharma.
Three Savings Levers a Buyer Can Pull This Quarter
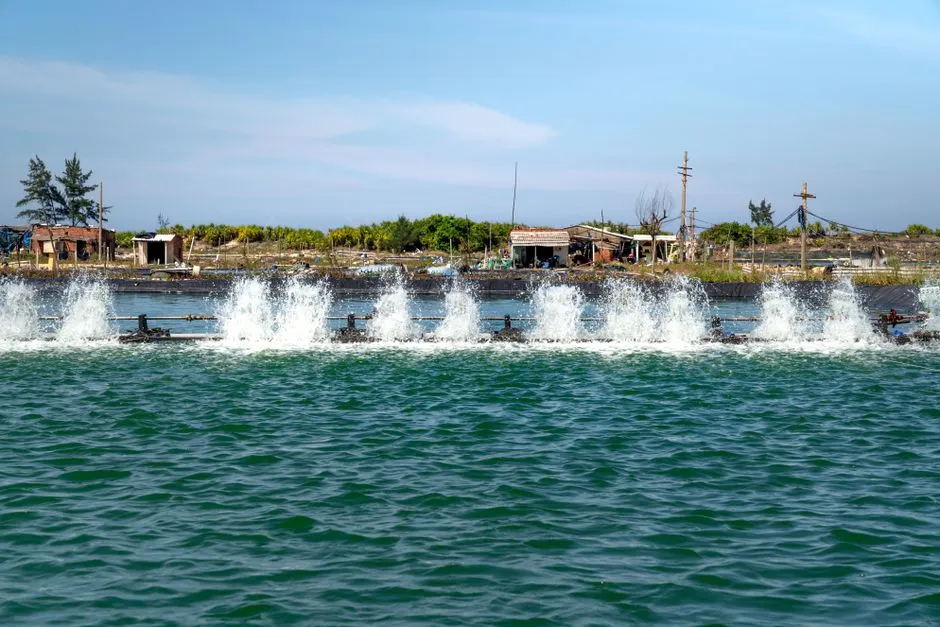
Three procurement-grade levers move the OPEX needle inside a single budget cycle. Each is sized with a unit-cost impact and a payback window so a procurement lead can defend the spend to finance.
- Install automatic chemical dosing on Fenton and DAF reagent lines. An automatic chemical dosing skid for Fenton and DAF reagent lines typically saves USD 0.08–0.18/m³ on polymer and H₂O₂ combined, with payback in 6–14 months from reagent savings alone (HydropureWater field data, 2026). On a 5,000 m³/day plant, that is USD 110,000–250,000 in year-one savings.
- Upgrade to DO-controlled VFD blowers on the biological stage. Cutting aeration energy 15–25% lands USD 0.10–0.22/m³ in electricity savings, with 12–24 month payback. Pair the blower upgrade with a DO probe calibration plan so the setpoint stays honest.
- Add online BOD/COD/ammonia monitoring for continuous discharge protection. Grab-sampling misses the spike events that trigger non-compliance penalties. A continuous BOD online monitoring system 2026 engineering guide approach costs less than USD 0.02/m³ to operate and prevents the rare six-figure non-compliance event — typical penalties across major producing regions run USD 5,000–500,000 per event, with a historical average of USD 50,000–250,000 for pharma plants (HydropureWater field data, 2026).
2026 Compliance Checkpoints That Quietly Inflate OPEX If Missed
Non-compliance is the OPEX line no one budgets until it fires. The 2026 regulatory landscape has three reference points that pharma plants must hit, and missing any of them lands a compliance penalty inside the same fiscal year as the OPEX savings being chased.
- China GB 21904-2008 sets COD ≤120 mg/L, BOD ≤40 mg/L, ammonia ≤25 mg/L, with category-specific residual API limits. Tighter 2026 provincial add-ons — notably Guangdong's COD ≤60 mg/L push and the Yangtze River basin's total-nitrogen cap — are now common in environmental-sensitive regions.
- EU BAT-AEL for API manufacturing (Commission Implementing Decision 2016/902) sets TOC ≤20 mg/L and substance-specific emission limits for the priority APIs; 2026 BAT revisions under review are expected to tighten heavy-metal and PFAS add-ons.
- US 40 CFR 439 categorical standards for pharmaceutical manufacturing remain the federal cap, but state-level PFAS rules (notably in New Jersey and California) and Total Nitrogen adds have become the operational binding constraints.
- India CPCB pharma effluent limits combined with ZLD mandates in Gujarat and Telangana push the reuse-RO OPEX to USD 0.30–0.60/m³ — already captured inside the total 2026 band.
Non-compliance penalties in major producing regions run USD 5,000–500,000 per event plus the risk of plant shutdown, and they are not insurable in most jurisdictions (HydropureWater field data, 2026). The cheapest compliance dollar is the one that prevents the event — which is the engineering case for online monitoring and conservative reagent dosing on the Fenton skid. For nitrogen-specific cap planning, the parallel total nitrogen discharge standard 2026 global limits compliance guide maps the regional deltas.
Frequently Asked Questions
What is the typical pharmaceutical wastewater plant operating cost in 2026?
USD 2.90–4.50 per cubic meter treated (≈21–32 CNY/m³), up from the 21 CNY/m³ baseline set by Lyu et al. in 2020. The total depends on whether the train includes Fenton polishing, MBR, or RO reuse.
Which OPEX line item is largest for a pharmaceutical WWTP?
Energy at 22–28% of total OPEX, driven by biological-stage aeration (0.8–1.4 kWh/m³) and RO high-pressure pumping (0.6–1.1 kWh/m³) where reuse is included. DO-controlled VFD blowers are the single fastest-paying-back equipment swap.
How much does MBR versus RO add to pharmaceutical wastewater OPEX?
MBR membrane replacement lands at USD 0.18–0.35/m³ annualized with 5–8 year PVDF flat-sheet life. RO reuse adds another USD 0.10–0.25/m³ in element replacement and energy, with 3–5 year element life in pharma service. Combined MBR+RO reuse train total is typically USD 0.85–1.20/m³ for the membrane portion alone.
What does Fenton oxidation cost for pharmaceutical effluent?
USD 0.25–0.65/m³ when H₂O₂ is dosed at 0.5–2.0× stoichiometric with FeSO₄ at 1:1 molar ratio, justified only when biological effluent COD exceeds ~400 mg/L. Below that threshold, MBR or sand filtration is more cost-effective.
What is the most expensive hidden OPEX line in a pharma WWTP?
Hazardous sludge disposal, at USD 80–220 per wet ton in 2026, classified under regional hazardous-waste rules whenever residual APIs exceed detection limits. Dewatering to 22–28% DS cake via a plate-and-frame press is the single most leveraged mechanical upgrade.
How does pharmaceutical WWTP OPEX compare to municipal WWTP OPEX?
30–60% higher, driven by influent COD of 2,000–8,000 mg/L versus 250–500 mg/L municipal, sulfate and solvent suppression of biological kinetics, and tighter discharge limits on residual APIs and color.
For a sized OPEX model tailored to your influent profile, discharge standard, and reuse target, the engineering team can work from a one-page feed characterization and a target treatment train.