Why Brewery Wastewater Has Its Own Discharge Standard
Brewery wastewater discharge standards exist because raw brewery effluent carries roughly 3,000 mg/L BOD₅ — a load equivalent to the domestic sewage of about 50 single-family homes, per the Guide to Brewery Discharges. That figure alone separates a brewery from any light-industrial neighbour and triggers industrial discharge permitting under the U.S. Clean Water Act (40 CFR Part 405), the EU Industrial Emissions Directive (2010/75/EU), and China's MEP-S pollutant discharge permitting rules for the brewing industry.
The pollutant inventory behind the number is wide: residual sugars (maltose, glucose, maltotriose), starches from spent grain carryover, ethanol and fusel alcohols, short-chain organic acids, hop polyphenols, yeast cells, proteins, and the acid/alkaline cleaners used in clean-in-place (CIP) cycles. Most of these are highly biodegradable, but their combined mass is the problem. A useful diagnostic is the BOD/COD ratio, which for brewery influent sits in the 0.5–0.7 band — well above the 0.3 threshold regulators use to flag a stream as biodegradable industrial waste rather than dilute domestic sewage.
Three consequences follow. First, brewery effluent cannot legally enter a municipal sewer in the U.S., EU, or China without a pre-treatment permit or indirect-discharge agreement. Second, the 50-home equivalence means a single 100,000-hectolitre regional brewery can hydraulically and organically overpower a small municipal treatment plant if it discharges untreated. Third, the high biodegradability — annoying as a pollutant load — is also the reason anaerobic + aerobic trains are the workhorse solution: the organic carbon is convertible to biogas rather than just incinerated as sludge.
Brewery Wastewater Discharge Limits by Jurisdiction (US, EU, China)
Before any treatment train is sized, the compliance officer has to lock down the numerical envelope. Direct-discharge limits (effluent to surface water) are 5–10× stricter than indirect-discharge limits (effluent to municipal sewer) in every jurisdiction, and the table below shows both. China GB 19821-2008 remains the binding national standard through 2026, though regional tightening is now active in the Yangtze and Yellow River basins (see the 2026 trends section).
| Parameter | US NPDES (typical sewer / pre-treatment) | EU BAT-AEL (Brewing, direct discharge) | China GB 19821-2008 (discharge to municipal WWTP) |
|---|---|---|---|
| pH | 6.0–9.0 | 6.5–9.0 | 6.0–9.0 |
| BOD₅ | 250–400 mg/L | ≤ 25 mg/L | ≤ 300 mg/L (COD-based cap: 500 mg/L) |
| COD | typically no separate cap; BOD governs | 80–125 mg/L | ≤ 500 mg/L |
| TSS / SS | ≤ 250 mg/L | 35–50 mg/L | ≤ 400 mg/L |
| Total Nitrogen (TN) | site-specific, ~10–40 mg/L | 15–25 mg/L (BREF 2026 draft) | — (regional caps apply) |
| Total Phosphorus (TP) | site-specific | 2–5 mg/L (BREF 2026 draft) | — (regional caps apply) |
| Ammonia (NH₃-N) | site-specific | 5–10 mg/L | ≤ 45 mg/L |
Two operational points matter for 2026. First, EPA's 2024–2026 effluent guidelines review has expanded PFAS monitoring clauses and whole-effluent toxicity (WET) testing requirements for breweries above 100,000 bbl/year. Second, the EU BREF for Food, Drink and Milk Industries is in its 2026 update cycle, with draft BAT-AEL ranges trending toward tighter nitrogen and phosphorus ceilings and a mandatory water-reuse threshold of ≥ 30% by 2030.
Brewery Wastewater Characteristics and Influent Parameters
Sizing equipment starts with a defensible influent number. Raw brewery wastewater typically lands in the bands below, and the variability — not the average — is what kills biological systems if equalization is undersized. Brewing campaigns produce slug loads 2–3× higher than the daily average for 4–8 hours after a knockout or during CIP.
| Parameter | Raw Brewery Wastewater (typical range) | Notes for design |
|---|---|---|
| BOD₅ | 1,500–3,000 mg/L | Equivalent to 25–50 homes per 1 m³ batch |
| COD | 3,000–6,000 mg/L | BOD/COD ratio 0.5–0.7 (highly biodegradable) |
| TSS | 500–1,500 mg/L | Spent grain, hop trub, yeast, label debris |
| Total Nitrogen (TN) | 30–80 mg/L | Mostly organic-N from grain proteins |
| Total Phosphorus (TP) | 5–20 mg/L | From grain phytate and yeast |
| pH | 4–11 (CIP spikes) | Equalization tank required |
| Temperature | 25–40 °C | Favours mesophilic biology; cooling tower needed in cold climates |
| Oil & Grease | 50–250 mg/L | Lubricants from canning/bottling lines |
Two design flags follow. The CIP pH swing (acid wash at pH 2, caustic wash at pH 12) is the single most common cause of biomass upset in brewery treatment plants; a 24-hour equalization tank with air mixing is not optional. The 25–40 °C effluent temperature is a gift to mesophilic anaerobic and aerobic biology (UASB, IC, MBR all perform at peak in this range) — but in temperate climates that heat must be shed in summer to keep the MBR below 38 °C and the UASB below 40 °C, or methanogen activity collapses.
Treatment Train to Meet the 2026 Discharge Standard
The unit operations below, in order, will take a 3,000 mg/L BOD stream to under 25 mg/L BOD and meet the EU BAT-AEL; for indirect discharge (sewer) under US or China rules, the train can be truncated after Step 5 without disinfection. Each step has a defined performance target so the engineer can verify compliance at the hand-off.
- Coarse screening (3–5 mm aperture). A GX series rotary bar screen removes spent grain, hop trub, label fragments, and broken glass. Target removal: > 90% of particles > 5 mm. This step protects downstream pumps and the DAF nozzles from ragging.
- Dissolved air flotation (DAF). A dissolved air flotation system targets suspended solids, colloidal organics, and emulsified oils. Typical performance: TSS removal 70–90% to < 150 mg/L, and TKN reduction of 15–25% as colloidal protein is floated. Hydraulic residence time is short — 20–30 minutes — so the DAF also acts as a flow buffer ahead of biology.
- Flow and pH equalization. A 12–24 hour equalization tank with diffused-air mixing damps the CIP pH swing (4–11 → 6.5–8) and the brewing slug load. This is the single most cost-effective tank in the plant; undersizing it is the most common cause of permit excursions.
- Anaerobic reactor (UASB or IC). Upflow anaerobic sludge blanket or internal-circulation reactors handle 80–90% of the COD at 35 °C with a methane yield of ~0.30 m³ CH₄/kg COD removed. Effluent COD after the anaerobic stage typically drops to 400–700 mg/L. Biogas is typically 60–70% methane and can be flared or fed to a CHP unit at flows above 500 m³/day.
- Aerobic MBR or SBR. An integrated MBR membrane bioreactor polishes the anaerobic effluent to BOD < 10 mg/L, COD < 50 mg/L, TSS < 5 mg/L, and TN < 15 mg/L in a footprint roughly 30–40% smaller than a conventional activated-sludge train. At flows above 500 m³/day, sequencing batch reactors (SBR) become cost-competitive and avoid membrane replacement cost.
- Disinfection. A chlorine dioxide generator doses 1–2 mg/L ClO₂ to meet < 1,000 CFU/100 mL E. coli for surface-water discharge. UV at 30–40 mJ/cm² is an accepted alternative where chlorine residual in the receiving water is a concern.
- Sludge dewatering. Combined DAF float and waste-activated sludge is thickened in a plate-and-frame filter press to 22–28% dry solids for offsite disposal or composting. At 22% DS the cake passes the paint-filter test for non-hazardous waste in most US states.
The cumulative reduction from raw influent to MBR permeate is typically BOD₅ 3,000 → < 10 mg/L (99.7% removal), COD 5,000 → < 50 mg/L (99.0%), and TSS 1,000 → < 5 mg/L (99.5%) — well inside both the EU 25 mg/L BOD ceiling and the China GB 19821 indirect-discharge limits.
How to Choose the Right Brewery Effluent Treatment System in 2026
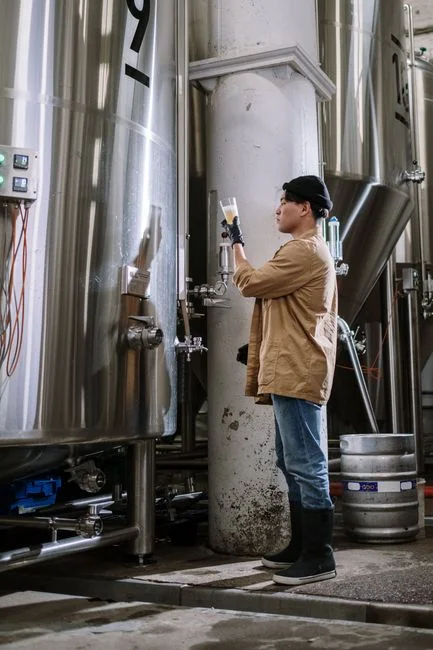
Translating the train into a procurement decision depends primarily on average daily flow, secondarily on whether the discharge is to sewer (indirect) or surface water (direct). The rule of thumb below is consistent with EPA 40 CFR Part 405 cost curves and 2026 EPC quotes for brewery projects.
| Average Flow | Recommended Train | Indicative CAPEX (USD, 2026) | Typical OPEX Driver |
|---|---|---|---|
| < 50 m³/day (craft / microbrewery) | Bar screen + packaged DAF + packaged MBR + UV | 25,000–80,000 | Membrane replacement (every 5–7 yr) |
| 50–500 m³/day (regional / multi-site craft) | Bar screen + DAF + equalization + UASB + MBR + ClO₂ | 250,000–600,000 | Electricity 0.8–1.4 kWh/m³ |
| > 500 m³/day (large regional / macro) | Bar screen + DAF + equalization + IC anaerobic + SBR + ClO₂ + biogas CHP | 800,000–2,500,000+ | Sludge hauling USD 80–150/m³ wet cake; CHP offsets 30–50% of grid power |
Two procurement-side notes. First, OPEX is dominated by electricity (0.8–1.4 kWh/m³ across the train) and sludge hauling (USD 80–150 per cubic metre of wet cake at 22% DS) — a UASB with biogas CHP at flows above 500 m³/day will offset 30–50% of grid power and pay back the digester premium in 3–5 years. Second, the 2026 membrane market has shifted: PVDF hollow-fibre replacement cycles have stretched from 5 to 7 years in well-operated MBRs, which materially changes lifecycle cost. For a deeper dive on MBR selection, the 2026 MBR system selection guide walks through the cost-efficiency-compliance trade-offs, and the 2026 suspended solids removal comparison covers DAF versus settling alternatives for the upstream step. For COD-specific design choices after the anaerobic stage, the COD reduction methods guide is a useful companion reference.
2026 Regulatory Trends Affecting Brewery Discharge Permits
Three regulatory shifts in 2026 deserve attention from compliance planners now rather than after a violation notice. The U.S. EPA's 2024–2026 effluent guidelines review is expanding PFAS monitoring clauses and whole-effluent toxicity (WET) testing for brewery facilities above 100,000 barrels per year; permit renewals issued in 2026 are the first to carry the new monitoring schedules. In the EU, the BREF for Food, Drink and Milk Industries is in its 2026 update cycle, with draft BAT-AEL ranges trending toward tighter N (15–25 mg/L) and P (2–5 mg/L) caps and a binding water-reuse threshold of ≥ 30% by 2030. In China, GB 19821-2008 remains the national standard, but regional environmental authorities tightened COD caps to 300 mg/L in sensitive watershed areas — the Yangtze and Yellow River basins — effective 2026, with corresponding enforcement inspections.
Frequently Asked Questions
What is the standard BOD limit for brewery wastewater discharge to a municipal sewer in the US?
Under typical NPDES pre-treatment programmes, indirect-discharge BOD₅ limits for brewery effluent to a municipal sewer fall in the 250–400 mg/L band, with TSS ≤ 250 mg/L and pH 6.0–9.0, per EPA 40 CFR Part 405. Limits are site-specific and set by the local control authority, so the exact number is in the brewery's individual permit.
What are the EU BAT-AEL limits for brewery direct discharge in 2026?
The EU Brewing Industry BAT-AEL sets BOD ≤ 25 mg/L, COD 80–125 mg/L, and TSS 35–50 mg/L for direct discharge to surface water, with TN 15–25 mg/L and TP 2–5 mg/L under the 2026 BREF draft for Food, Drink and Milk Industries. These are roughly 5–10× stricter than US indirect-discharge pre-treatment limits.
What does China GB 19821-2008 set as the discharge cap for brewery wastewater?
GB 19821-2008 caps COD at 500 mg/L, BOD₅ at 300 mg/L, suspended solids at 400 mg/L, ammonia at 45 mg/L, and pH 6.0–9.0 for brewery effluent discharged to a municipal treatment plant. The standard remains in force nationally in 2026, with regional tightening to COD 300 mg/L in Yangtze and Yellow River basin watersheds.
What is the typical BOD of raw brewery wastewater before treatment?
Raw brewery influent typically carries 1,500–3,000 mg/L BOD₅ — equivalent to the domestic sewage of 25–50 homes per cubic metre of batch discharge, per the Guide to Brewery Discharges. This is the reason a dedicated pre-treatment train is required before sewer discharge.
Which treatment sequence reliably meets a 25 mg/L BOD discharge limit for a brewery?
The standard 2026 train is: rotary bar screen (3–5 mm) → DAF (TSS < 150 mg/L) → flow/pH equalization → anaerobic UASB or IC (COD removal 80–90%) → aerobic MBR (BOD < 10 mg/L, TSS < 5 mg/L) → chlorine dioxide or UV disinfection. This sequence delivers BOD₅ below 10 mg/L and TSS below 5 mg/L at the outlet, comfortably under the EU BAT-AEL 25 mg/L BOD ceiling.
How much does a brewery wastewater treatment system cost in 2026?
Packaged MBR-plus-DAF systems for craft breweries under 50 m³/day cost USD 25,000–80,000 in CAPEX. Full UASB-plus-MBR trains for 50–500 m³/day regional breweries run USD 250,000–600,000. Macro-brewery plants above 500 m³/day with IC reactors and biogas CHP start at USD 800,000 and exceed USD 2,500,000 with civil works. OPEX is dominated by 0.8–1.4 kWh/m³ electricity and USD 80–150 per m³ of dewatered sludge hauled offsite.