An industrial MBR system for sewage treatment balances effluent quality, energy use, and sector discharge limits. Submerged PVDF flat-sheet modules, such as HydropureWater’s DF Series PVDF flat sheet MBR modules, typically reach 95–99% TSS removal at transmembrane pressures (TMP) as low as 0.1 bar under industrial mixed-liquor conditions. That TMP range often cuts chemical cleaning cycles by 30–50% versus higher-pressure hollow-fiber trains on similar high-solids feeds. Selection hinges on influent COD/TSS, footprint limits, and local pretreatment rules under frameworks such as US EPA 40 CFR Part 403. This guide gives engineering ranges, cost models, and a decision path to match membrane type and train size to plant duty.
Why Plants Choose an Industrial MBR System
Industrial MBR systems combine biological treatment with membrane filtration to hit tight TSS and reuse targets in about 60% less footprint than conventional activated sludge plus tertiary filters. Typical results are 95–99% TSS removal, turbidity below 1 NTU, BOD below 10 mg/L, and energy near 0.3–0.7 kWh/m³ at 15–30 LMH and 8,000–12,000 mg/L MLSS.
A 2025 techno-economic review places broader MBR energy use at 0.4–1.15 kWh/m³ and operating costs near 0.09–0.45 USD/m³ (Gao et al., Engineering, via EurekAlert, 2025). Keep the original industrial design band of 0.3–0.7 kWh/m³ as the planning default, then stress-test bids against the wider published range when power price is high.
Industrial users that discharge to publicly owned treatment works must comply with general pretreatment regulations under 40 CFR Part 403 (US EPA / e-CFR). Categorical limits then come from sector-specific parts, such as 40 CFR Part 414 for organic chemicals. Food plants bring high organic load. Pharmaceutical lines may carry solvents or antibiotics. Textile mills add persistent color. Membrane choice and pretreatment should follow those load patterns rather than a generic municipal template.
Most plants we size for industrial reuse run flux at the lower end of 15–25 LMH when FOG or dye solids are elevated. That choice trades membrane area for longer intervals between CIP events. Where discharge only needs pretreatment to a POTW, a simpler biological train may still win on OPEX. Footprint limits, reuse value, or local numeric caps are what push projects to membranes.
Water purchase prices above roughly $1.00/m³ make on-site reuse pay back faster than discharge-only designs. Cooling towers can often take MBR permeate with minimal hardness polish. Avoided non-compliance exposure in planning cases near $50,000–$500,000 per year also enters many board-level ROI sheets. That line is hard to book as guaranteed cash, yet it still changes risk ranking.
How MBR Systems Work: Engineering Parameters and Mechanisms
A membrane bioreactor pairs a suspended-growth bioreactor with a membrane tank that draws permeate under slight suction. Bioreactors may be aerobic, anoxic, or staged anaerobic–anoxic–aerobic depending on COD and nutrient goals. Flat-sheet and hollow-fiber membranes, usually PVDF or PES with 0.1–0.4 μm pores, retain biomass so MLSS can sit at 8,000–12,000 mg/L. That high solids inventory shrinks reactor volume compared with conventional clarifier-limited plants.
Flat-sheet cassettes, including those used in an MBR Membrane Bioreactor Wastewater Treatment System, favor wider channels and sheet-by-sheet replacement. Hollow-fiber bundles pack more area per tank volume and often start at 25–30 LMH on clean feeds. TMP for submerged trains usually sits at 0.1–0.5 bar. Rising TMP at constant flux is the practical fouling alarm. Aeration supplies oxygen for biology and scour bubbles for membranes. Excess sludge wasting keeps SRT in the design window. Permeate often needs little further solids polishing before UV or chlorine dioxide disinfection.
Process flow is straightforward on paper and unforgiving in the field. Screened wastewater enters the bioreactor, where heterotrophs cut COD. Anoxic zones, when present, let denitrifiers trim nitrate. Mixed liquor then contacts the membranes. Permeate leaves under controlled suction while sludge recycles to hold MLSS. Operators watch three dials daily: TMP trend, dissolved oxygen in the aeration zone, and permeate turbidity. A TMP climb of more than about 0.1 bar at fixed flux over a few days usually means fouling chemistry or pretreatment has slipped.
Sidestream MBR configurations push mixed liquor through external tubular or flat modules at higher crossflow. They tolerate some hot or viscous streams better. Energy often exceeds submerged designs because recirculation pumps replace gravity and coarse bubble scour. For most industrial sewage at ambient temperature, submerged cassettes remain the default unless the client already standardized on sidestream spares.
| Parameter | Typical Range (Industrial MBR) | Impact on Performance |
|---|---|---|
| Transmembrane Pressure (TMP) | 0.1 – 0.5 bar (submerged) | Lower TMP indicates less fouling, reduced energy for cleaning. |
| Flux Rate | 15 – 30 LMH | Higher flux means less membrane area needed, but increases fouling potential. |
| Mixed Liquor Suspended Solids (MLSS) | 8,000 – 12,000 mg/L | Higher MLSS allows for smaller bioreactor volume and enhanced biological treatment. |
| Membrane Pore Size | 0.1 – 0.4 μm (Microfiltration/Ultrafiltration) | Determines effluent quality (TSS, bacteria removal) and fouling susceptibility. |
| Energy Consumption (Aeration & Pumping) | 0.3 – 0.7 kWh/m³ | Major operational cost; influenced by TMP, MLSS, and aeration intensity. |
Flat Sheet vs. Hollow Fiber MBR: Head-to-Head Comparison for Industrial Use

Flat sheet and hollow fiber MBR membranes diverge most on fouling tolerance, packing density, and replacement logistics. Flat sheet modules such as HydropureWater’s PVDF flat sheet MBR modules routinely hold above 98% TSS removal on food-industry solids and FOG when screening and equalization are in place. Wider channels reduce fiber-bundle clogging from hair, fibers, and grease balls that plague many hollow-fiber bundles on the same feeds.
Hollow fiber trains deliver higher packing density and can sustain 25–30 LMH on lower-solids pharmaceutical or municipal-like streams. On oily or fibrous industrial sewage, those same bundles foul faster. CIP frequency climbs and net flux falls. Individual flat-sheet replacement limits downtime to the fouled cassette. Hollow-fiber modules often come out as whole bundles. Energy in the comparison table below remains 0.3–0.5 kWh/m³ for many flat-sheet industrial duties versus 0.4–0.7 kWh/m³ for hollow-fiber trains under comparable aeration intensity.
| Feature | Flat Sheet MBR (e.g., HydropureWater DF Series) | Hollow Fiber MBR (Alternatives) |
|---|---|---|
| Typical Application | High-solids, high-FOG, variable influent (Food, Textile, Pulp & Paper) | Lower-solids, stable influent (Municipal, some Pharmaceutical) |
| TSS Removal Efficiency | >98% | >95% |
| Typical Flux Rate | 15-25 LMH | 25-30 LMH (can be lower in high-fouling conditions) |
| Fouling Resistance | High (robust, wider flow channels) | Moderate (prone to clogging in high-solids/oily wastewater) |
| Membrane Replacement | Individual sheets (lower long-term cost, less downtime) | Module replacement (higher cost, more downtime risk) |
| Energy Consumption (kWh/m³) | 0.3 – 0.5 | 0.4 – 0.7 |
| Pretreatment Requirements | Screening & basic pH adjustment sufficient for many applications | More rigorous pretreatment (e.g., DAF) often needed for high-FOG/solids |
Choose flat sheet when influent TSS, FOG, or fibrous trash is chronically high. Choose hollow fiber when the feed is screened clean, land area for tanks is tight, and operators can keep pretreatment disciplined. Pilot both geometries for at least 30 days on real wastewater before freezing membrane area and blower size.
Procurement teams should also score spare-parts logistics. Flat sheets let a two-person crew swap one damaged panel during a shift. Hollow-fiber module swaps may need a crane window and a spare module on the shelf. Those differences rarely appear in the membrane $/m² line but show up in the first unplanned outage. Ask vendors for mean time between CIP and guaranteed TMP at design flux after 12 months. Confirm whether warranty voids if FOG exceeds a stated mg/L without DAF.
What Equations Estimate MBR Treatment Costs?
MBR treatment cost equations start from capacity-based CAPEX plus volumetric OPEX, then convert both to annual cash flow for ROI. Equipment CAPEX for industrial MBR trains commonly falls between $500 and $1,200 per m³/day of design capacity. Installation and civil works add 30–60% of equipment cost. Engineering adds 10–20%. OPEX lines in the cost table total roughly $0.23–$0.55/m³ when energy, membrane replacement, chemicals, labor, and sludge haul are summed at the stated unit ranges. Independent review data place overall MBR operating costs near 0.09–0.45 USD/m³ across mixed cases (Gao et al., 2025). Plant-specific power price and membrane life still dominate the result.
A working annual OPEX equation is Annual OPEX = Q × (E_energy + E_membrane + E_chem + E_labor + E_sludge). Q is annual permeate volume in m³/year. Each E term is $/m³ from the table. CAPEX screening can use Equipment$ × (1 + f_install + f_eng), with f_install = 0.30–0.60 and f_eng = 0.10–0.20. ROI = ([Annual savings − Annual OPEX] / Capital cost) × 100%. For a 1,000 m³/day plant, $1.00/m³ reuse credit yields about $365,000/year. At $0.40/m³ OPEX ($146,000/year) and $800,000 capital, ROI is about 27.3%/year under those stated assumptions.
Translate energy to money with a second equation: E_energy = SEC × P_elec. SEC is specific energy consumption in kWh/m³. P_elec is the industrial power price in $/kWh. At 0.5 kWh/m³ and $0.15/kWh, energy alone is $0.075/m³. That sits inside the table’s $0.10–$0.20/m³ energy band once pumping and non-ideal aeration are included. Membrane replacement amortized as Module$ / (Life_years × Annual_volume) should use the vendor life that matches your FOG and CIP plan, not the brochure maximum.
Hidden costs still move the spreadsheet. Budget DAF pretreatment for FOG above about 50 mg/L (see the DAF vs. sedimentation cost comparison for MBR pretreatment). Add sludge cake disposal and lost production during CIP downtime. Build those line items before comparing vendor bids on membrane area alone. Urban land opportunity cost near $200/m², when documented in local appraisals, can justify a compact MBR even when volumetric OPEX sits above a sprawling CAS layout.
| Cost Category | Unit | Typical Range (Industrial MBR) | Notes |
|---|---|---|---|
| Capital Costs (CAPEX) | |||
| MBR System Equipment | $/m³/day capacity | $500 – $1,200 | Includes membranes, modules, tanks, pumps, controls. |
| Installation & Civil Works | % of equipment cost | 30% – 60% | Site preparation, piping, electrical, structural. |
| Engineering & Commissioning | % of equipment cost | 10% – 20% | Design, project management, startup. |
| Operational Costs (OPEX) | |||
| Energy (Aeration, Pumping) | $/m³ treated | $0.10 – $0.20 | Major component, varies with system design and influent. |
| Membrane Replacement | $/m³ treated | $0.05 – $0.15 | Depends on membrane type, lifespan, and fouling. |
| Chemicals (Cleaning, pH adjust) | $/m³ treated | $0.02 – $0.05 | For CIP (Clean-in-Place) and maintaining optimal pH. |
| Labor (Operation & Maintenance) | $/m³ treated | $0.05 – $0.10 | Routine checks, cleaning cycles, minor repairs. |
| Sludge Disposal | $/m³ treated | $0.01 – $0.05 | Varies significantly by region and sludge characteristics. |
How Do MBR and RO Unit Costs Compare?
MBR and RO unit costs stack when the plant needs reuse-grade water beyond biological permeate quality. MBR CAPEX at $500–$1,200 per m³/day covers biology plus microfiltration or ultrafiltration. A downstream RO skid adds membrane modules, high-pressure pumps, and antiscalant systems. Incremental RO CAPEX often lands in a similar or higher $/m³/day band, depending on recovery and feed TDS. MBR OPEX energy in the 0.3–0.7 kWh/m³ range is mostly low-pressure aeration and permeate suction. RO energy scales with feed osmotic pressure and usually exceeds MBR pumping energy once TDS rises into brackish or high-conductivity industrial ranges.
Use MBR alone when turbidity below 1 NTU and BOD below 10 mg/L meet cooling or irrigation specs. Add RO when conductivity, dissolved organics, or ion limits require reverse osmosis. A practical sequence is screen → equalize → (DAF if FOG is high) → MBR → optional RO. RO then sees low TSS and more stable SDI. That order protects RO elements. Combined unit cost stays closer to published MBR ranges plus the RO vendor’s power and replacement curves.
Cost comparison tip: quote MBR and RO as separate unit rates, then sum. Bundled “MBR+RO” lump sums hide whether the RO recovery assumption matches your silica and hardness. Ask for SEC in kWh/m³ for each stage, membrane replacement interval, and design recovery. Keep concentrate handling in the same ROI sheet as permeate credit.
Industry-Specific MBR Solutions: Customizing for Food, Pharma, and Textiles
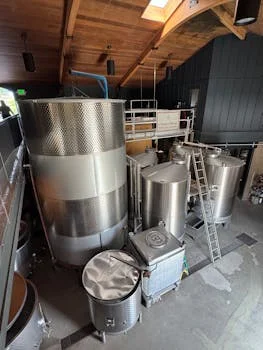
Food and beverage wastewater often carries COD from 5,000–50,000 mg/L with pH swings from about 3 to 11. Designs for that duty target greater than 95% COD removal using pH-tolerant PVDF membranes and equalization to blunt shock loads (HydropureWater case studies, 2025). Screening plus equalization is the minimum pretreatment. High FOG still warrants DAF ahead of the membranes. Nighttime clean-in-place dumps from dairies and beverage lines are the usual shock source. Size the equalizer for at least one peak shift, not the daily average.
Pharmaceutical wastewater may contain solvents, antibiotics, or other inhibitory organics. Near-sterile permeate is often discussed for reuse. Hollow-fiber membranes at about 0.1 μm pore size are frequently selected for bacterial retention when the feed is well pretreated. Toxicity spikes can still stall biology even when membranes remain intact, so many plants keep a diversion tank for offline campaigns. Textile wastewater brings color from persistent dyes. Flat-sheet MBR plus powdered activated carbon dosing has been reported to exceed 99% color removal in referenced plant work (Morui case study, 2025). Sector discharge then maps to EPA categorical rules or EU BAT conclusions such as the textile BAT document 2016/902. Reuse targets may reference WHO drinking-water guideline concepts only where the plant’s permit actually cites them. For food-plant layout detail, see the companion note on food processing wastewater treatment solutions.
Selection checklist for EPC and plant engineers:
- Measure COD, TSS, FOG, temperature, and conductivity on a composite week, not a single grab.
- Confirm whether the permit is direct discharge, POTW pretreatment under 40 CFR Part 403, or reuse.
- Fix membrane geometry after a 30-day pilot at the design flux and MLSS.
- Size blowers for both process oxygen and membrane scour, then verify TMP rise rate.
- Price membrane replacement at the vendor’s guaranteed life (flat sheet 5–8 years; hollow fiber 3–5 years in the FAQ ranges).
- Add DAF or fine screening cost when FOG exceeds about 50 mg/L or solids larger than 1 mm remain.
- If RO follows MBR, reserve floor space and power for high-pressure pumps in the first layout pass.
EU Industrial Emissions Directive 2010/75/EU still frames many European industrial permits, with BAT conclusions filling sector detail. US plants should read Part 403 together with their categorical part number. “MBR” is not an automatic compliance stamp. Design to the numeric limit and sampling location on the permit. Let membrane geometry follow the wastewater matrix.
Who This Is For and Next Step
This guide is for plant engineers, EPC contractors, and procurement teams comparing membrane bioreactors for industrial sewage with reuse or tight pretreatment limits. Look elsewhere if the duty is dilute sanitary wastewater with ample land and a forgiving POTW limit. Conventional activated sludge may then cost less per cubic meter. When you need a sized train, request a duty-sheet review through the project inquiry form with flow, COD/TSS/FOG, and discharge or reuse targets. An integrated MBR Membrane Bioreactor Wastewater Treatment System package can then be matched to those numbers without re-running a generic municipal template.
Frequently Asked Questions
What is the lifespan of MBR membranes?
Flat sheet MBR membranes typically last 5–8 years under industrial operation with proper pretreatment and CIP. Hollow fiber membranes generally last 3–5 years on similar duties. Lifespan shortens when FOG, fibers, or chronic high TMP force aggressive chemical cleans. Stable flux at the low end of 15–25 LMH and screen openings near 1 mm are the usual levers to stay near the upper end of those ranges.
How often do MBR systems need cleaning?
Submerged industrial MBR systems usually need chemical or enhanced backwash cleans 1–4 times per month, depending on influent fouling load and operating flux. Sidestream MBRs at higher crossflow pressure may need cleans 2–6 times per month. Rising TMP at constant flux is the trigger most operators use. Plants that skip screening or DAF on greasy feeds often move to the high end of those frequencies within weeks.
Can MBR systems handle high-temperature wastewater?
Yes, MBR systems can treat high-temperature wastewater when membranes are rated for the duty temperature. PVDF membranes commonly operate between about 40–60°C in industrial listings. Biology still needs acclimation. Sudden jumps above the design range can cut COD removal before the membrane itself fails. Always confirm module datasheet limits and elastomer materials before accepting hot condensate or cook-water dumps into the MBR tank.
What pretreatment is needed for MBR systems?
Effective MBR pretreatment starts with fine screening, typically through a rotary mechanical bar screen, to remove solids larger than about 1 mm. When FOG exceeds roughly 50 mg/L, a dissolved air flotation (DAF) machine protects membranes from oil blinding. pH adjustment into the biological window prevents both process upsets and polymer damage. Equalization tanks damp peak COD that would otherwise drive oxygen deficits and TMP spikes.
Are MBR systems compliant with EPA industrial pretreatment standards?
MBR systems are widely used to help industrial users meet pretreatment obligations under 40 CFR Part 403 when discharging to a POTW. Part 403 sets the general pretreatment framework. Numeric limits then come from categorical standards and local ordinances. MBR effluent often shows 92–97% removal of TSS, BOD, and COD under the conditions cited here, which supports compliance when design matches the permit. Always verify local limits and sampling points before claiming compliance on a bid sheet.