2026 Price Range for Municipal Sewage Treatment Plants
A municipal sewage wastewater treatment plant in 2026 costs between US$5,000 for a 1 m³/h packaged unit and US$25 million for a 50,000 m³/day turnkey A2O or MBR facility — roughly $250–$500 per population equivalent (PE). CAPEX is driven primarily by daily flow, effluent class under EU Directive 91/271/EEC, influent BOD/COD load, and choice of biological process (A2O, SBR, MBR, or MBBR). OPEX typically runs $0.15–$0.85 per m³ treated.
For this article, "municipal plant" covers 1 m³/h to 50,000 m³/day, serving 50 to 500,000 PE, treating domestic sewage with optional pre-treatment for industrial co-digestion. Reference points from 2025 Alibaba listings show integrated MBR packages at $5,000–$240,000 and modular MBBR units at $5,000–$7,000 (per OKproduct scraped data, 2025-10), but these are equipment-only FOB figures, not turnkey EPC prices. A turnkey municipal plant includes civil works, commissioning, one-year warranty, and process guarantees — typically 1.7× to 2.2× the equipment-only sticker. A $50,000 MBR skid becomes a $110,000–$140,000 installed system once blowers, MCC, SCADA, civil tanks, and startup are added.
Use the $250–$500/PE range as a sanity check. A 25,000 PE project (roughly 5,000 m³/day at 200 L/PE·d) should land between $6.25M and $12.5M turnkey. Quotes that fall 40% below this band usually omit civil scope, effluent polishing, or sludge handling — and surface as change orders within 60 days of contract award.
How Influent Load and Effluent Class Drive Plant Price
Two plants with identical flow rates can have price tags that differ by a factor of three, and the difference is almost always the influent/effluent envelope — not the tankage. Typical 2026 municipal influent benchmarks are BOD 150–250 mg/L, COD 300–500 mg/L, TSS 200–350 mg/L, TN 30–60 mg/L, and TP 4–8 mg/L. Each tightening of the effluent envelope forces longer HRT, additional zones, and tertiary polishing.
China GB 18918-2002 Class 1A sets BOD ≤10 mg/L, COD ≤50 mg/L, TN ≤15 mg/L, and TP ≤0.5 mg/L. EU Directive 91/271/EEC sets BOD ≤25 mg/L, COD ≤125 mg/L for plants above 10,000 PE. Reuse-grade targets typically require COD ≤30 mg/L and turbidity ≤2 NTU. The table below maps the most common effluent envelopes to typical biological-stage CAPEX uplift.
| Effluent Class | BOD / COD / TN (mg/L) | Typical Use | Biological-Stage CAPEX Uplift vs Carbon-Only |
|---|---|---|---|
| EU 91/271/EEC baseline | 25 / 125 / 15 | Standard municipal discharge | 0% (baseline) |
| GB 18918-2002 Class 1B | 20 / 60 / 20 | Tightened national discharge | +10–15% |
| GB 18918-2002 Class 1A | 10 / 50 / 15 | Sensitive receiving waters | +15–25% |
| Reuse-grade (irrigation/industrial) | ≤10 / ≤30 / ≤10 | Water reuse, cooling tower make-up | +30–50% (with MBR or RO) |
Nutrient removal — nitrogen and phosphorus — is the second largest cost lever. Adding anoxic and anaerobic zones, internal recycle pumping, and chemical dosing for P precipitation typically adds 20–35% above carbon-only BOD removal (HydropureWater field data, 2026). For projects targeting TP ≤0.5 mg/L, an automatic chemical dosing system sized for 5–25 mg/L alum or FeCl₃ dose per m³ treated is standard, with a chemical OPEX line of $0.012–$0.025/m³.
Process Selection: A2O vs MBR vs SBR vs MBBR Cost Comparison
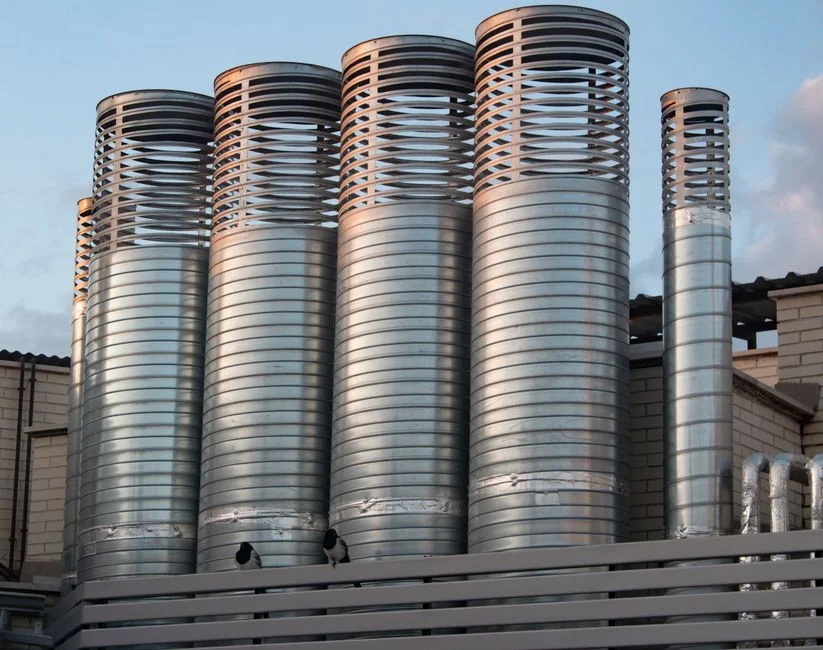
Process choice moves both CAPEX and OPEX by 30–60%, and the right answer is dictated by flow scale, effluent class, and footprint constraints — not by what is cheapest on a spec sheet. The four processes cover roughly 95% of municipal tenders issued in 2025–2026.
| Process | Flow Range | Relative CAPEX (vs A2O) | Footprint | Effluent Quality | OPEX ($/m³) | Best Fit |
|---|---|---|---|---|---|---|
| Conventional A2O | >20,000 m³/day | 1.0× (baseline) | Large | BOD ≤10, TN ≤15 with polishing | $0.18–$0.35 | Large municipalities, land available |
| MBR | 100–50,000 m³/day | 1.3–1.5× | ~40% of A2O | BOD ≤5, turbidity ≤1 NTU, reuse-ready | $0.30–$0.55 | Urban, water-reuse, strict effluent |
| SBR | 1,000–20,000 m³/day | 0.9–1.1× | Moderate | BOD ≤20, TN ≤15 with decanting | $0.20–$0.40 | Mid-size plants, variable influent |
| MBBR | 50–10,000 m³/day | 0.7–0.8× | Compact | BOD ≤20, TN ≤15 with chemical P | $0.22–$0.40 | Carbon removal, retrofit, tight sites |
Decision rule. Below 500 m³/day, specify a packaged MBR membrane bioreactor system or a buried WSZ underground package sewage treatment plant with MBBR or A/O process. From 500–5,000 m³/day, MBBR or SBR gives the best $/m³ economics. From 5,000–20,000 m³/day, SBR or MBR is competitive — choose SBR if land is available, MBR if the plant is enclosed or must meet reuse-grade effluent. Above 20,000 m³/day, conventional A2O wins on CAPEX, with an optional MBR polishing stage if reuse contracts justify the 30–50% premium (HydropureWater reference data, 2026).
Price by Capacity: 2026 CAPEX Tiers
Locating your project in the right capacity tier is the fastest way to validate a vendor quote. The table below segments turnkey EPC CAPEX by daily flow and population equivalent, with the dominant process for each tier.
| Tier | Flow (m³/day) | PE | Turnkey CAPEX (USD) | Dominant Process | Typical Scope |
|---|---|---|---|---|---|
| 1 | 1–50 | 50–250 | $5,000–$80,000 | MBBR / A/O packaged | Buried or skid unit, chlorination |
| 2 | 50–500 | 250–2,500 | $80,000–$500,000 | Containerized MBR / SBR | Container modules, UV or ClO₂, basic SCADA |
| 3 | 500–5,000 | 2,500–25,000 | $0.5M–$3.5M | Skid MBR / MBBR | Pre-treatment with mechanical bar screening, disinfection, sludge dewatering |
| 4 | 5,000–20,000 | 25,000–100,000 | $3.5M–$12M | Conventional A2O + tertiary | Grit removal, A2O basins, tertiary filtration, UV, belt press |
| 5 | 20,000–50,000 | 100,000–500,000 | $12M–$25M | Full A2O / MBR | Sludge dewatering, odor control, full SCADA, standby power |
These tiers assume Class 1A or EU-compliant effluent, civil works included, and a 12–18 month construction window. A 50,000 m³/day plant with MBR polishing for direct water reuse sits at the upper end — closer to $25M — while a basic A2O plant with chlorine disinfection lands near $18M. EPC contractors quoting below $9M for a Tier 4 project are almost certainly excluding civil works or sludge handling.
7 Hidden Cost Drivers That Move the Final Quote
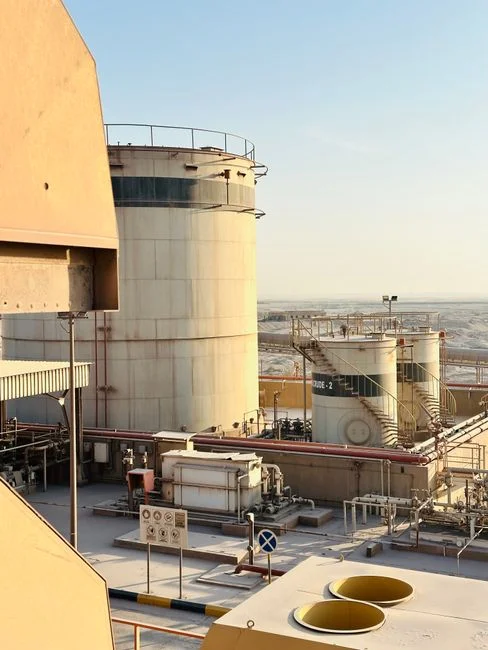
Industry data shows 25–40% of municipal plant CAPEX shows up as change orders rather than the original quote. Seven spec choices consistently drive the gap between a vendor's opening number and the final invoice.
- Civil works (tanks, foundations, earthworks): 20–35% of turnkey CAPEX, varying widely by soil bearing capacity, seismic zone, and groundwater table. A 10,000 m³/day plant on soft alluvium can carry 40% more civil cost than the same plant on competent soil.
- Automation tier: basic PLC with local HMI vs full SCADA/DCS adds 5–12% to CAPEX but cuts OPEX labor by 30–50%. Plants under 500 m³/day typically run unstaffed with remote telemetry.
- Disinfection choice: chlorine gas is cheapest at CAPEX but carries $0.008–$0.015/m² chemical OPEX and safety obligations. UV has 2–3× the CAPEX of chlorination but near-zero chemical OPEX. A chlorine dioxide disinfection system sits in the middle, compliant with EU Drinking Water Directive 98/83/EC parameters for trihalomethane control.
- Sludge handling: a plate and frame sludge dewatering press line costs $30,000–$400,000 depending on capacity. Skipping it and trucking liquid sludge at 3–5% solids doubles the 20-year disposal OPEX.
- Odor control for covered or urban plants: $350K+ CAPEX, $14K/year OPEX for a 10,000 m³/day plant (per HydropureWater 2026 reference data). Activated-carbon polishing alone can add $80,000–$200,000.
- Backup power: standby diesel generators sized for 60–80% of running load add 3–8% of CAPEX, and are mandatory in most municipal tenders where sewer overflow carries a daily penalty.
- Permitting, EIA, and pilot testing: 2–6% of CAPEX and frequently the cause of project delays. A 6-month pilot on a 200 m³/day trailer can run $40,000–$90,000 but typically saves 5–10% on full-scale design errors.
Each line item interacts. A 10,000 m³/day plant with MBR polishing, UV disinfection, full SCADA, plate-and-frame dewatering, and standby power runs 30–45% above the same plant with A2O, chlorination, basic PLC, and belt press sludge handling.
2026 OPEX Benchmarks: Energy, Chemicals, Labor, Sludge
Total OPEX for a municipal plant runs $0.15–$0.85 per m³ treated in 2026, depending on process and scale (HydropureWater reference data). For a 20-year NPV at 5% discount, OPEX typically equals 1.5× to 2.5× the original CAPEX — so underestimating OPEX by $0.10/m³ on a 10,000 m³/day plant costs $7.3M over the asset life.
Energy is the largest line, at 50–60% of OPEX, dominated by aeration blowers and recirculation pumps. MBR systems sit at the upper end of this band — membrane scouring alone adds 0.08–0.15 kWh/m³ beyond carbon-removal aeration. Chemicals (P-precipitation, pH adjustment, disinfection residuals) account for 8–15% of OPEX, and are controllable with automatic chemical dosing for nutrient removal, which typically cuts chemical consumption 12–20% versus manual dosing.
Labor is 10–20% of OPEX, falling sharply with automation. Packaged plants at 50–200 m³/day can run unstaffed with weekly site visits; plants above 5,000 m³/day need at least one full-time operator per shift. Sludge disposal is $40–$130 per metric ton of dewatered cake, representing 10–18% of OPEX. Pre-thickening with a DAF pre-treatment system and a high-efficiency sedimentation tank upstream of the biological stage can cut wet sludge mass 15–25% before dewatering, directly lowering the disposal line (per HydropureWater 2026 reference).
How to Read a Municipal Sewage Plant Quote in 2026
Three questions separate a defensible quote from a low-ball proposal that will trigger change orders.
Question 1 — Scope. Is the quote turnkey EPC (civil, mechanical, electrical, commissioning, one-year warranty, process guarantee) or equipment-only FOB? Equipment-only is typically 45–60% of turnkey cost. A $4M MBR skid becomes a $9M turnkey plant once civil works, MCC, and startup are added.
Question 2 — Effluent guarantee. Which effluent class is guaranteed, and what is the liquidated-damages clause if BOD, TN, or TP exceed? A vendor guaranteeing GB 18918-2002 Class 1A with a $5,000/day non-compliance penalty carries a real engineering cost. A vendor guaranteeing only EU 91/271/EEC baseline with no penalty has built margin for effluent excursions into the price.
Question 3 — Membrane and media life-cycle. What is the MBR membrane replacement interval (typically 7–10 years at $45–$80/m² membrane area) and the MBBR media replacement cost ($180–$320/m³ of media)? Is the cost priced into the OPEX forecast, or is it an undisclosed future expense? Compare bids on $/m³/day delivered capacity rather than total project price, and review DCS and PLC automation for municipal plants alongside any quote that bundles control system scope.
Frequently Asked Questions
What is the 2026 cost per population equivalent (PE) for a municipal sewage plant? Turnkey municipal plants in 2026 land between $250 and $500 per PE, with the wide range driven by effluent class and process choice. A 25,000 PE plant at Class 1A effluent with conventional A2O sits near $280/PE; the same plant with MBR polishing for reuse lands closer to $480/PE (HydropureWater field data, 2026).
Is MBR more expensive than A2O for municipal plants in 2026? Yes — MBR carries 30–50% higher CAPEX than conventional A2O due to membrane modules and scouring aeration, and 30–60% higher OPEX ($0.30–$0.55/m³ vs $0.18–$0.35/m³). MBR is justified where footprint is constrained, where the plant is enclosed, or where the effluent is sold for reuse at $0.30–$0.80/m³ under a 2026 water reuse contract.
What are the most commonly missed cost drivers in a municipal WWTP quote? Civil works (20–35% of turnkey CAPEX), odor control for urban sites ($350K+), and sludge dewatering line cost are the three most frequently omitted line items. Permitting, EIA, and pilot testing add another 2–6% that often shows up as a project delay rather than a cost line. See 2026 sludge disposal cost benchmarks for the OPEX-side counterpart.
What is the smallest municipal plant size that is economically viable in 2026? Packaged units below 50 m³/day (250 PE) are economically viable only for decentralized clusters, resorts, or remote townships. Below 200 PE, the per-PE cost climbs sharply because fixed automation, disinfection, and control costs are spread over fewer users — expect $400–$500/PE at the 100 PE scale versus $280/PE at 2,500 PE.