Why Winery Wastewater Defeats Standard Treatment Trains
Crush-season loads at wineries typically run 10–50× the dry-month average, with weekly swings inside a single vintage driven by tank transfers, barrel rinses, and bottling line clean-in-place. The 2009 Australian winery wastewater survey recorded BOD₅ in untreated effluent spanning the low thousands to >10,000 mg/L depending on tank and wash operations (source: Sheridan et al., Evaluation of organic matter concentration in winery wastewater: A case study from Australia, 2009-11). That is an order of magnitude beyond domestic sewage, and it arrives in pulses rather than as a steady feed.
Municipal co-treatment fails for two engineering reasons. First, low pH (3.5–5.5) and high sulfate (50–500 mg/L) inhibit nitrifying biomass and corrode concrete sewer assets within a few seasons. Second, polyphenols, tannins, and potassium — absent from municipal specs — require biological acclimation and dedicated color-removal polishing. The practical answer is a purpose-built train with equalization, pH correction, and a biological stage sized for the harvest peak rather than the annual average; that is the design assumption behind every section that follows.
Winery Effluent Characteristics: 2026 Parameter Bands
Every design starts with the influent envelope. The table below consolidates 2026 design bands drawn from the 2009 Australian case study, EU UWWTD 91/271/EEC discharge limits, EPA 40 CFR 405 categorical standards for SIC 2084, and the ANZECC 2000 irrigation trigger values. Use it directly for mass-balance and aeration sizing.
| Parameter | Influent range (winery) | EU UWWTD discharge limit | EPA 40 CFR 405 winery limit | Vineyard reuse target |
|---|---|---|---|---|
| Flow | 5–15 L effluent per L wine produced | — | — | Match crop demand |
| pH | 3.5–5.5 | — | 6.0–9.0 | 6.5–8.5 |
| TSS | 200–4,000 mg/L | 35 mg/L (95/50 percentile) | 28 lb / 1,000 lb product (30-d avg) | ≤30 mg/L |
| BOD₅ | 1,000–12,000 mg/L | 25 mg/L | 26 lb / 1,000 lb product (30-d avg) | ≤20 mg/L |
| COD | 2,000–25,000 mg/L | 125 mg/L | — | ≤100 mg/L |
| Sulfate (SO₄²⁻) | 50–500 mg/L | — | — | ≤250 mg/L |
| Total nitrogen | 10–80 mg/L | 15 mg/L (N total) | — | ≤15 mg/L |
| Temperature | 10–35 °C | — | — | — |
Two non-municipal parameters drive equipment selection. Potassium, polyphenols, and tannins accumulate in the biological reactor and depress nitrification rates by 20–30% unless the biomass is acclimated over 4–6 weeks. Reactor performance also drops 30–40% when winter influent falls below 12 °C, which justifies enclosed or heated MBR and anaerobic tanks in cool-climate regions (Burgundy, Marlborough, Walla Walla). Treat any reuse design — vineyard drip, CIP wash, or boiler feed — as a separate polishing problem on top of discharge compliance.
Process Flow: Screening → Equalization → Primary → Biological → Polishing
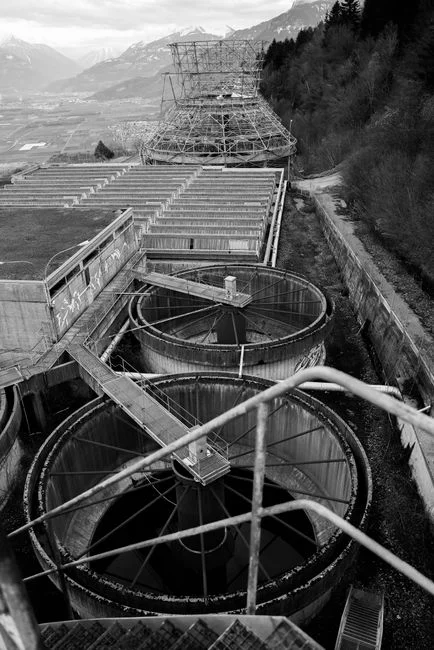
A winery effluent treatment plant is a six-stage train. Each stage has a specific load-removal target, and the sizing of the biological reactor depends entirely on what the upstream stages pass through.
- Coarse screening. A rotary bar screen for headworks at 3–6 mm aperture removes stems, skins, and labels, capturing 95%+ of gross TSS before it reaches the equalization tank. This is the single most underrated unit operation in winery design — without it, the downstream DAF and MBR will rag up within weeks.
- Flow and pH equalization. A 24–48 hour buffer tank sized at 60–80% of peak daily flow dampens the crush pulse. A pH correction and coagulant dosing skid using lime or NaOH lifts pH into the 6.5–7.5 biological window; nutrient dosing (urea + phosphoric acid) is added here when BOD:N:P exceeds 100:5:1.
- Primary clarification. A winery wastewater DAF clarifier with a 6–8% recycle ratio and 0.4–0.6 kg air/kg solids achieves 70–90% TSS removal and 30–50% COD removal in a single pass. Lamella plates are an alternative for sites with a tight footprint, but DAF is the 2026 default because it handles the fatty and phenolic fractions better.
- Biological treatment. The reactor type is selected in the next section; for wineries above 200 m³/day, an MBR biological treatment train delivers the smallest footprint and reuse-grade effluent in a single step.
- Tertiary polishing. Multi-media filtration or activated carbon strips residual color and refractory COD to below 50 mg/L, after which UV or chlorine dioxide drops the disinfection byproducts that would otherwise damage drip-irrigation emitters.
- Sludge handling. The combined DAF float and biological waste activated sludge are thickened and dewatered on a filter press, dropping moisture from 98–99% to 65–75% cake solids before disposal or composting.
Technology Comparison: UASB vs SBR vs MBR vs Constructed Wetlands
Selecting the biological stage is the single most consequential CAPEX decision. The matrix below benchmarks the four reactor types that dominate 2026 winery design against a normalized 1,000 m³/day design flow with a 5,000 mg/L COD influent.
| Reactor type | Footprint (m² per m³/d) | COD removal % | Effluent COD (mg/L) | CAPEX (USD per m³/d) | OPEX (USD per m³ treated) | Energy (kWh/m³) | Best-fit winery size |
|---|---|---|---|---|---|---|---|
| Anaerobic UASB / EGSB | 0.15–0.25 | 70–90% | 500–1,500 | 180–280 | 0.25–0.45 | 0.05–0.15 | >500 m³/d with biogas use |
| SBR (batch aerobic) | 0.20–0.35 | 90–95% | 250–500 | 220–340 | 0.40–0.65 | 0.5–0.9 | 100–500 m³/d with harvest pulse |
| MBR | 0.08–0.15 | 95–98% | <100 (typically <50) | 420–650 | 0.55–0.85 | 0.7–1.2 | >200 m³/d requiring reuse |
| Constructed wetlands | 5–15 | 60–85% | 750–2,000 | 90–180 | 0.05–0.15 | 0 | <50 m³/d boutique with land |
UASB and EGSB digesters carry 10–15 kg COD/m³·d loading rates, produce usable biogas (0.35–0.45 m³ CH₄ per kg COD removed), and run at near-zero aeration cost — but they almost always need a downstream aerobic polish to meet discharge BOD limits (per EU UWWTD 91/271/EEC, BOD 25 mg/L). MBR, using an MBR biological treatment train with the MBR membrane module rated at 0.05–0.10 μm, holds 12–18 g/L MLSS — roughly three times a conventional activated-sludge tank — which is what collapses the footprint by ~60% versus CAS. SBR remains a strong middle-ground for sites where the harvest pulse genuinely needs batch flexibility, though it produces 20–30% more waste sludge than MBR. Constructed wetlands suit boutique operations with land and warm winters; they fail economically below 5 °C and cannot meet reuse TDS limits without downstream RO.
Sizing and Cost: 2026 CAPEX and OPEX Benchmarks
Translate the technology decision into procurement numbers with the table below; ranges are turnkey 2026 figures inclusive of civil works, equipment, and commissioning, drawn from EPC bids and HydropureWater field data, 2026.
| Train configuration | CAPEX (USD per m³/d capacity) | OPEX (USD per m³ treated) | Energy (kWh/m³) | Sludge yield (kg DS per m³) |
|---|---|---|---|---|
| UASB + SBR polish | 180–280 | 0.25–0.45 | 0.4–0.7 | 0.15–0.25 |
| SBR only | 220–340 | 0.40–0.65 | 0.5–0.9 | 0.20–0.35 |
| UASB + MBR | 380–550 | 0.50–0.75 | 0.6–1.0 | 0.10–0.18 |
| MBR only | 420–650 | 0.55–0.85 | 0.7–1.2 | 0.12–0.20 |
| Wetlands + disinfection | 90–180 | 0.05–0.15 | 0.0–0.1 | n/a |
Two savings levers dominate the ROI. First, water reuse: a 1,000 m³/d winery reusing MBR permeate for vineyard irrigation or CIP can offset 30–60% of incoming fresh water, with a typical payback of 2.5–4.5 years against the MBR premium (see the 2026 industrial water reuse outlook). Second, sludge handling: a sludge dewatering filter press cuts disposal mass by 75–85%, which at USD 40–130 per metric ton of wet cake (per the 2026 sludge disposal cost data) is the second-largest line item after energy. EU CSRD reporting requirements taking effect in 2026, plus rising municipal sewer discharge fees in Napa, Barossa, and Stellenbosch, are pulling paybacks below three years for in-plant treatment versus sewer discharge.
Discharge and Reuse Compliance: EU, US, Australia, South Africa
Each major producing region sets a different numeric ceiling, and the 2026 train must be selected against the strictest applicable standard.
- EU. Urban Waste Water Directive 91/271/EEC — BOD 25 mg/L, COD 125 mg/L, TSS 35 mg/L, total nitrogen 15 mg/L (95/50/15 percentile basis for discharges >2,000 PE equivalent). Local authorities may impose stricter limits on COD color and phenols.
- USA. EPA 40 CFR Part 405 categorical standards for wineries (SIC 2084) — BOD₅ 30-day average 26 lb per 1,000 lb product, TSS 28 lb per 1,000 lb product, with pH 6.0–9.0 daily max. NPDES permits in California and Oregon routinely require 10–20% tighter limits than the federal floor.
- Australia. NWQMS wineries guideline plus state EPA licences (EPA Victoria, EPA SA, NSW EPA). Vineyard irrigation reuse is gated by ANZECC 2000 trigger values: TDS <1,000 mg/L, SAR <6, pH 6.5–8.5.
- South Africa. DWAF Best Practice Guideline for Wineries sets irrigation reuse limits on SAR, pH, and COD — typically COD <75 mg/L and SAR <5 for drip-irrigation blocks.
Any train that meets the EU 25/125/35 envelope will clear US, Australian, and South African discharge limits without rework. Reuse targets are a separate problem: drip irrigation or boiler feed requires UF or RO polishing plus a chlorine dioxide disinfection system to prevent biofilm fouling in the distribution network.
Frequently Asked Questions
What influent BOD and COD levels must a winery effluent treatment plant handle?
Crush-season BOD₅ typically runs 1,000–12,000 mg/L and COD 2,000–25,000 mg/L, with peak values 10–50× the dry-month average (per the 2009 Australian case study). Design the equalization tank and biological reactor against the peak, not the annual mean.
UASB or MBR — which is the right biological stage for a winery?
Choose UASB or EGSB for wineries above 500 m³/day with biogas utilization and discharge-only targets; choose MBR for any winery above 200 m³/day that needs reuse-grade permeate, color removal, or the smallest footprint. Anaerobic alone rarely meets the EU UWWTD 25 mg/L BOD limit without an aerobic polish.
What does a turnkey winery effluent treatment plant cost in 2026?
USD 180–650 per m³/day of capacity depending on the biological stage: wetlands at the low end, UASB + SBR in the middle, MBR at the top. OPEX runs USD 0.25–0.85 per m³ treated, dominated by energy (0.4–1.2 kWh/m³) and sludge disposal.
Can winery wastewater be reused for vineyard irrigation?
Yes — MBR permeate combined with RO polishing can hit TDS <1,000 mg/L and SAR <6, the ANZECC 2000 trigger values. A 1,000 m³/day winery can offset 30–60% of fresh water this way, with payback of 2.5–4.5 years against the MBR premium (per the 2026 industrial water reuse outlook).
Which regulatory frameworks apply to a winery treatment plant in 2026?
EU UWWTD 91/271/EEC for European producers, EPA 40 CFR Part 405 for US wineries, state EPA licences under the NWQMS framework in Australia, and the DWAF Best Practice Guideline in South Africa. EU CSRD reporting obligations now in force for 2026 also require wineries to disclose water withdrawal and discharge intensity.