What Makes Gelatin Wastewater Different from Other Food Effluents
Gelatin wastewater is a high-strength, protein-rich industrial effluent with typical COD 5,000–25,000 mg/L, BOD₅ 3,000–15,000 mg/L, pH 4.0–6.5, and temperature 40–55 °C. Treatment relies on a train of screening, equalization, dissolved air flotation (DAF), anaerobic digestion (UASB/IC), and MBR, achieving effluent COD ≤100 mg/L and meeting China GB 30485-2020 and EU food-sector discharge limits.
Gelatin is produced by acid (Type A), alkaline (Type B), or enzymatic hydrolysis of bovine, porcine, or fish collagen — three routes that converge on similar wastewater profiles. A typical plant generates three principal streams: soak/liming liquor (alkaline, high in protein and sulfide), extraction condensate (hot, dilute, but high in soluble BOD), and washing water (variable, often carrying suspended hide scraps). Combined flows run 50–500 m³/d, with peaks driven by hide and bone supply cycles.
The characterization that matters: COD 5,000–25,000 mg/L, BOD₅ 3,000–15,000 mg/L, TSS 800–4,000 mg/L, total nitrogen 200–800 mg/L, pH 4.0–6.5, temperature 40–55 °C, and sulfate 300–1,500 mg/L from acidulation steps (HydropureWater field data, 2026). These numbers put gelatin wastewater well above dairy (COD ~1,000–3,000 mg/L) and meat processing (COD ~2,000–6,000 mg/L), which is why plants designed for those effluents routinely underperform when retrofitted for gelatin. The high soluble protein fraction — not just suspended solids — combined with elevated temperature that depresses mesophilic kinetics and sulfate that inhibits methanogens, makes gelatin one of the more demanding food-industry wastewaters. A well-sized DAF unit for protein and FOG removal is the first non-trivial investment in any treatment train.
Gelatin Wastewater Characterization: Key Parameters and Sampling
A defensible treatment-train design starts with a 7-day composite sampling campaign across a full production week — gelatin plants routinely swing 2–3× between peak and low days tied to hide and bone deliveries. Single-grab sampling is a common cause of undersized equalization basins and overloaded anaerobic reactors.
The parameter set an engineer must measure, with standard methods: COD (APHA 5220-D, closed reflux colorimetric), BOD₅ (APHA 5210-B, 5-day BOD), TSS and VSS (APHA 2540-D and 2540-E), total nitrogen (APHA 4500-N), ammonia (APHA 4500-NH₃), total phosphorus (APHA 4500-P), sulfate (APHA 4500-SO₄²⁻), chloride, pH, temperature, FOG, sulfide, conductivity, and true color in Pt-Co units.
| Parameter | Low | Mid | High | Method |
|---|---|---|---|---|
| COD (mg/L) | 5,000 | 12,000 | 25,000 | APHA 5220-D |
| BOD₅ (mg/L) | 3,000 | 7,500 | 15,000 | APHA 5210-B |
| TSS (mg/L) | 800 | 2,000 | 4,000 | APHA 2540-D |
| VSS (mg/L) | 600 | 1,500 | 3,200 | APHA 2540-E |
| Total N (mg/L) | 200 | 450 | 800 | APHA 4500-N |
| NH₃-N (mg/L) | 40 | 120 | 300 | APHA 4500-NH₃ |
| Total P (mg/L) | 20 | 50 | 100 | APHA 4500-P |
| Sulfate (mg/L) | 300 | 800 | 1,500 | APHA 4500-SO₄²⁻ |
| FOG (mg/L) | 200 | 600 | 1,200 | APHA 5520-B |
| pH | 4.0 | 5.5 | 6.5 | APHA 4500-H⁺ |
| Temperature (°C) | 40 | 48 | 55 | APHA 2550 |
Four parameters drive most of the engineering decisions downstream: ammonia controls MBR sizing and nitrification HRT; sulfate dictates whether a single-stage IC reactor is sufficient or a two-stage anaerobic system is needed; temperature forces cooling or equalization basin design above 40 °C; and FOG sets the pre-DAF chemical dose and skimmer capacity. Color (Pt-Co 1,000–4,000) rarely drives a separate unit operation but matters for direct-discharge permits in the EU.
The Standard Gelatin Wastewater Treatment Train
The seven-stage train below is the configuration most often specified for plants in the 50–500 m³/d range, based on field installations and engineering references covering acidulation wastewater treatment and collagen hydrolysis effluent streams. Each stage targets a specific fraction of the load; skipping stages almost always shows up as fouling, foaming, or non-compliance within six months of startup.
- Screening and grit removal. A rotary bar screen with 2–5 mm aperture recovers hide scraps and bone chips, protecting downstream pumps and the DAF from ragging.
- Equalization and temperature control. Basin sized for 12–24 h HRT; cooling to ≤35 °C (above 40 °C, mesophilic anaerobic kinetics in an IC reactor are inhibited); pH adjusted to 6.8–7.2 with NaOH or lime.
- Coagulation/DAF. PAC 200–400 mg/L plus PAM 5–10 mg/L fed through an automated coagulant and flocculant dosing system ahead of the DAF — typically 60–80% TSS, 40–55% COD, and 70–90% FOG removal.
- Anaerobic biological treatment. IC or UASB reactor at OLR 5–12 kg COD/m³·d, HRT 24–48 h, achieving 70–85% COD removal and 0.35–0.45 m³ biogas per kg COD removed; methane content 65–75%.
- Aerobic polishing / MBR. Submerged PVDF flat-sheet MBR at 0.1 μm pore size, MLSS 8,000–12,000 mg/L, HRT ≥6 h for stable effluent COD ≤100 mg/L.
- Disinfection. ClO₂ disinfection generator at 1–3 mg/L residual or UV at ≥40 mJ/cm²; target fecal coliform <1,000 CFU/100 mL (China GB) or <200 CFU/100 mL (EU).
- Sludge dewatering. Plate-and-frame filter press for gelatin sludge producing 18–22% DS cake, reducing disposal volume by approximately 85%.
| Stage | Equipment | Key removal / output | Operating target |
|---|---|---|---|
| 1 | Rotary bar screen | Solids capture | 2–5 mm aperture |
| 2 | Equalization basin | Flow/temp/pH dampening | 12–24 h HRT, ≤35 °C, pH 6.8–7.2 |
| 3 | DAF + chemical dosing | TSS 60–80%, COD 40–55%, FOG 70–90% | PAC 200–400 mg/L; PAM 5–10 mg/L |
| 4 | IC / UASB reactor | COD 70–85% | OLR 5–12 kg COD/m³·d; HRT 24–48 h |
| 5 | MBR | COD ≤100 mg/L; NH₃-N ≤15 mg/L | MLSS 8,000–12,000 mg/L; HRT ≥6 h |
| 6 | ClO₂ or UV | Fecal coliform reduction | 1–3 mg/L ClO₂; ≥40 mJ/cm² UV |
| 7 | Filter press | Sludge cake 18–22% DS | PAM-tuned to jar test |
Process-flow detail: screening protects the rotary bar screen and grit removal stage from ragging, equalization buffers the daily 2–3× swings, DAF knocks out the FOG that would otherwise coat the IC reactor media and cause acidification, and the MBR polish is what gets the plant to ≤100 mg/L COD. Field data from 2025–2026 installations show that the MBR stage is the single biggest differentiator for meeting 2026 discharge limits.
Comparing Treatment Train Options for Gelatin Plants
For procurement, the practical decision is between CAS, SBR, and an anaerobic IC + MBR configuration. Each option has a defensible place; the wrong choice shows up as either an oversized footprint, a non-compliant effluent, or a payback period that never closes. Use the table below as a first-pass filter before requesting vendor quotes.
| Train | Influent COD (mg/L) | Effluent COD (mg/L) | Footprint (m² per 50 m³/d) | CAPEX (USD) | OPEX (USD/m³) | Suitable discharge |
|---|---|---|---|---|---|---|
| CAS (conventional activated sludge) | 5,000–12,000 | 200–400 | 180–260 | 180,000–280,000 | 0.9–1.2 | Municipal sewer (indirect) |
| SBR (sequencing batch reactor) | 5,000–15,000 | 150–250 | 110–170 | 240,000–360,000 | 1.0–1.4 | Sewer or weak direct |
| Anaerobic IC + MBR (recommended) | 5,000–25,000 | ≤100 | 60–95 | 420,000–650,000 | 1.1–1.8 | Direct discharge (GB 30485 / EU) |
CAPEX and OPEX benchmarks above are for a 50 m³/d plant (HydropureWater field data, 2026); larger plants in the 200–500 m³/d range scale sub-linearly on CAPEX per m³. The anaerobic IC + MBR option carries a higher upfront cost but recovers 0.35–0.45 m³ biogas per kg COD removed, which — at typical industrial natural-gas prices — yields a 5–7 year payback when biogas is valorized for boiler or CHP use. Plants in regions with low gas prices or no on-site heat demand should still size the IC reactor for the treatment benefit, treating biogas as a secondary credit. For a deeper CAPEX/OPEX breakdown, see the MBR cost benchmark for food processing or compare against the high-strength protein wastewater cost benchmark for similar protein-loaded effluents. The full MBR polishing stage for gelatin effluent and the MBR membrane module specification are the two specification points most often negotiated.
2026 Discharge Standards for Gelatin Wastewater
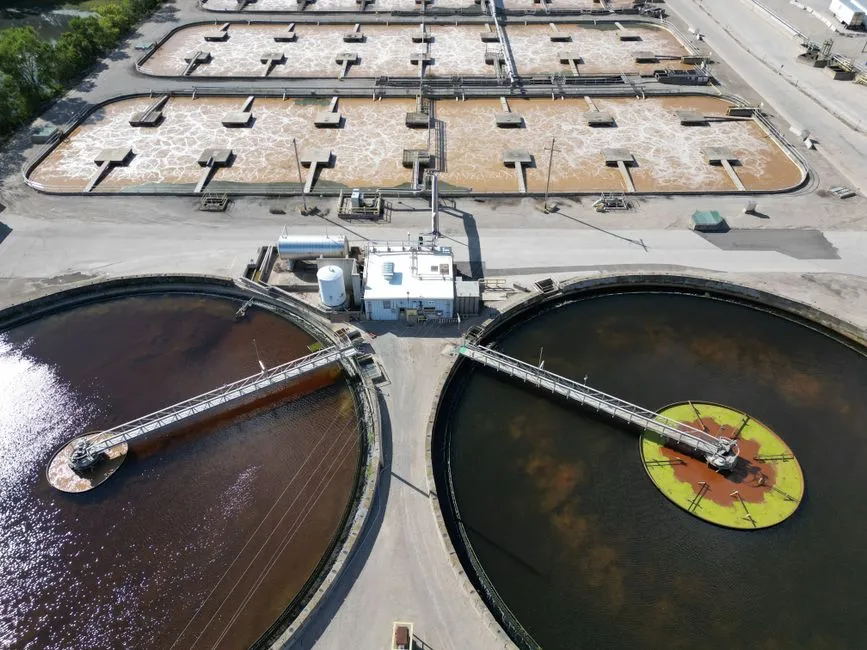
Gelatin plants operate under three regulatory families depending on jurisdiction. The table below lists the limits that govern direct discharge to a receiving water; plants discharging to municipal sewer face weaker but still enforced local pretreatment limits (typically BOD₅ ≤300–500 mg/L and TSS ≤400 mg/L at the POTW headworks).
| Parameter | China GB 30485-2020 | EU 91/271/EEC (food sector, direct) | U.S. EPA 40 CFR 432 (direct, >7.5 ML/d) |
|---|---|---|---|
| COD (mg/L) | ≤100 | ≤125 | — |
| BOD₅ (mg/L) | ≤20 | ≤25 | ≤26 |
| NH₃-N (mg/L) | ≤15 | ≤10 (sensitive areas) | — |
| SS (mg/L) | ≤30 | ≤35 | ≤23 (TSS) |
| pH | 6–9 | 6.5–9.5 | 6–9 |
| Fecal coliform (CFU/100 mL) | ≤1,000 | ≤200 (bath contact) | — |
China GB 30485-2020 (COD ≤100, BOD ≤20, NH₃-N ≤15, SS ≤30, pH 6–9) applies to direct discharge from meat/food processing including gelatin. EU plants discharging directly to a watercourse fall under Directive 91/271/EEC plus national implementing rules — Germany AbwV Annex 22 and France Arrêté 24/08/2017 set COD ≤125 mg/L and BOD₅ ≤25 mg/L for the food sector. The U.S. EPA Meat & Poultry Products Point Source Category (40 CFR Part 432) is the closest applicable ELG — BOD₅ ≤26 mg/L and TSS ≤23 mg/L — but only applies to facilities above 7.5 ML/d; smaller gelatin plants typically discharge under local POTW pretreatment. Only an MBR-equipped train hits all three frameworks on direct discharge; CAS trains are limited to indirect sewer scenarios.
Operating Tips and Common Failure Modes
Most first-year operating problems on gelatin plant treatment trains trace back to FOG breakthrough, hydraulic overload of the anaerobic reactor, or under-tuned sludge dewatering. The four most common failure modes and their fixes:
- Foaming in the aerobic tank. Usually a sign of excess FOG bypassing DAF; fix by increasing DAF skimmer frequency and raising the PAM dose. Run a jar test to confirm.
- IC reactor acidification. Caused by hydraulic overload or sulfate spikes; throttle feed and add bicarbonate alkalinity to hold the VFA/alkalinity ratio below 0.3.
- MBR membrane fouling from residual protein. Control by holding mixed liquor at 8,000–12,000 mg/L MLSS, keeping HRT ≥6 h, and scheduling CIP every 30–60 days.
- Sludge dewatering cake moisture above 80%. Almost always a polymer issue; re-tune PAM molecular weight and dose with a jar test, and check that filter press cloth is not blinded.
Following a documented DAF maintenance checklist catches most skimmer and dosing faults before they cascade into the IC reactor. Plants that run weekly jar tests on DAF sludge and monthly CIP on the MBR routinely see 30–50% longer membrane life than those that run reactive maintenance.
Frequently Asked Questions
What is the typical COD of gelatin wastewater? Raw gelatin wastewater typically runs COD 5,000–25,000 mg/L, with a mid-range of about 12,000 mg/L in plants running a mixed hide/bone raw material mix (APHA 5220-D).
Can a conventional activated sludge system treat gelatin wastewater? CAS can treat gelatin wastewater but only to an effluent of 200–400 mg/L COD, which is suitable for indirect discharge to a municipal sewer — not for direct discharge under China GB 30485-2020 (≤100 mg/L) or EU 91/271/EEC (≤125 mg/L).
What is the 2026 CAPEX for a 50 m³/d gelatin wastewater treatment plant? A 50 m³/d plant using an anaerobic IC + MBR train runs USD 420,000–650,000 in CAPEX, with OPEX of USD 1.1–1.8 per m³ (HydropureWater field data, 2026); CAS-based plants are cheaper upfront (USD 180,000–280,000) but limited to sewer discharge.
How much biogas does an IC reactor produce on gelatin wastewater? An IC reactor running at 5–12 kg COD/m³·d on gelatin wastewater produces 0.35–0.45 m³ biogas per kg COD removed, with methane content 65–75% — enough to offset a meaningful fraction of plant boiler gas use.