What Is a Beverage Wastewater MBR Solution
A beverage wastewater MBR solution combines screening, equalization with DAF, and a submerged PVDF flat-sheet membrane bioreactor that reliably cuts influent COD from 1,500–10,000 mg/L and BOD from 800–6,000 mg/L to below 50 mg/L and 10 mg/L respectively — over 95% removal — producing reuse-grade effluent when paired with downstream RO at 95% recovery.
Technically, a membrane bioreactor (MBR) is a suspended-growth activated-sludge process in which the secondary clarifier is replaced by a submerged microfiltration or ultrafiltration membrane module, typically with a nominal pore size of 0.1 μm made of PVDF (polyvinylidene fluoride). The membrane retains biomass at mixed liquor suspended solids (MLSS) concentrations of 8,000–12,000 mg/L — roughly 2–3× higher than a conventional aeration tank — which raises volumetric treatment capacity and decouples hydraulic retention time (HRT, typically 4–8 hours) from sludge retention time (SRT, 20–60 days). The Berghof product literature and the Matošić pilot study on beverage production wastewater (Matošić et al., Water Science & Technology, pilot scale) both report >95% COD removal in food and beverage matrices, which is the threshold that makes downstream RO polishing viable.
Beverage plants generate a recognizable stream mix: bottle-wash water carrying label pulp and broken glass, clean-in-place (CIP) reject laden with caustic soda (pH 11–13) and nitric/phosphoric acid (pH 1–3), sugar-rich process water from brewing, soft-drink syrup rooms and dairies, and reject water from deaeration and pasteurizer cooling. These flows arrive at the treatment plant out-of-phase, with pH swinging from 3 to 12 inside a single shift. A conventional activated-sludge basin struggles to absorb those transients; an integrated MBR membrane bioreactor system handles the swings because the membrane physically retains biomass even when the mixed liquor is briefly toxic, and the SRT decoupling lets the bacterial population recover between CIP events. Plant-scale MBR retrofits commonly report a 60% footprint reduction versus a clarifier-based train of equivalent capacity (HydropureWater MBR spec, 2026).
Beverage Wastewater Characteristics and Discharge Targets
Influent BOD of 800–6,000 mg/L, COD of 1,500–10,000 mg/L, and TSS of 200–1,500 mg/L are the working envelope for brewery, soft-drink, dairy, and bottled-water plants; oil and grease routinely lands at 50–500 mg/L, pH swings 3–12 with CIP events, and temperature runs 20–45°C. A correctly designed MBR delivers COD <50 mg/L, BOD <10 mg/L, TSS <1 mg/L, and turbidity <1 NTU at the permeate side, which is the spec for an MBR flat sheet module rated to 0.1 μm. Those numbers have to clear three regulatory bars depending on jurisdiction: China GB 8978-1996 secondary standard (COD ≤150 mg/L, BOD ≤30 mg/L, SS ≤150 mg/L), EU Urban Waste Water Directive 91/271/EEC for food-and-beverage discharges, and US EPA 40 CFR Part 405 categorical limits for the food and beverage industry.
Seasonality is the operational headache. Breweries see a summer surge of 30–60% above winter base flow; soft-drink plants swing the opposite direction. Because the MBR's SRT is set by wasting rate and not by clarifier hydraulics, the biomass adapts in days rather than weeks — an MBR can absorb a 3× BOD shock for 24–48 hours and recover without losing the colony. A conventional activated-sludge basin slugs through the same event with a rising effluent BOD for a week.
| Parameter | Beverage Influent Range | MBR Effluent (Target) | Regulatory Threshold |
|---|---|---|---|
| COD (mg/L) | 1,500–10,000 | <50 | ≤150 (GB 8978-1996); per 40 CFR 405 (US EPA) |
| BOD (mg/L) | 800–6,000 | <10 | ≤30 (GB 8978-1996); per 91/271/EEC |
| TSS (mg/L) | 200–1,500 | <1 | ≤150 (GB 8978-1996) |
| Oil & Grease (mg/L) | 50–500 | <5 | ≤10 (GB 8978-1996) |
| pH | 3–12 (CIP swings) | 6.5–7.5 | 6–9 (GB 8978-1996) |
| Temperature (°C) | 20–45 | 20–35 | ≤40 preferred |
| Turbidity (NTU) | 200–1,000 | <1 | — |
Integrated Process Flow: From Bottle Wash to RO Reuse
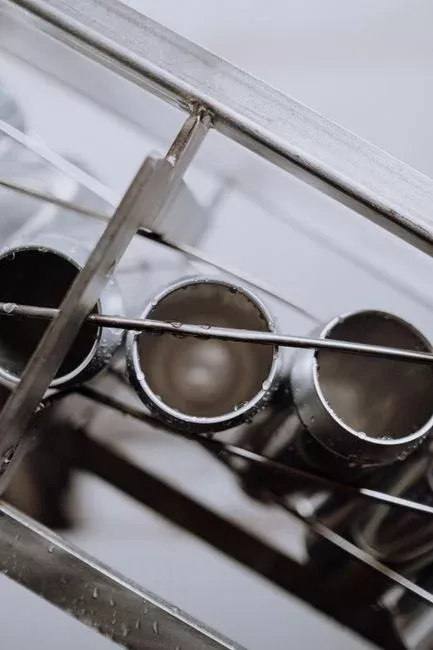
The standard beverage-plant train is a six-stage sequence: bar screening → equalization with DAF → anoxic/aerobic MBR → disinfection → optional RO polishing → sludge dewatering by plate press. Each step targets a specific failure mode of the previous one.
- Screening. A rotary bar screen with 2–5 mm openings removes labels, bottle caps, broken glass, and pulp fibers before they reach the pumps. Without it, these solids shred pump impellers and pin fibers into the membrane cassette, where they are almost impossible to backwash.
- Equalization + DAF. A 6–12 hour equalization basin absorbs the pH 3–12 CIP swings and the diurnal flow peaks. A DAF pre-treatment unit with 4–300 m³/h capacity strips 60–90% of suspended solids, oil and grease, and floatable organics upstream of the biology. This protects the MBR from grease fouling — the most common cause of transmembrane pressure creep in beverage plants.
- Anoxic + aerobic MBR. The integrated MBR membrane bioreactor system combines a denitrification zone (anoxic, HRT ~2 h) with an aerated membrane tank (HRT 4–6 h) at 10–2,000 m³/day per skid. The submerged PVDF cassette replaces the clarifier entirely; MLSS operates at 8,000–12,000 mg/L without washout.
- Disinfection. A chlorine dioxide generator at 0.5–2 mg/L residual, or ozone at 1–3 mg/L, knocks down residual coliforms. Chlorine dioxide is preferred over free chlorine because it does not form trihalomethanes with the high organic background.
- RO polishing (optional reuse loop). An industrial RO polishing unit operating at 95% recovery takes the MBR permeate (already <1 NTU) to <50 ppm TDS, suitable for boiler feed, bottle rinse, or CIP make-up. This is the step that closes the water loop and turns an effluent cost into a freshwater saving.
- Sludge dewatering. The MBR waste-activated sludge at 8,000–12,000 mg/L is thickened and pressed by a plate and frame filter press to 22–28% dry solids cake for off-site disposal or rendering, depending on jurisdiction.
The downstream RO integration is the part most top-ranking pages miss. Berghof's MBR marketing and the Matošić pilot both stop at the MBR permeate. A 2026 procurement decision has to defend the reuse case, which only the RO-polished block delivers.
Membrane Selection: PVDF Flat Sheet vs Hollow Fiber for Beverage Plants
For most beverage plants, a PVDF flat-sheet submerged MBR (DF series, 0.1 μm nominal pore) is the default. Each module carries 80–225 m² of membrane area and produces 32–135 m³/day of permeate; elements are individually replaceable, the stainless frame tolerates CIP chemicals across the full pH 3–12 range, and the flat geometry resists fouling from fibrous solids because the flow path is short and the air-scour pattern is uniform. Flat-sheet submerged MBRs also consume 10–20× less energy than external cross-flow tubular systems because there is no recirculation pump loop — the permeate is pulled by a gentle vacuum of 0.1–0.3 bar (HydropureWater DF series spec).
Hollow-fiber MBRs deliver higher packing density (up to 30,000 m² in a single cassette) and a lower headline CAPEX, but the fibers are vulnerable to breakage from the fibrous debris that survives screening — label pulp, fruit pulp, grain husks — and once a fiber breaks, the whole cassette integrity is compromised. Hollow fiber is acceptable for low-TSS streams such as bottled-water rinses, but a brewery with seasonal lautering runoff, a soft-drink plant with fruit-pulp processing, or a dairy with whey carryover is a flat-sheet application.
| Criterion | PVDF Flat Sheet (DF series) | Hollow Fiber |
|---|---|---|
| Pore size (μm) | 0.1 | 0.1–0.4 |
| Module area | 80–225 m² | Up to 30,000 m² per cassette |
| Per-module permeate | 32–135 m³/day | Higher per cassette |
| Energy use | 0.3–0.6 kWh/m³ (submerged) | 0.4–0.8 kWh/m³ |
| Element replaceability | Individual sheets, plug-in | Whole cassette if fiber breaks |
| CIP tolerance (pH 1–13) | High (PVDF + SS frame) | Moderate (potting glue sensitivity) |
| Fouling with fibrous solids | Low (short flow path, air scour) | High (fiber snagging, breakage) |
| Best-fit beverage stream | Brewery, soft-drink, dairy, mixed CIP | Bottled water, low-TSS rinses |
2026 Cost Framework: CAPEX, Membrane Replacement, and OPEX
For a 500 m³/day turnkey beverage MBR train (screening + DAF + MBR + disinfection, no RO), CAPEX lands at roughly $250,000–$450,000 in 2026 terms; larger 1,000–2,000 m³/day systems scale at about $400–$700 per m³/day of installed capacity, inclusive of tanks, blowers, control panels, and commissioning. Membrane replacement runs $8–$14 per m² of installed membrane area, with a 5–8 year life depending on CIP discipline and feed TSS (HydropureWater field data, 2026).
OPEX is dominated by aeration. For a submerged MBR, aeration energy is 50–60% of the OPEX line, sludge handling 15–25%, chemical cleaning 5–10%, and labor 10–15% — the same energy-share logic that holds for sequencing batch reactors (HydropureWater SBR cost analysis, 2026). Aeration runs at 0.3–0.6 kWh/m³ of permeate for the membrane scour alone, on top of the biological oxygen demand. Closing the loop with RO at 95% recovery cuts freshwater purchase by 40–60% in water-scarce brewery locations, which typically pays back the combined MBR + RO CAPEX in 3–5 years.
The wider market context supports the 2026 procurement case: the global membrane technology market reached $26.7B in 2026 at a 9.7% CAGR (per the 2026 membrane technology market analysis), and the falling unit cost is reflected in PVDF module pricing. For a side-by-side look at MBR against the conventional clarifier route, the MBR vs secondary clarifier comparison gives the cost delta and the MBR engineering and compliance guide covers the compliance checklist for cross-border procurement.
| Cost Item | 2026 Benchmark | Notes |
|---|---|---|
| Turnkey MBR CAPEX, 500 m³/day | $250,000–$450,000 | Screening + DAF + MBR + disinfection |
| Scaled CAPEX, 1,000–2,000 m³/day | $400–$700 per m³/day | Tanks, blowers, controls, commissioning |
| Membrane replacement | $8–$14 per m² | Every 5–8 years |
| Aeration share of OPEX | 50–60% | 0.3–0.6 kWh/m³ membrane scour |
| Sludge handling share | 15–25% | Plate press to 22–28% DS cake |
| Chemical cleaning share | 5–10% | CIP chemicals, antifoam |
| Labor share | 10–15% | Daily checks, CIP cycles |
| RO + MBR payback (water-scarce site) | 3–5 years | 40–60% freshwater offset |
Frequently Asked Questions
What influent COD and BOD can a beverage wastewater MBR handle? An MBR sized for beverage plants accepts COD of 1,500–10,000 mg/L and BOD of 800–6,000 mg/L, with TSS up to 1,500 mg/L and pH swings from 3 to 12, while delivering >95% COD removal to a permeate of COD <50 mg/L and BOD <10 mg/L.
Which membrane format is best for a brewery with high TSS? PVDF flat-sheet modules in the DF series are the default for breweries, soft-drink plants, and dairies because they tolerate pH 1–13 CIP chemicals, allow individual sheet replacement, and resist fouling from fibrous debris better than hollow-fiber cassettes.
What discharge standards does the MBR permeate meet? MBR effluent clears the China GB 8978-1996 secondary standard (COD ≤150 mg/L, BOD ≤30 mg/L, SS ≤150 mg/L) and the US EPA 40 CFR Part 405 food-and-beverage categorical limits; for direct reuse, the permeate is further polished by an industrial RO unit to <50 ppm TDS.
What is the realistic 2026 CAPEX for a 500 m³/day beverage MBR? A turnkey 500 m³/day MBR train costs $250,000–$450,000, with larger 1,000–2,000 m³/day systems at $400–$700 per m³/day of capacity, excluding the optional RO polishing loop.
How quickly does a beverage MBR pay back when paired with RO reuse? At a water-scarce brewery site, the MBR + RO combination typically pays back the combined CAPEX in 3–5 years by offsetting 40–60% of freshwater purchase.