Secondary Clarifier Alternatives for Industrial Solids Separation
Secondary clarifier alternatives matter when municipal-style gravity tanks cannot hold industrial peaks. Secondary clarifiers typically remove 85–95% TSS at 0.5–1.5 m/h surface overflow rate in stable activated-sludge service. DAF, lamella clarifiers, and MBR raise capture on FOG, colloids, and variable flows. Choose by settleability, peak hydraulic loading, footprint, and lifecycle cost—not tank diameter alone.
Gravity secondary clarifiers remain the default for stable municipal mixed liquor with SVI near 100 mL/g. Industrial washdowns, surfactants, and reuse targets usually force a side-by-side look at high-rate settlers or membranes before new concrete is poured.
Why Secondary Clarifiers Lose Solids Under Peak Load
TSS carryover in secondary clarifiers frequently exceeds 30 mg/L during peak hydraulic events, putting plants above common secondary effluent targets near 15 mg/L TSS used in North American design practice. According to Ontario’s Design Guidelines for Sewage Works, secondary processes are sized to meet about 15 mg/L CBOD5 and 15 mg/L TSS under design conditions. When the hydraulic loading rate exceeds floc settling velocity, biomass washes over the weir and downstream filters foul faster.
Foaming and ashing are the failure modes we see most often on industrial trains. Ashing—pin-point flocs rising to the surface—usually tracks high sludge age or filamentous growth such as Nocardia on carbohydrate- or fat-rich feeds. Floating solids disrupt disinfection and accelerate membrane fouling in downstream tertiary treatments. Surfactant or lipid spikes also change surface tension so standard scum baffles stop capturing floating solids.
A food-processing plant case in the source material shows the pattern. Influent TSS ran about 1,200 mg/L into a clarifier sized for SVI near 100 mL/g. During shift changes and washdowns, SVI rose to about 220 mL/g. Effluent TSS jumped from 25 mg/L to 180 mg/L inside roughly two hours. Hydraulic retention time could not hold the bulking sludge—an outcome common in dairy, pharmaceutical, and pulp applications where fine colloids settle poorly by gravity alone.
According to the US EPA Peak Stress Testing Protocol Framework (2015), secondary clarifier performance depends on surface overflow rate, mixed-liquor suspended solids, return-sludge ratio, and settling characteristics together—not on tank area alone. Most plants we size for industrial peaks run overflow rates at the lower end of municipal ranges and still keep a high-rate backup path for FOG or storm spikes.
Technical Specifications: Secondary Clarifier vs Alternatives

Industrial solids-separation technologies differ by nearly two orders of magnitude in hydraulic loading rate and footprint. A secondary clarifier needs quiet gravity settling. A Dissolved Air Flotation (DAF) System attaches micro-bubbles so light, fatty, or fibrous solids rise. Lamella clarifiers add inclined plates to raise effective settling area without enlarging the tank shell.
TSS and FOG removal run higher on DAF and MBR trains than on gravity secondary clarifiers under comparable industrial loads. Secondary clarifiers typically reach 85–90% TSS removal on municipal mixed liquor. MBR barriers routinely push past 99% TSS when membranes stay intact. On high-FOG slaughterhouse or dairy feeds, a secondary clarifier may remove only 60–70% of grease, while a conditioned DAF train often exceeds 95% FOG removal (HydropureWater field data, 2025).
| Parameter | Secondary Clarifier | Lamella Clarifier | DAF System | MBR System |
|---|---|---|---|---|
| TSS Removal Efficiency | 85-95% | 90-97% | 95-98% | 99.9% |
| Hydraulic Loading Rate (m/h) | 0.5 - 1.5 | 20 - 40 | 4 - 10 | 0.5 - 1.0 (Flux) |
| Footprint (m² per 1,000 m³/d) | 100 - 200 | 20 - 40 | 30 - 60 | 50 - 80 |
| Energy Use (kWh/m³) | 0.05 - 0.1 | 0.02 - 0.05 | 0.1 - 0.3 | 0.4 - 0.8 |
| Sludge Concentration | 1 - 2% solids | 2 - 4% solids | 3 - 5% solids | 1 - 1.5% (High viscosity) |
Energy is the main trade-off for higher capture. Secondary clarifiers and HydropureWater lamella clarifiers for compact solids separation draw power mainly for slow scrapers. DAF needs saturation and recycle pumping. MBR needs scour air and permeate pumping. DAF float at 3–5% solids often cuts hauling volume enough to offset that extra kilowatt-hour cost on FOG-heavy sites.
How Do You Select a Clarifier System?
Clarifier selection for industrial wastewater starts with sludge settleability, peak-to-average flow ratio, and the specific gravity of the solids you must capture. Use the five steps below to match hardware to the waste stream before you freeze civil layouts.
Step 1: Characterize influent and sludge morphology. Measure SVI and identify whether solids are denser or lighter than water. FOG in dairy or fibers in textiles settle poorly in a secondary clarifier. In those cases, learn how DAF compares to induced air flotation (IAF) for industrial applications before you enlarge a gravity tank.
Step 2: Define regulatory limits and discharge goals. Compare local limits—China GB 8978-1996 Class A or EU urban-wastewater rules—with each technology’s removal band. For reuse or ultra-low phosphorus, the Integrated MBR system for near-reuse-quality effluent is often the only unit that holds a physical barrier on TSS.
Step 3: Assess space constraints. Calculate usable footprint on the brownfield pad. A lamella clarifier can raise capacity about 3–4× inside an existing clarifier footprint when plates are applied correctly. Where aeration tanks already exist, converting to MBR raises MLSS and can retire the secondary clarifier entirely.
Step 4: Evaluate operational complexity. Secondary clarifiers and lamella tanks need little day-to-day chemistry control. DAF needs stable coagulant dose and air-to-solids ratio. MBR needs automated CIP and sensor coverage. Refer to our guide on PAC dosing systems vs alternatives when chemical conditioning drives DAF or tertiary polishing performance.
Step 5: Model lifecycle cost. Include land, concrete, chemicals, membrane replacement, and sludge haul—not only equipment quotes. A secondary clarifier may win on CAPEX yet lose on land and dilute sludge. DAF often returns capital faster in pretreatment by protecting biology and concentrating float.
What design criteria matter for DAF vs clarifiers?
Design criteria for industrial clarifier and DAF trains center on peak surface overflow rate or hydraulic loading, solids loading rate, SVI, FOG fraction, and required effluent TSS. Ontario peak-hour SOR guidance for conventional activated-sludge final tanks reaches about 50 m³/(m²·d) (≈2.1 m/h) with peak solids loading near 240 kg/(m²·d); many industrial gravity designs still target 0.5–1.5 m/h average to protect effluent quality. DAF packages are typically rated near 4–10 m/h with chemical conditioning. If solids are buoyant or FOG exceeds a few hundred mg/L, buoyancy separation usually beats deeper gravity tanks.
Cost Comparison: Secondary Clarifier vs Alternatives (2025 Data)
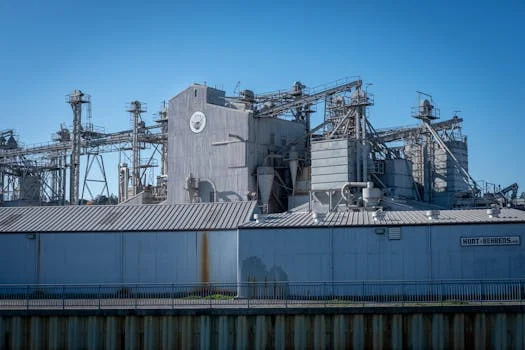
CAPEX for secondary clarifiers ranges from $500 to $1,200 per m³/day of capacity when large concrete tanks dominate the bill. Skid-mounted DAF and modular lamella units cut field concrete and shorten install windows. 2025 inflation-adjusted benchmarks show the CAPEX gap narrowing as land and concrete prices rise relative to packaged steel systems.
| Technology | CAPEX ($/m³/day) | Annual OPEX ($/m³/day) | Est. ROI Period | Major Maintenance Item |
|---|---|---|---|---|
| Secondary Clarifier | $500 - $1,200 | $10 - $25 | 5 - 7 Years | Scraper Drive/Concrete Repair |
| Lamella Clarifier | $600 - $1,000 | $8 - $20 | 4 - 6 Years | Plate Cleaning/Replacement |
| DAF System | $800 - $1,500 | $30 - $65 | 3 - 5 Years* | Saturation Pump/Compressor |
| MBR System | $1,200 - $2,500 | $80 - $150 | 7 - 10 Years | Membrane Replacement (5-8 yrs) |
*ROI for DAF is often faster in high-FOG industries due to product recovery or massive reductions in sludge disposal fees.
Hidden costs change the ranking. Secondary clarifiers discharge dilute sludge at about 1% solids, so thickening capacity grows before dewatering and raises the total wastewater treatment plant cost and sludge management budget. DAF float at 3–5% solids can save roughly $20,000–$50,000 per year in haul fees on a 1,000 m³/day industrial train. MBR membrane replacement every 5–8 years is expensive, yet it can remove separate tertiary filtration and some disinfection CAPEX from a clarifier-based flow sheet.
Compliance Pressure on Solids Separation Choices
Industrial discharge compliance often fails first on particles smaller than about 10 microns, where secondary clarifiers lose efficiency. Nitrogen and phosphorus limits continue to tighten. Earlier guidance followed Directive 91/271/EEC. Directive (EU) 2024/3019 now recasts those rules and requires stronger tertiary nutrient removal for plants at or above 150,000 population equivalents on phased deadlines through the 2030s. Decoupling solids retention time from hydraulic retention time—via MBR or tightly controlled high-rate solids capture—supports those nutrient trains. Explore how pressure flotation systems stack up against lamella clarifiers when nutrient-rich sidestreams need reliable solids capture before polishing.
Pathogen and emerging-contaminant goals also push plants beyond gravity settling alone. Secondary clarifiers typically provide only 1–2 log pathogen reduction under normal municipal operation. Membrane barriers add a physical cut-off that supports higher log reduction when integrity tests pass, which matters for reuse or sensitive receiving waters. Microplastics and PFAS programs still need dedicated polishing; solids-separation choice mainly decides how much particulate-bound load reaches those stages.
Who This Is For and Next Step
Plant engineers, EPC designers, and procurement leads use this framework when sizing secondary clarification or deciding when to replace it. Look elsewhere if you only need primary grit and screening, or if a municipal plant already meets permit with stable SVI below about 120 mL/g and spare clarifier area. Selection checklist: peak TSS and FOG; SVI under washdown; peak-to-average flow; footprint in m²; effluent TSS and TP limits; sludge haul cost per wet tonne; and operator skill for chemistry or membranes.
If industrial TSS fails during peaks, or FOG overwhelms gravity settling, share flow and lab data via our request-quote form. We will size clarifier, lamella, DAF, or MBR options to the same duty point.
Frequently Asked Questions
When should a plant replace a secondary clarifier with DAF?
Replace or bypass a secondary clarifier with DAF when FOG or low-density solids keep effluent TSS above permit during normal peaks, typically when grease removal stays near 60–70% on gravity tanks. DAF with chemical conditioning often exceeds 95% FOG removal at 4–10 m/h loading. Most food and dairy sites we review move to DAF once washdown spikes push SVI above about 200 mL/g and scum baffles stop holding float.
How does a lamella clarifier compare on footprint?
A lamella clarifier typically needs about 20–40 m² per 1,000 m³/d versus 100–200 m² for a conventional secondary clarifier at similar duty. Inclined plates raise effective settling area so brownfield plants can add 3–4× capacity inside existing tank shells when structural checks pass. Energy stays low at roughly 0.02–0.05 kWh/m³ because only scrapers and feed pumps run continuously.
Is MBR worth the higher OPEX versus clarification?
MBR is worth the higher OPEX when reuse, ultra-low TSS near 99.9% removal, or nutrient decoupling justifies 0.4–0.8 kWh/m³ plus membrane replacement every 5–8 years. CAPEX often lands near $1,200–$2,500 per m³/day versus $500–$1,200 for secondary clarifiers. Plants that already pay for tertiary filters and tight disinfection sometimes recover part of that gap by retiring those unit processes.
What CAPEX range should procurement budget in 2025 dollars?
Procurement should budget about $500–$1,200 per m³/day for secondary clarifiers, $600–$1,000 for lamella packages, $800–$1,500 for DAF, and $1,200–$2,500 for MBR in 2025-dollar industrial benchmarks cited above. Civil work dominates clarifier cost; skid systems shift spend to equipment and installation. Always add sludge thickening and haul cost before ranking ROI periods of 3–10 years.
Which design criteria fail first on industrial secondary clarifiers?
Peak hydraulic loading and rising SVI fail first on industrial secondary clarifiers, not average-day overflow rate. When HLR exceeds floc settling velocity, effluent TSS can climb from the mid-20s mg/L into the 100+ mg/L range within hours. Measure peak-hour flow, MLSS, SVI, and FOG together before enlarging tank diameter—high-rate options often cost less than another large concrete clarifier.