Why Industrial Plants Struggle with Suspended Solids and FOG: The DAF Solution
Industrial facilities in the food processing and pulp and paper sectors frequently face discharge fines exceeding $50,000 annually due to non-compliance with fats, oils, and grease (FOG) limits. For example, a meat processing plant in Shandong recently reported TSS levels at 800 mg/L—three times the allowable limit under GB 8978-1996—resulting in daily surcharges that eroded profit margins. These plants struggle because traditional gravity separation is ineffective for low-density contaminants. Fats and fine fibers have specific gravities near or below that of water, meaning they remain suspended or take hours to settle, requiring massive footprints that most urban industrial sites cannot accommodate.
While sedimentation is a legacy standard, it typically requires four times the surface area of a modern flotation system and struggles to reach the 90%+ removal efficiencies required for modern environmental permits. Chemical-only treatments often lead to excessive sludge volume and high OPEX without solving the core separation issue. Dissolved Air Flotation (DAF) has emerged as the gold standard for these applications, achieving 92–97% TSS removal and 85–95% FOG removal by reversing the logic of sedimentation: instead of waiting for particles to sink, DAF uses microbubbles to make them float.
A dissolved air flotation (DAF) system removes 95%+ of suspended solids (TSS), fats/oils/greases (FOG), and metals from industrial wastewater by dissolving air under 40–70 psi, then releasing it at atmospheric pressure to form 20–100 μm microbubbles. These bubbles attach to contaminants, reducing their density and causing them to float to the surface for skimming. DAF systems outperform sedimentation in space efficiency (50% smaller footprint) and sludge dewatering (3–5% higher solids concentration). Key parameters include air-to-solids ratio (0.02–0.06), retention time (20–60 minutes), and tank depth (1.5–3.0 meters). Understanding how DAF turns 60 psi of pressure into a precision-engineered blanket of 100 μm bubbles is essential for any engineer looking to optimize wastewater pretreatment.
The DAF Process Step-by-Step: From Pressurized Air to Skimmed Sludge
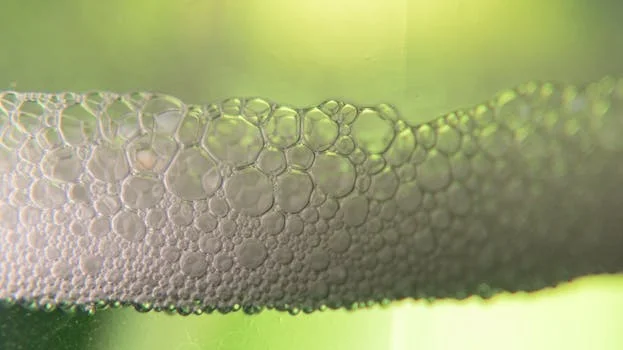
The DAF engineering process relies on Henry’s Law of gas solubility, where air is dissolved into a recycle stream under 40–70 psi before being released to create microbubbles. The process operates much like opening a pressurized soda bottle: when the pressure is suddenly removed, the dissolved gas precipitates out of the liquid as millions of tiny bubbles. In an industrial DAF, this process is controlled across four distinct stages to ensure maximum contaminant capture.
Step 1: Air Dissolution and Saturation
A portion of the clarified effluent (typically 10–30% of the total influent flow) is diverted into a recycle stream. This water is pumped into a saturation tank where air is introduced. Under pressures of 40–70 psi, air solubility increases by approximately 300% compared to atmospheric conditions (per Henry's Law). This "whitewater" becomes the engine of the flotation process.
Step 2: Microbubble Formation
The pressurized recycle stream is reintroduced to the main flotation tank through a series of pressure-reduction valves. As the pressure drops to atmospheric levels, the water becomes supersaturated, and the air is released as a cloud of microbubbles. These bubbles range from 20 to 100 μm in diameter. Smaller bubbles are critical because they provide a significantly higher surface-area-to-volume ratio, increasing the probability of collision with suspended particles.
Step 3: Particle-Bubble Attachment
Within the contact zone, the microbubbles collide with particles that have been pre-conditioned with coagulants and flocculants. Attachment occurs through three primary mechanisms: interception, diffusion, and inertial impaction. Engineers must monitor the zeta potential of the particles to ensure that the electrical charge is sufficiently neutralized, allowing the hydrophobic air bubbles to adhere firmly to the floc. The air-to-solids (A/S) ratio, maintained between 0.02 and 0.06, is the critical metric here; too little air results in heavy floc that sinks, while too much air creates turbulence that breaks the floc apart.
Step 4: Flotation and Skimming
The bubble-particle aggregates rise to the surface according to Stokes’ Law. Because the combined density is significantly lower than water, the rise rate is much faster than the settling rate in a clarifier. A "float" layer forms at the surface, typically achieving a 3–5% solids concentration. A mechanical skimmer (chain-and-flight or spiral) removes this sludge, while the clarified water is discharged from the bottom of the tank. To implement this high-efficiency separation, engineers often explore ZSQ series DAF systems for industrial wastewater which integrate these steps into a single, automated skid.
| Process Stage | Key Parameter | Engineering Value/Range | Impact on Efficiency |
|---|---|---|---|
| Recycle Stream | Recycle Ratio | 10% – 30% | Determines bubble density and volume |
| Saturation | Operating Pressure | 40 – 70 psi (2.8 – 4.8 bar) | Directly affects air solubility (Henry’s Law) |
| Contact Zone | Bubble Size | 20 – 100 μm | Smaller bubbles increase attachment surface area |
| Separation Zone | Air-to-Solids (A/S) | 0.02 – 0.06 (lb air / lb solids) | Ensures sufficient buoyancy for the floc layer |
DAF Efficiency Benchmarks: Removal Rates by Contaminant and Industry
Dissolved air flotation achieves a 92–97% TSS removal rate and an 85–95% FOG removal rate across high-load industrial applications. These benchmarks are significantly higher than traditional gravity separation, particularly when dealing with emulsified oils or light organic matter. For instance, a textile plant in Zhejiang recently demonstrated the technology’s capability by reducing influent TSS from 1,200 mg/L to just 40 mg/L, while simultaneously stripping 70% of the COD associated with particulate dyes.
The efficiency of a DAF system is highly dependent on the influent characteristics of the specific industry. In food processing, where FOG concentrations often exceed 1,000 mg/L, DAF is used to prevent the "blinding" of downstream biological treatments. In the pulp and paper industry, DAF recovers valuable fibers while achieving 96% TSS removal, significantly reducing the load on secondary clarifiers. The following table provides 2025 industry-specific performance benchmarks based on Zhongsheng field data.
| Industry Sector | Primary Contaminant | Typical Influent (mg/L) | DAF Removal Efficiency |
|---|---|---|---|
| Food Processing (Meat/Dairy) | FOG & TSS | 1,000 – 3,000 (TSS) | 95% – 98% |
| Pulp & Paper | Fine Fibers | 500 – 2,000 (TSS) | 94% – 97% |
| Textile & Dyeing | Particulate Color/COD | 800 – 1,500 (TSS) | 90% – 95% |
| Oil & Gas (Refineries) | Free & Emulsified Oil | 100 – 500 (Oil) | 85% – 95% |
| Metalworking/Plating | Precipitated Metals | 50 – 200 (Metals) | 70% – 90% (w/ pH adjustment) |
When comparing DAF to alternatives like sedimentation or Membrane Bioreactors (MBR), the decision often hinges on the desired effluent quality versus the operational budget. While MBR provides superior effluent quality (suitable for direct reuse), DAF offers a much lower CAPEX and handles high-FOG streams that would immediately foul an MBR. Compared to sedimentation, DAF provides a drier sludge (3–5% solids vs. 1% in sedimentation), which directly reduces the cost of downstream dewatering and disposal.
DAF System Design: Key Parameters and How to Optimize Them
Optimizing a DAF system requires balancing the hydraulic loading rate, typically maintained between 3 and 8 m/h, with the air-to-solids (A/S) ratio. System sizing is not merely about flow rate; it is about providing sufficient residence time (20–60 minutes) for the bubbles to attach and rise to the surface without being disrupted by hydraulic turbulence. A tank that is too shallow (less than 1.5m) may lead to "carryover," where particles are swept out with the effluent before they can reach the float layer.
Chemical conditioning is the most common area for operational optimization. Without proper coagulation and flocculation, microbubbles will simply bypass the contaminants. Standard protocols involve using Inorganic coagulants like Polyaluminum Chloride (PAC) at dosages of 50–200 mg/L to neutralize particle charges, followed by an anionic or cationic polyacrylamide (PAM) flocculant at 1–5 mg/L to bind the particles into larger, "buoyancy-ready" flocs. To maintain these precise ratios, many plants optimize DAF performance with automatic chemical dosing, which adjusts chemical delivery based on real-time flow and turbidity sensors.
| Design Parameter | Standard Range | Optimization Strategy |
|---|---|---|
| Hydraulic Loading Rate | 3 – 8 m³/m²/h | Lower the rate for high-TSS influent to prevent carryover. |
| Retention Time | 20 – 60 minutes | Ensure at least 30 mins for complex FOG emulsions. |
| Tank Depth | 1.5 – 3.0 meters | Deeper tanks improve separation in high-flow systems. |
| Coagulant Dose (PAC) | 50 – 200 mg/L | Jar testing is required to find the "isoelectric point." |
DAF vs. Sedimentation vs. MBR: Which System is Right for Your Wastewater?
DAF systems require approximately 50% less physical footprint than conventional sedimentation tanks while producing a sludge with 3–5% higher solids concentration. This makes DAF the logical choice for industrial sites where land is at a premium or where sludge disposal costs are high. However, the choice between DAF and high-end technologies like MBR depends entirely on the discharge requirements. If the goal is to meet municipal sewer limits (pretreatment), DAF is the most cost-effective solution. If the goal is internal water reuse, MBR is often necessary as a secondary or tertiary step following DAF.
The following decision matrix highlights the trade-offs in CAPEX, OPEX, and performance for 2025 evaluations. For a deeper look at the financial differences between flotation and gravity-based thickening, you can compare DAF vs. gravity thickener costs in 2025. In high-strength organic applications, DAF is often paired with MBR to protect the membranes from FOG fouling; you can learn more about MBR integrated wastewater treatment to see how these technologies complement one another.
| Criteria | DAF System | Sedimentation | MBR System |
|---|---|---|---|
| TSS Removal | 92% – 97% | 70% – 85% | 99%+ |
| FOG Handling | Excellent | Poor (FOG floats) | Poor (Membrane fouling) |
| Footprint | Small | Very Large | Medium |
| CAPEX | Moderate | Low | High |
| Sludge Solids % | 3% – 5% | 0.5% – 1.5% | 0.8% – 1.2% |
2025 DAF System Costs: CAPEX, OPEX, and ROI Breakdown for Industrial Plants
The 2025 CAPEX for a medium-scale DAF system ranges from $1,500 to $3,000 per m³/h of treatment capacity. For a standard 50 m³/h unit, a procurement team should budget between $80,000 and $120,000 for the equipment skid, depending on the material of construction (304 vs 316 stainless steel) and the level of PLC automation. Larger systems, such as a 200 m³/h DAF, benefit from economies of scale but can range from $250,000 to $400,000 when including balance-of-plant requirements like chemical storage and sludge holding tanks.
Operating expenses (OPEX) are driven primarily by chemical consumption and energy for the recycle pump. Energy costs typically range from $5 to $15 per 1,000 m³ treated, while chemical costs can range from $2 to $8 per 1,000 m³ depending on the influent load. However, the ROI is often realized in under 3 years through the reduction of municipal surcharges and lower sludge disposal costs. For example, a meat processing plant treating 100 m³/h could save $80,000 annually by reducing TSS/FOG surcharges, leading to a 2.2-year payback period. To further improve ROI, plants often reduce DAF sludge disposal costs with plate and frame filter presses, which can increase sludge solids from 4% to 25%, cutting haulage volumes by over 80%.
| Capacity (m³/h) | Estimated CAPEX (2025) | Annual OPEX (Est.) | Typical Payback (Years) |
|---|---|---|---|
| 10 m³/h | $35,000 – $55,000 | $5,000 – $8,000 | 3.5 – 4.5 |
| 50 m³/h | $80,000 – $120,000 | $20,000 – $35,000 | 2.5 – 3.5 |
| 100 m³/h | $150,000 – $220,000 | $40,000 – $65,000 | 2.0 – 3.0 |
| 250 m³/h | $300,000 – $450,000 | $90,000 – $140,000 | 1.8 – 2.5 |
Common DAF Problems and How to Fix Them: A Troubleshooting Guide
Poor flotation performance in DAF units is most commonly caused by a drop in saturation pressure below 40 psi or an insufficient air-to-solids ratio. If the contaminants are not rising or the "whitewater" appears milky-gray rather than bright white, the first check should be the saturation tank pressure and the recycle pump's mechanical seal. Air leaks in the suction line can prevent the pump from achieving the necessary 60 psi, resulting in larger, less effective bubbles.
Another frequent issue is "pin floc," where the particles are too small to be effectively captured by the bubbles. This is usually a sign of over-dosing flocculant or improper pH levels that prevent the coagulant from working. Operators should perform weekly jar tests to verify chemical dosages. For excessive sludge volume, the fix is often installing a pre-sedimentation tank or a grit chamber to remove heavy solids before they reach the DAF, allowing the flotation unit to focus purely on the light, buoyant contaminants. To ensure long-term reliability, a preventive maintenance schedule should include weekly checks of the air saturation pressure, monthly cleaning of the skimmer blades, and quarterly inspections of the recycle pump impellers.
Frequently Asked Questions
Q: How small are the bubbles in a DAF system?
A: DAF systems produce 20–100 μm microbubbles, roughly the size of a human hair. This size is critical because smaller bubbles provide more surface area for particle attachment, improving removal efficiency by 10–15% compared to the larger bubbles found in Induced Air Flotation (IAF) systems.
Q: What’s the difference between DAF and IAF (Induced Air Flotation)?
A: DAF uses pressurized air dissolution (40–70 psi) to create microscopic bubbles (20–100 μm). IAF uses mechanical agitation or venturi injectors to generate larger bubbles (500–1,000 μm). While IAF is cheaper to operate, DAF achieves much higher removal efficiency (95%+ TSS vs. 80% for IAF) and is preferred for fine industrial solids.
Q: Can DAF remove heavy metals from wastewater?
A: Yes, provided the metals are first precipitated as hydroxides or sulfides. By adjusting the pH to the point of minimum solubility (usually 8.5–9.5) and adding a coagulant, DAF can remove 70–90% of metals like chromium, copper, and nickel. For 99%+ removal, DAF is typically followed by a polishing filter.
Q: How much does a DAF system cost per m³/h?
A: In 2025, CAPEX ranges from $1,500 to $3,000 per m³/h. A 100 m³/h system typically costs between $150,000 and $300,000, depending on the material of construction and the inclusion of automated chemical dosing skids.
Q: What’s the typical payback period for a DAF system?
A: For high-FOG industries like food processing or pulp and paper, the payback period is usually 2–4 years. This is driven by the elimination of municipal non-compliance fines and the significant reduction in sludge disposal costs due to the higher solids concentration in DAF float sludge.