Why Gravity vs DAF Thickener Cost Matters for Plant Budgets
Gravity vs DAF thickener cost usually splits on CAPEX, footprint, and tip fees. Gravity units typically cost $50,000–$300,000 with OPEX near $0.02–$0.06/m³. DAF units often cost $80,000–$350,000 and run at $0.10–$0.25/m³, but reach higher solids in less area. Payback for the DAF premium is commonly 1–2 years above about $150/ton disposal.
Plant managers size thickeners under three hard constraints: CAPEX ceiling, available footprint, and sludge disposal price. A food plant facing a 40% rise in secondary sludge volume may hold a $1.2 million budget for thickening and dewatering upgrades. A gravity unit can look cheaper on paper, yet a 200 m² tank often will not fit a retrofit bay.
A DAF thickener at about $250,000 CAPEX and $0.20/m³ OPEX can still cut annual disposal by roughly $300,000 when solids rise enough to shrink haul volume. That trade-off is the core of the gravity vs DAF thickener cost decision on crowded industrial sites. Space, tip fees, and solids targets usually decide the winner before equipment brand does.
Thickening performance also sets downstream chemical and energy demand. A 1% drop in thickened solids can raise dewatering polymer use by 10–15% and dewatering energy by 8–12% under typical belt-press loading. According to the US EPA gravity-thickening fact sheet, conventional gravity units more often finish at 4–6% total solids (TS).
EPA notes that bottoms can reach as high as 15% TS under favorable primary sludge. Workforce training materials place DAF thickened WAS commonly in the 4–8% TS band. The budget question is therefore simple: does the DAF CAPEX premium buy enough solids and space to beat gravity on life-cycle cost?
Gravity Thickener Costs: CAPEX, OPEX, and Hidden Expenses
Gravity thickeners concentrate sludge by sedimentation. They suit plants with spare land, settleable primary sludge, and a tight CAPEX limit. Most plants we size for municipal primary sludge run toward the lower solids end of the published ranges when WAS share rises.
CAPEX scales with flow and materials. At 10 m³/h, prefabricated stainless-steel units typically cost $50,000–$80,000. At 50 m³/h, site-built concrete tanks commonly land at $120,000–$180,000. At 200 m³/h, large concrete tanks often reach $200,000–$300,000.
Concrete is generally 30–40% cheaper than stainless steel but needs longer civil schedules. Installation—foundation, piping, and power—usually adds $20,000–$50,000. Those civil adders erase paper savings on many brownfield pads.
OPEX stays low. Scraper power and light chemical use typically total $0.02–$0.05 per cubic meter of sludge processed. The hidden cost is disposal volume. Gravity units commonly thicken to 4–6% solids, while DAF often reaches 5–8%.
Extra water in the cake raises haul and tip fees every month. Annual scraper blade replacement can run $5,000–$15,000, and tank cleaning another $3,000–$8,000. Footprint grows nearly linearly with capacity, which blocks many urban retrofits.
US EPA performance tables for conventional gravity thickening list primary sludge underflows often at 5–10% TS from 2–7% feed. Mixed primary plus WAS commonly lands around 4–7% TS.
That spread explains why a gravity-only design that looked fine on primary sludge fails after a plant adds more biological solids. Deep tanks with 3–4 m side water depth also need excavations, odor covers, and supernatant return lines. On brownfield sites, relocating buried utilities can wipe out the apparent CAPEX edge of concrete versus a stainless DAF skid.
| System Size (m³/h) | Estimated CAPEX Range ($) | Estimated OPEX Range ($/m³) | Typical Solids Concentration (%) | Typical Footprint (m²) |
|---|---|---|---|---|
| 10 | 50,000–80,000 (Stainless Steel, Pre-fab) | 0.02–0.04 | 4–6 | 20–40 |
| 50 | 120,000–180,000 (Concrete, Site-built) | 0.03–0.05 | 4–6 | 100–150 |
| 200 | 200,000–300,000 (Large Concrete Tanks) | 0.04–0.06 | 4–6 | 300–500 |
DAF Thickener Costs: CAPEX, OPEX, and Operational Trade-Offs
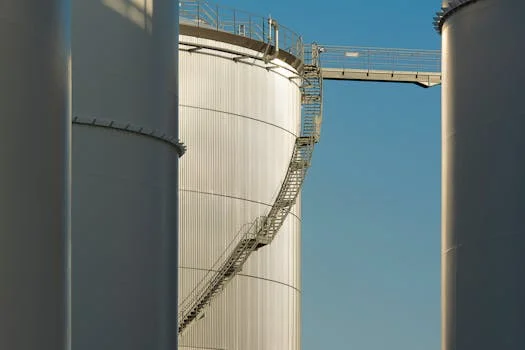
DAF thickeners attach micro-bubbles to sludge flocs so solids float for skimming. They deliver higher solids and a smaller footprint than gravity tanks, especially on light WAS. Those gains raise both CAPEX and OPEX through compressors and polymer.
At 10 m³/h, skid-mounted stainless DAF packages typically cost $80,000–$120,000. At 50 m³/h, custom units with saturation systems often cost $150,000–$220,000. At 200 m³/h with integrated controls, CAPEX commonly reaches $250,000–$350,000.
Installation usually adds $30,000–$70,000 for compressors, recycle piping, and polymer skids. A packaged Dissolved Air Flotation (DAF) System can shorten field erect time on mid-size industrial jobs. Material choice still matters: stainless steel dominates food and chemical duty for corrosion resistance.
OPEX for DAF thickeners ranges from $0.10 to $0.25 per cubic meter of sludge. Compressor energy is typically 0.2–0.5 kWh/m³—about 2–3 times gravity scraper demand under similar feed rates. Polymer for 95%+ TSS capture often adds $0.03–$0.08/m³.
Industry references cite air-to-solids ratios near 0.02–0.06 kg air/kg dry solids for thickening service. Polymer often sits at 2–5 g/kg dry solids when operators raise solids loading. Higher float solids of 5–8% can cut downstream dewatering and disposal costs by 15–25%.
Annual membrane or saturation-system service may run $10,000–$25,000, with pumps and compressors another $5,000–$12,000. Modular skids allow staged capacity adds when production grows. That flexibility is hard to match with a single large concrete gravity tank.
WAS that needs only 20–30 kg dry solids per m²·d in a gravity thickener can often be loaded near five times that rate in DAF service. Polymer at 2–5 g/kg dry solids can raise loading further by building more buoyant flocs. Those loading gains are why a 50 m³/h DAF often fits in 40–60 m² while gravity needs 100–150 m².
Keep recycle pressure and blanket depth in the OPEX model. Training references commonly run the recycle stream near 40–70 psi (about 2.8–4.8 bar). An air-to-solids ratio around 0.02–0.04 is a practical starting band. A float blanket of about 150–200 mm is usually enough to limit clarified solids carry-over near 100 mg/L.
| System Size (m³/h) | Estimated CAPEX Range ($) | Estimated OPEX Range ($/m³) | Typical Solids Concentration (%) | Typical Footprint (m²) |
|---|---|---|---|---|
| 10 | 80,000–120,000 (Skid-mounted, Stainless Steel) | 0.10–0.18 | 5–7 | 15–30 |
| 50 | 150,000–220,000 (Custom DAF Unit + Air System) | 0.15–0.22 | 5–8 | 40–60 |
| 200 | 250,000–350,000 (Large-scale, Integrated Controls) | 0.18–0.25 | 6–8 | 120–180 |
For applications requiring precise chemical addition and control, consider an automatic chemical dosing system to optimize polymer usage and efficiency in DAF operations.
Cost Comparison Table: Gravity vs DAF Thickener by Sludge Type and Volume
Side-by-side CAPEX and OPEX shift with sludge type, not only with flow. Primary municipal sludge settles well in gravity tanks. Secondary WAS and oily food sludge usually favor DAF on both solids and footprint.
For a 50 m³/h secondary sludge train, gravity may show about $150,000 CAPEX, $0.03/m³ OPEX, 4–6% solids, and roughly 120 m². DAF for the same flow may show about $200,000 CAPEX, $0.18/m³ OPEX, 5–8% solids, and about 60 m².
When influent TSS exceeds 5,000 mg/L and tip fees are high, DAF's higher unit OPEX is often recovered in haul savings. Use the table below as a screening sheet, then run the payback math in the next section. Match your sludge chemistry before you average the CAPEX bands.
| Sludge Type | Flow Rate (m³/h) | CAPEX (Gravity) ($) | CAPEX (DAF) ($) | OPEX (Gravity, $/m³) | OPEX (DAF, $/m³) | Solids Concentration (%) | Footprint (m²) |
|---|---|---|---|---|---|---|---|
| Primary Sludge (Municipal) | 100 | 180,000 | 250,000 | 0.03 | 0.15 | 4–6 | 200 |
| Secondary Sludge (Municipal) | 50 | 150,000 | 200,000 | 0.04 | 0.18 | 4–6 (Gravity), 5–8 (DAF) | 120 (Gravity), 60 (DAF) |
| Food Processing Sludge | 75 | 170,000 | 230,000 | 0.05 | 0.20 | 5–7 (Gravity), 6–9 (DAF) | 150 (Gravity), 80 (DAF) |
| Pulp & Paper Sludge | 150 | 220,000 | 300,000 | 0.06 | 0.22 | 6–8 (Gravity), 7–10 (DAF) | 250 (Gravity), 130 (DAF) |
| Chemical Industry Sludge | 30 | 100,000 | 150,000 | 0.07 | 0.25 | 5–7 (Gravity), 7–9 (DAF) | 60 (Gravity), 40 (DAF) |
How Does a Gravity Belt Thickener Fit Wastewater Treatment?
A gravity belt thickener (GBT) is a mechanical alternative to circular gravity tanks and DAF float cells. Free water drains through a moving porous belt while polymer-conditioned sludge forms a thickened mat. EPA lists gravity belt thickening among the common biosolids thickening methods alongside DAF, centrifuges, and conventional gravity tanks.
GBTs usually need less land than a 3–4 m side-water-depth gravity tank and less compressor power than DAF. They still need reliable polymer make-down and wash water. For WAS that settles poorly in a gravity thickener, a GBT or DAF often becomes the practical shortlist.
When comparing gravity vs DAF thickener cost on a crowded site, ask whether a belt machine can meet the same solids target inside the existing building envelope. That check can avoid pouring a new concrete tank. It also clarifies whether the real competitor is DAF or a compact belt unit.
What Is a Water Treatment Plant Cost Breakdown for Thickeners?
A practical water treatment plant cost breakdown for sludge thickening separates equipment, civil works, installation, polymer, power, maintenance, and disposal. Equipment and civil set CAPEX. Polymer, power, parts, and tip fees set OPEX.
Disposal often dwarfs thickener power once cake solids fall even one point. Use this wastewater CAPEX calculator logic for a first pass. Collect sludge flow (m³/h), current disposal price ($/ton), target solids for gravity and DAF (%), CAPEX for each option, and OPEX ($/m³).
Payback Period (years) = (DAF CAPEX − Gravity CAPEX) / (Annual OPEX Savings + Annual Disposal Savings). Example: a 100 m³/h food plant. Gravity CAPEX $200,000, OPEX $0.04/m³, 5% solids, annual disposal $120,000.
DAF CAPEX $280,000, OPEX $0.20/m³, 7% solids, annual disposal $85,000. Disposal savings equal $35,000/year. Net annual benefit after higher DAF OPEX still lands near $70,000/year in the worked example, so payback is ($280,000 − $200,000) / $70,000 = 1.14 years.
Stress-test sludge volume, tip-fee escalators, and power price before you lock the purchase order. Separate one-time and recurring lines on the sheet. One-time lines include equipment, freight, foundation, piping, electrical, commissioning, and training.
Recurring lines include polymer, power, labor minutes per shift, seal water, spare parts, and disposal. Plants that bury disposal inside a lump “sludge handling” account often pick gravity, then watch tip fees erase the CAPEX win within 18 months.
Currency and duty cycles matter. The ranges above assume continuous industrial duty near 8,000–8,760 h/year. A plant that runs 5,000 h/year stretches DAF payback because disposal savings accrue more slowly while CAPEX stays fixed. Re-run the 1.14-year food-plant example at your actual operating hours before you treat that payback as a commitment number.
Selection checklist before you issue an RFQ:
- Measure peak and average sludge flow in m³/h, not only design average.
- Record feed %TS and whether the stream is primary, WAS, or mixed.
- Confirm usable footprint in m² and any building height limit.
- Price current disposal in $/ton and contract escalation clauses.
- Compare polymer demand and power at the target solids, not at nameplate flow alone.
- Include scraper, compressor, and dosing skid spares in five-year OPEX.
Real-World Cost Scenarios: When Gravity or DAF Wins
Three plant types show how the same unit prices flip the winner. Match your sludge, land, and permit limits to the closest case before averaging industry CAPEX bands.
Scenario 1: Municipal WWTP with ample space and a tight CAPEX budget. The plant thickens 200 m³/h of primary sludge. Gravity is about $250,000 CAPEX and $0.03/m³ OPEX at 5% solids. DAF is about $350,000 CAPEX and $0.15/m³ OPEX at 6% solids.
With land available and CAPEX capped, gravity wins on first cost. The modest solids gap rarely pays back a $100,000 premium when tip fees stay moderate.
Scenario 2: Food plant with limited space and high disposal costs. The plant handles 50 m³/h of secondary sludge at $200/ton disposal. Gravity is $120,000 CAPEX, $0.04/m³ OPEX, 4% solids, and about $150,000/year disposal.
DAF is $200,000 CAPEX, $0.20/m³ OPEX, 7% solids, and about $85,000/year disposal. Payback is roughly 1.3 years, so DAF wins on life-cycle cost despite the higher sticker price.
Scenario 3: Pulp and paper mill with high TSS and strict effluent limits. Flow is 150 m³/h with TSS above 10,000 mg/L. Gravity at $220,000 CAPEX and $0.05/m³ OPEX may reach only about 92% TSS capture.
DAF at $300,000 CAPEX and $0.22/m³ OPEX can reach about 98% TSS capture. Compliance and higher solids justify DAF. For sludge dewatering needs following thickening, understanding belt filter press efficiency and cost data is crucial.
Across these cases, the decision rule is consistent. Choose gravity when primary sludge settles well, land is cheap, and CAPEX is the binding constraint. Choose DAF when WAS or oily industrial sludge resists settling, floor area is scarce, or disposal exceeds roughly $150–$200/ton.
Hybrid trains remain the default for large municipal plants that can segregate primary and secondary streams without expensive pumping changes. Readers should adapt these scenarios to their sludge, space, permits, and financial targets.
For sludge dewatering applications, consider the performance of a plate-frame filter press following thickening.
Who This Is For and Next Step
This comparison fits plant engineers, EPC contractors, and procurement managers who must choose between gravity and DAF thickeners on industrial or municipal sludge. Look elsewhere if you only need a full-plant India market model of capex and opex across every process train.
For reactor-level digester economics, the cost comparison of UASB and CSTR reactors covers a different unit operation. If your sludge data, tip fee, and footprint are ready, request a sized thickener quote through our project inquiry form so engineering can check solids loading and polymer demand against your feed.
Frequently Asked Questions
What is the biggest hidden cost of gravity thickeners?
Higher sludge disposal fees are usually the largest hidden cost. Gravity thickeners typically produce 4–6% solids, while DAF systems often reach 5–8% solids. For a 100 m³/h plant, that gap can mean $50,000–$100,000 more per year in haul and tip charges when water stays in the cake. EPA guidance also notes gravity units need more land than DAF, gravity belt, or centrifuge thickeners.
How much polymer does a DAF thickener typically use?
DAF systems aiming for 95%+ TSS removal typically dose about 2–5 mg/L of polymer on many industrial feeds. At 50 m³/h, that dose often adds roughly $0.03–$0.08/m³ to OPEX. Dose should be confirmed by jar tests because WAS and food sludge demand different polymer types and charge densities.
Can I retrofit a gravity thickener to improve its efficiency?
Limited gains are possible with picket fences or sludge recirculation, often about 10–15% higher solids. Those upgrades rarely solve a severe footprint shortage. When the tank already occupies the only available pad, replacing or adding a DAF skid is usually the more durable path.
What is the expected lifespan of a gravity versus a DAF thickener?
Concrete gravity thickeners often last 20–30 years; stainless gravity units typically last 15–20 years. Stainless DAF systems generally last 15–25 years, while fiberglass DAF shells may last 10–15 years. DAF maintenance is usually higher because compressors, recycle pumps, and saturators add wear points.
Are there hybrid thickening systems that combine gravity and DAF?
Yes. Many plants thicken primary sludge by gravity and send secondary WAS to DAF. That split can cut overall CAPEX by about 20–30% versus putting every stream on DAF. Hybrid layouts also keep gravity OPEX low where settling already works well.
Related Equipment
- DAF thickeners for industrial wastewater — view specifications, capacity range, and technical data
- lamella clarifiers for gravity thickening applications — view specifications, capacity range, and technical data
Need a customized solution? Request a free quote with your specific flow rate and pollutant parameters.