
Which Rules Control a Tenaha Sewer Discharge?
A food and beverage plant near Tenaha should engineer its pretreatment system around the current permit issued by the receiving public sewer authority, not around a generic federal limit. The National Pretreatment Program at 40 CFR 403 establishes the federal framework; applicable categorical standards establish process-specific requirements; and the site-specific POTW permit supplies the enforceable discharge conditions. Treatment design should therefore compare every permit parameter, monitoring obligation, and acceptance criterion before equipment is selected. The Tenaha-area pretreatment planning framework should begin with those controlling documents, not with a preselected treatment formula.
The federal categorical standards supplied in the research are 40 CFR Part 405 for dairy, Part 406 for grain mills, Part 407 for canned and preserved fruits and vegetables, Part 408 for canned and preserved seafood, and Part 409 for meat products. These standards set process-specific requirements for pollutants such as BOD, TSS, FOG, and pH. TCEQ regulates wastewater discharges in Texas, but an indirect discharger normally works under the permit, sewer-use ordinance, and compliance program administered by its POTW or other approved local control authority.
The procurement rule is straightforward: local permit conditions may be stricter than the applicable categorical standard, so equipment must be designed against both. Before detailed design, obtain the current industrial-user or significant-industrial-user permit, sewer-use ordinance, local-limit tables, monitoring schedule, surcharge provisions, sampling instructions, and renewal or compliance-plan correspondence.
| Control layer | What it controls | Evidence required before design |
|---|---|---|
| Federal pretreatment framework | National pretreatment requirements administered under 40 CFR 403 | Applicable industrial-user status and approved local program |
| Categorical standard | Process-specific requirements under the applicable food-processing subpart | Product, process, SIC/NAICS, and federal subpart determination |
| Local permit and ordinance | Enforceable limits, monitoring, reporting, surcharges, and enforcement | Current permit, local-limit tables, sewer ordinance, and authority correspondence |
| POTW acceptance criteria | Receiving-system hydraulic, biological, and solids-handling constraints | Documented acceptance conditions and required demonstration data |
For a comparable Texas application, see How Do Food & Beverage Plants Near Marietta Meet Sewer Limits? The governing principle remains the same: the enforceable discharge envelope is established by the receiving authority’s current requirements, not by a federal minimum alone.
Why Food and Beverage Wastewater Breaks Sewer Limits
Food processing wastewater fails treatment design most often when engineers use an average flow and an averaged pollutant profile to represent production, sanitation, and CIP waste. Six parameters define the useful design basis: BOD/COD, TSS, FOG, total phosphorus, pH, and temperature. The 2024 Nature Food analysis found that state-level policies offered only 5–14 kg per capita of likely food-waste diversion potential while generation continued to rise in most states; that policy finding does not establish a discharge limit, but it reinforces scrutiny of organic loads.
The supplied research reports raw dairy and meat wastewater at 1,000–10,000 mg/L BOD. FOG can reach several thousand mg/L in fryer, rendering, and stickwater streams, while cereal, dairy, and meat wastewater commonly contains 10–100 mg/L total phosphorus as P. Those figures are source-characterization ranges, not Tenaha discharge limits. The actual permit and tested plant data determine the treatment target.
| Design parameter | Supplied wastewater evidence | Operational consequence |
|---|---|---|
| BOD/COD | Raw dairy and meat wastewater: 1,000–10,000 mg/L BOD | Organic slugs can overload biological capacity and increase surcharge exposure |
| FOG | Several thousand mg/L is possible in fryer, rendering, and stickwater streams | Pipe and solids-handling interference; DAF breakthrough risk |
| Total phosphorus | Cereal, dairy, and meat wastewater: commonly 10–100 mg/L as P | Chemical dosing and solids handling may be required |
| pH | CIP chemistry can produce sharp acid or caustic excursions | Equalization and pH trimming are required |
| Temperature | CIP and cooking operations can exceed 40 °C | Downstream nitrification biology can be affected without equalization |
| TSS | Must be established for each plant and production stream | Controls screening, solids removal, sludge volume, and polishing |
Production changeovers, batch schedules, CIP cycles, and seasonal output make hourly wastewater characteristics different from the daily average. FOG can interfere with collection systems and POTW solids handling; organic slugs increase biological oxygen demand; and pH excursions can disrupt the receiving treatment process. The supplied research specifically warns that temperature excursions above 40 °C from CIP and cooking operations are routine and can shut down downstream nitrification biology if they are not equalized.
Additional context for variable beverage-plant flows appears in MBBR for Soft Drink Wastewater: 2026 Design Guide. For a Tenaha plant, however, that broader framework must be reconciled with current permit language and measured site data.
Segment the Wastewater Before You Select Equipment
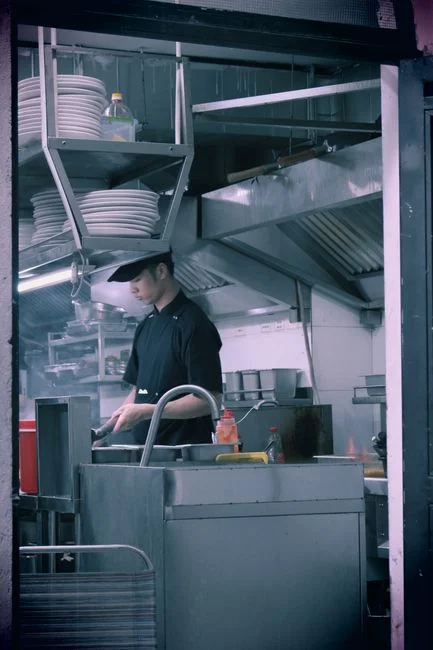
Stream segregation determines whether each treatment unit receives a stable and designable load. Before combining flows, map the sanitary sewer from every production, sanitation, CIP, and utility source. Separate process water, sanitation and floor wash, CIP rinses, and non-contact cooling-water blowdown; then assign each stream a treatment and monitoring route.
Process and floor-wash streams carrying FOG and solids normally require screening and DAF ahead of biological treatment. Process water and CIP rinses can enter equalization when the selected treatment concept accommodates their pH, heat, and chemical composition. Equalization is both hydraulic and chemical control: it should buffer production surges and CIP dumps so biology receives a manageable flow, strength, pH, and temperature.
Non-contact cooling blowdown deserves separate evaluation. It is generally lower in organics, but it can carry heat, lubricants, and trace metals; routing it automatically through biological treatment is not a neutral decision. Its permit treatment may differ from contact-process wastewater.
- Map every discharge source and its normal operating pattern.
- Separate contact process, floor wash, CIP, and non-contact utility flows.
- Characterize flow, peak-to-average ratio, BOD/COD, TSS, FOG, total phosphorus, pH, and temperature.
- Match each stream to the treatment duty it creates.
- Confirm combined flow and mass loading before final sizing.
A rotary mechanical bar screen can protect downstream equipment from rags, fibrous material, packaging debris, and product solids, but it does not replace source segregation. Final sizing must use representative sampling across production and CIP cycles rather than a single compliance sample.
Build a Treatment Train That Addresses Every Permit Parameter
The defensible treatment sequence supplied in the research is screening, equalization, DAF, biological treatment, chemical precipitation, and final polishing. Each stage has a specific removal duty and should be tied to a permit parameter, measuring point, and acceptance criterion.
| Stage | Primary duty | Design evidence |
|---|---|---|
| Screening | Remove product solids, debris, rags, and fibrous material | Solids inventory and selected screen duty |
| Equalization | Stabilize flow, strength, pH, and temperature | Production/CIP schedule, peak flow, and excursion data |
| DAF | Remove FOG, emulsified oils, colloids, and suspended solids | 4–25 m/h surface loading; 0.005–0.02 air-to-solids ratio; 20–40% recycle rate |
| Biological treatment | Reduce soluble organics after DAF | Conventional activated sludge: 8–24 h HRT and 3,000–5,000 mg/L MLSS; MBR: 4–10 h HRT and 8,000–12,000 mg/L MLSS |
| Chemical precipitation | Remove phosphorus | 50–250 mg/L alum or 30–150 mg/L ferric chloride, adjusted through jar testing |
| Final polishing | Meet lower TSS or disinfection requirements | Permit limits, solids benchmark, and receiving-system acceptance criteria |
Screening protects pumps and downstream biological stages. Equalization then buffers CIP dumps, production surges, and the temperature excursions above 40 °C identified in the supplied research. DAF is the stronger primary option where FOG and emulsified oils dominate; an industrial DAF system for FOG removal must be conditioned for the measured oil and solids characteristics.
Biological treatment then removes dissolved organics. The supplied design references distinguish conventional activated sludge from MBR by hydraulic retention time and mixed-liquor suspended solids. An MBR membrane bioreactor for low-solids effluent combines biological treatment and membrane filtration where the permit requires lower suspended solids or the available footprint is constrained. It still requires biological reaction time, membrane-area confirmation, pretreatment, fouling controls, and a defensible waste-residual route.
Phosphorus control requires chemical precipitation. The supplied ranges are starting points for dose trials, not automatic settings; dose must respond to flow, phosphorus form, mixed-liquor alkalinity, and permit margin. An automatic chemical dosing system can implement flow-paced feed, but verification still depends on representative sampling and jar testing.
Sludge handling cannot be omitted from the train. DAF skimmings and biological waste activated sludge require thickening or dewatering. The sourced plate-and-frame press range is 1–500 m² of filtration area, so filter area must be selected from sludge volume, solids content, cycle time, and disposal route rather than a generic package size.
Choose DAF or Lamella Clarification for the Primary Stage
DAF is the appropriate primary stage when FOG or emulsified oil is the dominant load, while lamella clarification is stronger when TSS dominates and chemical consumption is the principal operating priority. The supplied product references describe a DAF range of 4–300 m³/h across 13 standard models with micro-bubble flotation and automatic skimming. They describe lamella clarification at 20–40 m/h surface loading and report chemical consumption up to 30% below conventional clarifiers.
| Decision factor | DAF | Lamella clarification |
|---|---|---|
| Dominant contaminant | FOG, emulsified oil, colloids, and floatable solids | TSS and settleable solids |
| Typical food-processing fit | Dairy, meat, poultry, rendering, and related high-FOG streams | TSS-dominant streams with chemical-use priorities |
| Supplied loading reference | 4–25 m/h surface loading | 20–40 m/h surface loading |
| Chemical use | Conditioning may be needed for reliable flotation | Up to 30% lower consumption than conventional clarifiers |
| Key risk | Underdosing or hydraulic overload can cause FOG breakthrough | Poor fit where emulsified oil or FOG is the controlling load |
| Post-treatment benchmark | 25–50 mg/L O&G and 50–100 mg/L TSS after proper conditioning | Must be established against the POTW acceptance envelope |
Those post-DAF values are engineering benchmarks from the supplied source, not universal performance guarantees. A lamella unit should not be selected merely because its footprint appears attractive; the measured FOG profile and emulsification characteristics must show that it can meet the acceptance envelope.
For a broader equipment decision, use What Industrial ETP or DAF System Does a Factory Need? 2026 and compare footprint, recovered-sludge quality, chemical use, hydraulic loading, maintenance, and redundancy. A high-efficiency sedimentation tank should be evaluated against those criteria and the actual permit—not against generic removal percentages.
Turn the Permit into Monitoring and Acceptance Testing
Acceptance testing should reproduce the permit’s measurement and reporting conditions rather than rely on a vendor’s generic performance demonstration. The supplied research identifies 24-hour composite sampling for BOD, TSS, FOG, and total phosphorus at monthly-to-quarterly frequencies, plus continuous pH and flow monitoring for significant industrial users. The current Tenaha-area permit must be checked for its exact methods, frequencies, sampling points, and responsible party.
| Permit obligation | Treatment/control response | Acceptance evidence |
|---|---|---|
| BOD/COD limit | Equalization, biological treatment, and final polishing as required | Composite-sample results during the agreed test duration |
| TSS limit | Screening, DAF or clarification, and solids polishing | Representative sampling at the designated compliance point |
| FOG limit | Conditioned DAF with scum handling | Test results tied to representative influent and sludge route |
| Total phosphorus limit | Chemical precipitation and solids removal | Dose logs, jar-test support, and composite phosphorus results |
| pH limit | Equalization, trim system, alarms, and controlled discharge | Continuous calibration and event-response demonstration |
| Temperature limit | Equalization and controlled blending or discharge | Continuous temperature record and excursion test |
| Flow and reporting conditions | Flow metering, SCADA logging, and reporting interface | Verified data, audit trail, and successful test report submission |
Build the electronic discharge-monitoring workflow around the SCADA event log, required discharge-monitoring reports, and the authority’s noncompliance portal. The supplied 2026 source notes that electronic reporting is increasingly the default for significant industrial users and that systems unable to transmit compliant event data create exposure. Confirm the actual Tenaha reporting platform and data fields during procurement.
The proposal should define startup tests, performance tests, guaranteed effluent values, test duration, sampling protocol, bypass response, corrective-action process, and operator-training acceptance. A plate-and-frame filter press also needs an acceptance protocol for cake discharge, moisture, cycle performance, and residual-sludge handling.
Document calibration, flow-proportional compositing, chain of custody, excursion alarms, operator response, and corrective actions. A passing sample does not establish long-term compliance: the supplied source warns that an unreported weekend CIP excursion can carry the same enforcement weight as a chronic violation.
Plan the Permit-Ready Procurement Path
The permit and influent basis should be locked before supplier selection. Issue the current permit, sewer-use ordinance, process flow diagram, production schedule, CIP chemistry, and representative wastewater analysis as mandatory bid documents. Without those inputs, a supplier can properly quote a preliminary configuration but cannot responsibly guarantee final capacity or permit compliance.
Require each bidder to state its design flow, peak factor, treatment-stage redundancy, control philosophy, sludge-handling route, utilities, installation constraints, commissioning plan, and performance guarantee. The guarantee should identify tested influent conditions, guaranteed effluent parameters, sampling points, test duration, and remedy for nonperformance.
Keep provisional selection separate from final sizing. Actual testing may reveal different FOG, phosphorus, pH, temperature, or peak-flow conditions and require the design to be revisited. Evaluate lifecycle constraints including chemical use, aeration energy, sludge hauling, operator staffing, replacement parts, remote monitoring, and service response.
Finally, require the supplier to identify how it will support permit submissions, electronic reporting interfaces, acceptance testing, operator training, and corrective actions after commissioning. For a practical process-screening framework, use What Industrial ETP or DAF System Does a Factory Need? 2026.
Frequently Asked Questions
What does a food and beverage plant near Tenaha need to quote pretreatment equipment?
Request a quote using the current POTW permit limits, representative wastewater results, design flow and peak factor, production and CIP schedule, treatment scope, sludge route, utilities, installation constraints, and required guarantees. No defensible installed price can be stated without those inputs because FOG, phosphorus, equalization, biological treatment, polishing, and controls can change the scope substantially.
How should a supplier be selected for an enforceable sewer-discharge project?
Select against performance evidence and delivery capability, not equipment name alone. Require guarantees tied to representative wastewater, references for comparable food-processing installations, controls integration, commissioning records, operator training, permit-related testing support, and a defined corrective-action process. Also verify that the proposed system addresses the POTW’s documented acceptance criteria.
Should equipment be sized by peak flow or by pollutant mass loading?
Evaluate both. Peak flow determines hydraulic capacity, equalization behavior, transfer-pump requirements, and peak treatment rates; pollutant mass loading determines DAF, biological, precipitation, and polishing duties. Equalization capacity depends on the production and CIP schedule because the same average flow can produce different wastewater volumes, strengths, pH levels, and temperatures.
What are the main compliance risks after commissioning?
The principal risks are missed reports, unrecorded pH or temperature excursions, hydraulic overload, FOG breakthrough, phosphorus exceedances, solids breakthrough, bypasses, and failed performance tests. The operating program should assign each parameter to a control, alarm, sampling method, responsible operator, response action, and retained record; use the food-processing MABR design guide only as secondary technical context, not as a substitute for the Tenaha permit.