Why Rendering Sludge Is a Different Problem
Rendering wastewater carries 5,000–25,000 mg/L COD alongside 1,000–4,000 mg/L FOG, 200–800 mg/L TKN, and 2,000–8,000 mg/L TSS — concentrations that routinely exceed municipal sewage by an order of magnitude (ScienceDirect, 2022). The dissolved proteins, emulsified fats, blood, paunch content, and ammoniacal nitrogen ride on batch cook/press cycles that swing pH from 4 to 11 and temperature from 30 °C to 75 °C within a single shift. That shock profile, combined with hydrogen sulphide and volatile fatty acids from breakdown of sulphur-containing amino acids, is what makes rendering sludge a different engineering problem from municipal biosolids: equalisation of 6–24 h is a design prerequisite, not an option, and downstream biology must tolerate ammonia peaks above 500 mg/L without nitrification collapse. Treat rendering sludge as a "green raw material, dirty wastewater" stream — high nutrient value on one side of the ledger, heavy pollution load on the other — and every unit operation from DAF through dewatering has to be sized for the harder number (ScienceDirect, 2022).
Rendering Wastewater Characterisation: The Numbers That Drive Design
Every later design choice — DAF surface loading, aeration tank volume, polymer dose, filter press area — anchors back to the parameters in this table. Engineers can paste it directly into a design basis and adjust site-specific figures from jar tests and pilot data.
| Stream | COD (mg/L) | BOD (mg/L) | FOG (mg/L) | TKN (mg/L) | TSS (mg/L) | TS (%) | VS (% of TS) | pH | Temp (°C) |
|---|---|---|---|---|---|---|---|---|---|
| Raw wastewater | 5,000–25,000 | 1,000–6,000 | 1,000–4,000 | 200–800 | 2,000–8,000 | 1.0–3.0 | 70–85 | 4–11 | 30–75 |
| Post-DAF effluent | 3,000–15,000 | 800–4,000 | <100–200 | 180–750 | 800–3,000 | — | — | 6–8 | 25–55 |
| Post-biological effluent | <125–250 | <25–30 | <10–20 | <10–40 | <30 (CAS) / <5 (MBR) | — | — | 7–8 | 15–35 |
| Thickened sludge (mixed) | — | — | — | — | 40,000–60,000 | 4–6 | 65–80 | 6.5–7.5 | 20–40 |
| Dewatered cake | — | — | — | — | — | 22–35 | 60–75 | — | Ambient |
Three figures from the table deserve emphasis. Post-DAF FOG below 100–200 mg/L is achievable at 80–95% removal with proper coagulant/polymer conditioning. Mixed primary plus waste activated sludge thickens to 4–6% TS before dewatering. And the dewatered cake, once dried, carries a calorific value of about 12 MJ/kg — comparable to low-grade coal — which is the single number that justifies any thermal-recovery discussion (International Plasma Technology Center).
Headworks and FOG Capture: Screens, Grit, and Dissolved Air Flotation
Rotary mechanical bar screens with 1–3 mm aperture are the first line of defence at a rendering WWTP: a stainless rake with brush discharge lifts hair, paunch solids, bone fragments, and feathers off the flow before they reach pumps and DAF nozzles. Specifying a rotary mechanical bar screen for headworks sized to 1.5× peak flow keeps downstream units clean and prevents ragging of DAF recycle pumps.
Dissolved air flotation is the standard FOG and suspended-solids capture step for rendering effluent (ScienceDirect, 2022). A well-operated unit runs at hydraulic retention of 20–40 min, surface loading of 5–20 m/h, and saturates recycle at 30–50% of forward flow. Coagulant dose typically lands at 50–150 mg/L as polyaluminium chloride or ferric chloride, with anionic polymer at 2–5 mg/L to bridge the emulsified fat. The float skims off at 3–6% DS and is often re-melted to recover tallow — a direct revenue line that offsets coagulant OPEX. For greenfield designs, an industrial DAF system for FOG and suspended solids sized to peak batch flows with 25% hydraulic margin will hold up under cook-cycle surges. Downstream of DAF, an equalisation tank sized for 6–24 h of residence — covered, mixed, and vented through an odour scrubber — smooths the shock loads that would otherwise collapse nitrification. For a deeper look at how DAF compares with oil-water separators, the DAF vs oil-water separator trade-offs analysis covers hydraulic and chemistry constraints side by side.
Biological Treatment: Choosing Between Conventional Activated Sludge, MBR, and Anaerobic Front-End
Three configurations dominate 2026 design practice for rendering wastewater biology. Conventional activated sludge (CAS) with nitrification-denitrification handles BOD 1,000–3,000 mg/L and TKN 200–500 mg/L at SRT 15–25 d, HRT 12–36 h, and MLSS 3,000–5,000 mg/L; it is the cost baseline for sewer-discharge sites. MBR with submerged 0.1 μm PVDF membranes delivers effluent TSS <5 mg/L and BOD <10 mg/L in roughly 60% of the CAS footprint — the right pick when discharge is to a sensitive receiving water or when water reuse is on the table. An MBR membrane bioreactor for high-strength biological stage sized to a peak flux of 15–18 L/m²·h and operated with intermittent backwash holds up under the FOG residuals that slip past a well-tuned DAF.
Anaerobic front-end reactors — UASB, EGSB, or CSTR — sit ahead of either configuration when influent COD exceeds 5,000 mg/L and the plant has a use for biogas. They remove 60–80% of COD, produce 0.25–0.40 m³ biogas per kg COD fed at 60–70% methane, and cut aeration energy by 60–80%. A head-to-head comparison of these three configurations, framed as a 4-column decision matrix, lets the engineer match the process to the site's discharge target and energy economics.
| Criterion | CAS | MBR | Anaerobic + polishing |
|---|---|---|---|
| Influent COD range | 1,000–5,000 mg/L | 1,000–8,000 mg/L | 5,000–25,000 mg/L |
| Effluent BOD / TSS | <30 / <30 mg/L | <10 / <5 mg/L | <30 / <30 mg/L (after polishing) |
| Footprint | Baseline (1.0×) | 0.4–0.6× | 0.3–0.5× for primary reactor |
| Energy demand | 0.4–0.6 kWh/m³ | 0.5–0.8 kWh/m³ | 0.05–0.15 kWh/m³ + polishing |
| Sludge yield | 0.3–0.5 kg TSS/kg BOD | 0.25–0.4 kg TSS/kg BOD | 0.05–0.15 kg TSS/kg COD |
| Biogas production | None | None | 0.25–0.40 m³/kg COD |
| Capex vs opex | Low capex, high opex | Higher capex, lower footprint opex | High capex, lowest opex with CHP |
One 2026 trend worth specifying into the design basis: activated-sludge stability is moving from static composition tests to dynamic biotoxicity monitoring. A perception-cognition-response architecture — online sensors feeding tiered decision logic — gives operators a faster lever on toxic shocks than waiting 24 h for a respirometry result (Toxics, 2026-05). The takeaway for an RFP in 2026: spec online NH₃, COD, and toxicity sensors, and write adaptive aeration control into the control narrative. For facilities weighing the CAS-versus-MBR decision on a related high-strength stream, the MBR vs conventional activated sludge trade-offs piece in this guide series is a useful parallel.
Sludge Thickening and Dewatering: Closing the Mass Balance
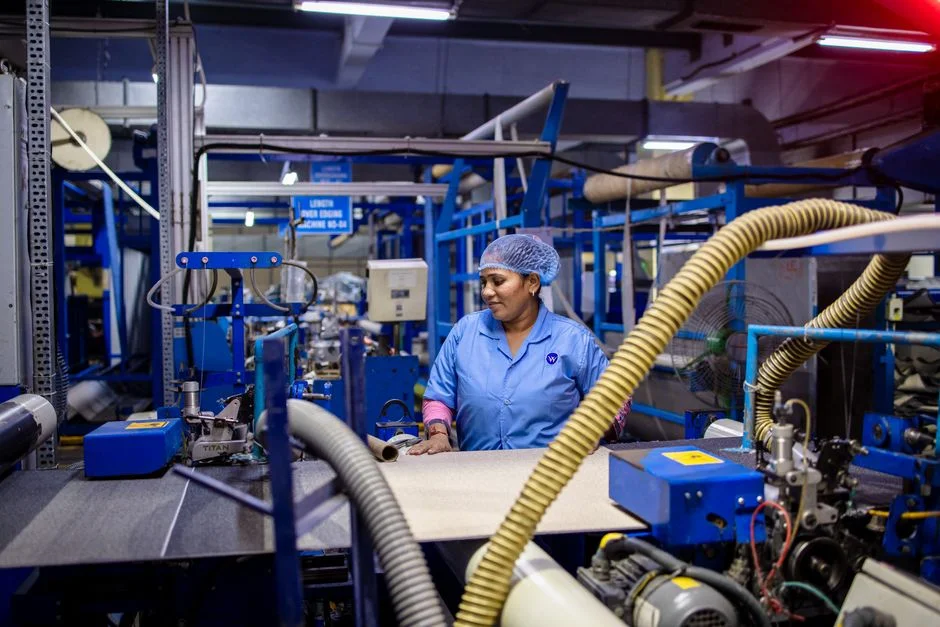
Waste activated sludge leaves the bioreactor at 0.5–1.5% TS. Gravity belt thickeners or DAF thickeners raise it to 4–6% TS with a polymer dose of 2–5 kg/t DS and a hydraulic loading of 20–40 m³/m·h. The thickened stream is then blended with primary sludge and fed to a dewatering unit. A plate and frame filter press for rendering biosolids is the workhorse: 2–4 h cycle, 8–15 kg cationic polymer per ton DS, cake 22–35% DS, and filtrate SS typically below 200 mg/L — clean enough to recycle back to the head of the plant. A decanter centrifuge is the alternative where footprint dominates: cake 20–28% DS at higher polymer demand and lower capex, with a continuous rather than batch duty cycle. The right pick depends on whether the plant values cake dryness (filter press wins) or throughput continuity (centrifuge wins).
The mass-balance impact is large. Going from 1% TS liquid sludge to 30% DS cake is a 97% water reduction, which translates to a 75–85% reduction in wet tonnes hauled to disposal. At typical rendering-plant sludge loads, that single dewatering step saves more in off-site tipping fees than the filter press capital cost recovers in five to seven years. For flows where gravity settling is required upstream of thickening — particularly after chemical coagulation of high-FOG streams — pairing the filter press with a high-efficiency sedimentation tank sized to 1.0–1.5 m³/m²·h surface loading reduces solids loading on the press and improves cake consistency.
Resource Recovery: Biogas, Protein, and Thermal Energy
Once dewatering is locked in, the sludge train becomes a resource-recovery train. Biogas from a mesophilic anaerobic digester (35–37 °C, HRT 20–30 d) yields 0.25–0.40 m³/kg COD removed, with an energy content of 12–18 MJ per kg VS destroyed depending on substrate and CH₄ fraction. Co-firing that gas in a boiler or running it through a CHP unit at a 2026 industrial electricity price typically delivers an internal rate of return in the 12–22% range, dominated by the local power tariff. Protein hydrolysate is a second stream: enzymatic hydrolysis of rendering wastewater can cut chemical consumption by about 90% and reduce metal-depletion impact by nearly 30% in documented poultry-plant cases, with the recovered peptide fraction sold into fertiliser or animal-feed markets (ScienceDirect, 2022). Struvite precipitation from digester centrate is the 2026 emerging side-stream — magnesium-ammonia-phosphate crystallisation at pH 8.5–9.0 recovers P as a slow-release fertiliser and removes a chunk of the centrate ammonia load. Plasma-assisted gasification of dried biosolids, with modelled thermal efficiency approaching 85% in the most efficient syngas-to-power configurations, sits on the longer horizon but is real (International Plasma Technology Center). Engineers should size the resource-recovery case study before locking the dewatering equipment, since the right cake dryness target depends on whether the cake goes to landfill, land application, or combustion.
2026 Compliance, Monitoring, and Spec Checklist
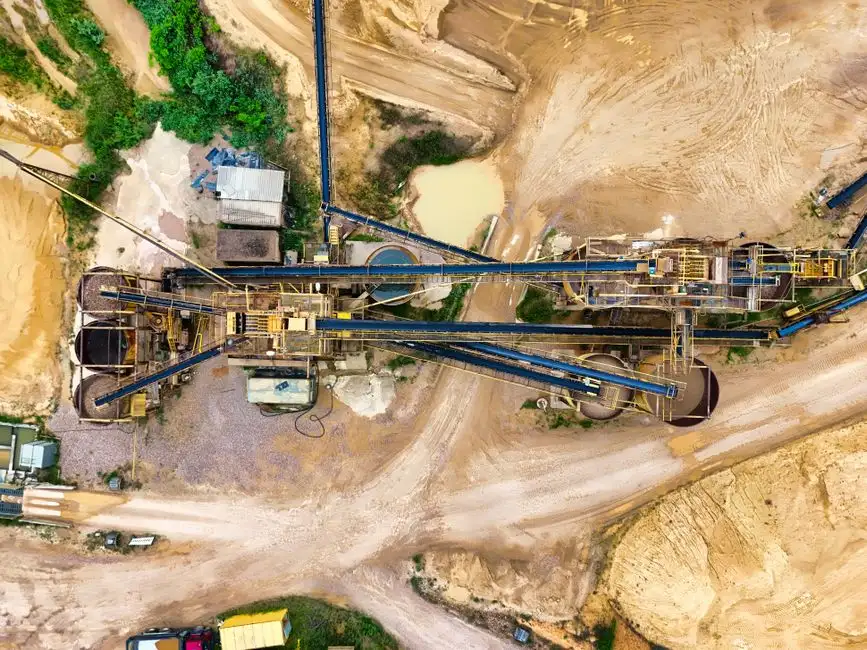
Two regulatory frameworks define the disposal envelope for dewatered rendering sludge in 2026. EU operators work under Regulation (EC) 1069/2009 on animal by-products, which sorts rendering material into categories 1, 2, and 3 and dictates downstream handling, plus the Industrial Emissions Directive 2010/75/EU for discharge to sewer or surface water. US operators land-applying biosolids must meet the EPA 40 CFR Part 503 ceiling concentration limits and pollutant loading rates, with pathogen reduction via Class A (PFRP) or Class B (PSRP) processes. Typical discharge consent numbers in 2026 sit at BOD <25–30 mg/L, COD <125–250 mg/L, FOG <10–20 mg/L, and total nitrogen <10–40 mg/L — confirm with the local authority before finalising design.
A spec checklist that can be copied into an RFP or design basis in 2026 should include the following line items, each with its operating parameter or regulatory anchor.
| Item | Parameter / anchor | Source |
|---|---|---|
| Online TSS / COD / NH₃ sensors on biological stage | ≤5 min response, adaptive aeration tie-in | Toxics 2026 trend |
| Polymer dosing skid | 2–15 kg/t DS, cationic, nearshore to filter press | automatic chemical dosing for coagulation and polymer feed |
| Filter press + cake conveyor | 22–35% DS, 2–4 h cycle | HydropureWater field data, 2026 |
| Covered equalisation with odour control | 6–24 h HRT, H₂S <5 ppm at scrubber outlet | Industry practice |
| Effluent disinfection (UV) | 30–40 mJ/cm², <5 mg/L TSS upstream | UV steriliser for effluent polishing |
| Land-application ceiling concentrations | 40 CFR Part 503 Table 1 | US EPA |
| ABP category handling | EU 1069/2009 categories 1/2/3 | EU regulation |
For plants considering co-located treatment of similar food-industry streams, the edible oil wastewater sludge treatment reference in this series covers the FOG-capture and recovery overlaps in more depth.
Frequently Asked Questions
What is the typical FOG removal efficiency of DAF on rendering wastewater?
80–95% with chemical conditioning using polyaluminium chloride or ferric chloride plus anionic polymer. Float solids skim at 3–6% DS and are often re-melted to recover tallow.
Anaerobic vs aerobic for rendering wastewater — which is better?
For influent COD above 5,000 mg/L, an anaerobic front-end (UASB, EGSB, or CSTR) cuts aeration energy by 60–80% and produces 0.25–0.40 m³ biogas per kg COD fed. Aerobic polishing — CAS or MBR — is then used to meet strict BOD, ammonia, and TSS discharge limits.
What cake dryness can a plate and frame filter press achieve on rendering sludge?
22–35% dry solids at 8–15 kg cationic polymer per ton DS, with cycle times of 2–4 h and filtrate SS typically below 200 mg/L. Cake above 30% DS opens the door to thermal-recovery options.
How is rendering sludge disposed of in 2026?
Routes include landfill, land application under EPA 40 CFR Part 503 in the US or EU 1069/2009 animal by-product categories in Europe, incineration, and thermal recovery via co-firing or gasification. Dewatered biosolids carry a calorific value of about 12 MJ/kg, comparable to low-grade coal (International Plasma Technology Center).
What is the 2026 monitoring trend for activated sludge in rendering plants?
A shift from static composition checks to dynamic biotoxicity monitoring using a perception-cognition-response architecture — online sensors feeding tiered decision logic for adaptive aeration and shock response (Toxics, 2026-05).
Related Equipment
- automatic chemical dosing for coagulation and polymer feed — specifications, capacity range, and technical data