Why Snack Plant Sludge Is a Different Beast
Snack sludge is a blend of three streams that municipal or dairy assumptions cannot model: DAF float loaded with FOG, starch, and melanoidins; waste activated sludge (WAS) from MBBR or MBR; and lamella or clarifier underflow carrying chemical precipitate when coagulant is dosed (HydropureWater field data, 2026). Snack influent runs 2,000–15,000 mg/L COD and 200–1,500 mg/L oil & grease, which is the root cause of elevated sludge yield (HydropureWater field data, 2026). The diagnostic fingerprint is the BOD/COD ratio: snack effluent lands at 0.4–0.55, well below the 0.6+ typical of brewery and dairy streams. That gap explains why snack sludge is more recalcitrant, digests more slowly, and produces less gas per gram of volatile solids than biosolids from comparable food sectors.
Plant-scale sludge production sits at 4–8 kg DS per cubic meter treated — derived from 0.3–0.5 kg DS per kg COD removed at typical 8–12 kg COD/m³ loadings. Maillard-reaction melanoidins formed during fryer operations are a slow-to-degrade fraction that suppresses digester gas yield and binds polymer during dewatering. Engineers who carry over dairy or brewery numbers into snack mass balances tend to under-specify thickener area and polymer dosing by 30–50%.
Sludge Mass Balance: Where the Solids Come From
A worked example for a 100 m³/d snack plant makes the streams concrete. Influent at 8,000 mg/L COD delivers 800 kg COD/d. At ~50% biological yield, the aeration basin wastes roughly 400 kg DS/d. The DAF unit removes ~95% of the 1,000 mg/L O&G load — about 100 kg DS/d of oil-emulsion and entrained starch skimmings. When coagulant is in service, lamella underflow adds another 50–80 kg DS/d of chemical precipitate. The total solids train produces 550–600 kg DS/d, which lands at 1.8–2.0 tonne wet cake per day once the cake is dewatered to 30% DS.
The parameter table below sets the boundary conditions a thickener or digester has to handle.
| Sludge stream | Typical %TS | Typical %VS (of TS) | Flow contribution (kg DS/d, 100 m³/d plant) | Notes |
|---|---|---|---|---|
| DAF float / skimmings | 3–6 | 80–90 | 95–100 | FOG + starch + melanoidins; floats readily but resists thickening |
| Waste activated sludge (WAS) | 0.5–1.0 | 65–75 | 350–450 | Biological yield, low density, high bound water |
| Lamella / clarifier underflow | 1–3 | 20–35 | 50–80 | Inorganic-rich when coagulant is on; depresses digester gas yield |
| Combined thickened sludge | 3–5 | 65–80 | 550–600 | Feed to digester or dewatering |
Thickening: Gravity, DAF, or Rotary Drum?
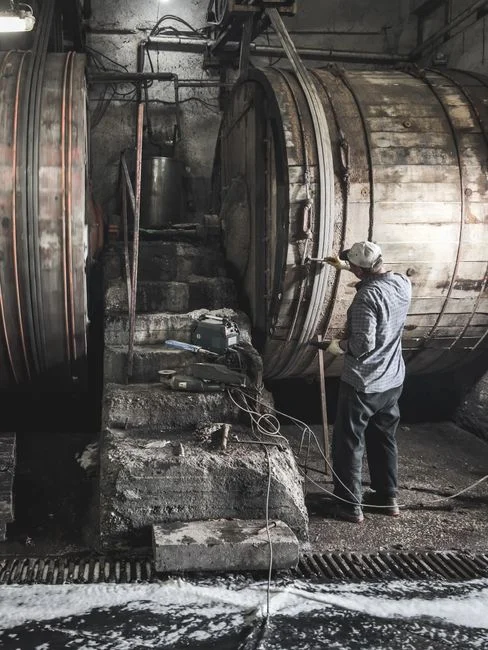
Thickener selection has to match the FOG and starch load, not just the hydraulic flow. A gravity thickener at 0.5–1.5 m/h overflow rate lifts DAF float plus WAS from 0.5–1.5% DS to 3–5% DS, but it fails on streams above 2,000 mg/L O&G because oil floats, re-mixes, and escapes with the overflow. A DAF thickener operating on waste sludge alone hits 4–6% DS at 5–15 m/h hydraulic loading using 30–60 g/m³ polymer. A rotary drum thickener with polymer conditioning is the common 2026 retrofit for plants short on footprint and routinely delivers 5–8% DS.
Polymer conditioning for snack sludge runs 3–6 kg active polymer per tonne DS — meaningfully higher than the 1–3 kg/t DS typical of municipal biosolids because the oil coating on flocs shields binding sites. A dissolved air flotation system configured as a sludge thickener is usually the lowest-risk choice when FOG is variable. A lamella clarifier ahead of the thickener drops polymer demand by roughly 30% by removing the inorganic fraction that drives overdosing.
| Thickener type | Typical %DS out | Polymer dose (kg/t DS) | Footprint | Best fit for snack sludge |
|---|---|---|---|---|
| Gravity thickener | 3–5 | 1–3 | Large | O&G <2,000 mg/L, mixed float + WAS |
| DAF thickener | 4–6 | 3–5 | Medium | WAS alone, variable FOG |
| Rotary drum thickener | 5–8 | 3–6 | Compact | Retrofit sites, WAS-dominant flow |
| Gravity belt thickener | 5–7 | 3–5 | Medium | Combined DAF float + WAS |
Anaerobic Digestion: Is Co-Digestion Worth It for Snack Sludge?
The honest answer depends on plant scale, and the published yield data is the anchor for the decision. Bench-scale work at Cal Poly (Spierling, 2011) on anaerobic co-digestion at 37.5°C reported 0.23 L CH₄/g VS for pure algae at 4 g VS/L-day and a 20-day HRT. The same study found peak yield of 0.40 L CH₄/g VS at 2 g VS/L-day, 20-day HRT, on a 50% algae / 40% sorted food waste / 10% wastewater sludge blend — directly relevant to a snack plant co-digesting sludge with fryer grease and snack trim. The improvement came from readily digestible co-substrate carbon, not from ammonia suppression; total ammonia nitrogen (TAN) at 3,370 mg/L did not inhibit yield in that work.
For a 100 m³/d plant, a working assumption is 1,200 kg VS/d feed and 0.35 L CH₄/g VS blended yield, which gives ~420 m³/d of biogas — about 8.4 GJ/d thermal energy, worth $80–$120/d at current industrial gas prices. Co-feed starch-rich snack sludge with high-carbon food waste (fryer grease, batter trim) to hold the C:N ratio at 25–30:1 and keep TAN below 2,500 mg/L on the real plant. Below 200 m³/d, payback drops sharply: digester CAPEX is largely fixed while gas revenue scales with flow, so aerobic dewatering alone is usually cheaper (HydropureWater field data, 2026). The companion snack food wastewater treatment equipment guide confirms the same scale threshold for the biological train.
Dewatering: Plate-and-Frame vs Belt Press vs Screw Press
Match dewatering technology to the cake dryness your disposal contract will accept and to the polymer dose your sludge can tolerate. A plate-and-frame filter press delivers 28–35% cake dryness at 15–25 kg active polymer per tonne DS, runs in batches of 4–8 cycles per day, and is the right pick when the landfill tip fee scales with moisture. A belt filter press gives 18–22% cake dryness at 8–12 kg polymer per tonne DS and runs continuously — lowest CAPEX but the highest hauling mass per ton DS. A screw press lands in the middle at 22–28% cake dryness and 5–10 kg polymer per tonne DS, and is the most common 2026 retrofit on footprint-constrained sites. A centrifuge produces 22–28% cake dryness at 8–15 kg polymer per tonne DS but draws 8–15 kWh/m³, which only pays back when washwater is closed-loop and electricity is cheap. A plate-and-frame filter press sized at $40,000–$90,000 CAPEX is the 2026 baseline for snack plants running above 100 m³/d; the swing is driven by filtration area, plate material, and automation level. For deeper OPEX work, the belt filter press OPEX breakdown and the screw press vs alternatives comparison extend the analysis.
| Technology | Cake dryness (%DS) | Polymer dose (kg/t DS) | Energy (kWh/m³) | CAPEX band (USD) | Best fit |
|---|---|---|---|---|---|
| Plate-and-frame filter press | 28–35 | 15–25 | 3–8 | 40,000–90,000 | Landfill contracts sensitive to moisture |
| Belt filter press | 18–22 | 8–12 | 1–2 | 25,000–60,000 | Lowest CAPEX, continuous operation |
| Screw press | 22–28 | 5–10 | 2–4 | 30,000–70,000 | Footprint-constrained retrofits |
| Centrifuge | 22–28 | 8–15 | 8–15 | 60,000–150,000 | Closed-loop washwater, low electricity cost |
2026 Cost Model: What Sludge Handling Actually Costs per Tonne
Running the numbers on the same 100 m³/d plant producing 550–600 kg DS/d gives a defensible line item. Polymer alone at 20 kg/t DS × $3.50/kg × 0.6 t DS/d is $42/d. Hauling at 30% cake is ~2.0 t/d wet × $40/t landfill tip = $80/d. At 20% belt-press cake the wet mass rises to ~3.0 t/d, and the hauling line jumps to $120/d — a 50% penalty for skipping the press. Electricity for dewatering at 3–8 kWh/m³ for a plate press, 1–2 kWh/m³ for a belt press, $0.10/kWh, and 100 m³/d flow adds $30–$80/d. The combined sludge OPEX band lands at $150–$280/d for a dewatered-cake scenario and $250–$400/d for under-dewatered cake, confirming the 20–30% OPEX swing on hauling alone (HydropureWater field data, 2026).
| Cost line | Dewatered cake (30% DS) | Under-dewatered cake (20% DS) | Driver |
|---|---|---|---|
| Polymer | $42/d | $42/d | 20 kg/t DS × $3.50/kg × 0.6 t DS/d |
| Hauling (landfill tip $40/t) | $80/d | $120/d | Wet mass × tip fee |
| Electricity for dewatering | $30–$80/d | $10–$20/d | Technology-dependent kWh/m³ |
| Total sludge OPEX | $150–$280/d | $250–$400/d | 20–30% OPEX swing on hauling alone |
Compliance: 40 CFR Part 503 and What Cake Quality Means for Disposal Route
US biosolids disposal is governed by 40 CFR Part 503, not the 40 CFR Part 407 effluent guidelines that cap BOD₅ at 26 mg/L and TSS at 31 mg/L daily max for direct-discharge snack lines — engineers conflate the two and submit the wrong compliance paperwork. Part 503 sets pollutant ceilings (Table 1) and pollutant concentrations (Table 3) for land application, with Class A pathogen reduction requiring fecal coliform below 1,000 MPN/g TS (or below 3 MPN/4 g by alternative testing) and Class B allowing up to 2,000,000 MPN/g with site restrictions. Vector attraction reduction (VAR) is typically met by demonstrating 38% volatile solids reduction during digestion — that is a digester performance specification, not a disposal specification. If the cake exceeds any Table 3 ceiling — copper and zinc from process equipment corrosion are the typical watch-outs in snack plants — the disposal route drops to landfill-only, and the landfill tip fee becomes the binding economic constraint. A polymer dosing skid that holds conditioning within ±5% of setpoint protects both cake quality and the Table 3 numbers.
Frequently Asked Questions
How much sludge does a snack plant produce per cubic meter of treated wastewater?
4–8 kg dry solids per cubic meter treated, with DAF skimmings contributing 40–60% of the volatile load (HydropureWater field data, 2026).
Can snack sludge be co-digested with food waste?
Yes. Co-digestion at a 50/50 VS split raises methane yield from 0.23 to 0.40 L CH₄/g VS at 2 g VS/L-day and a 20-day HRT at 37.5°C (Spierling, Cal Poly, 2011).
Is anaerobic digestion economical below 200 m³/d?
No. Biogas revenue cannot cover digester CAPEX at that scale; aerobic thickening plus mechanical dewatering is usually the cheaper path (HydropureWater field data, 2026).
What cake dryness does a plate-and-frame filter press deliver on snack sludge?
28–35% dry solids at 15–25 kg active polymer per tonne DS, in 4–8 batch cycles per day (HydropureWater field data, 2026).
Which US rule governs snack sludge disposal?
40 CFR Part 503 biosolids rules govern the cake; 40 CFR Part 407 governs the effluent only and does not regulate sludge handling or disposal.