Why Beverage Wastewater Challenges Conventional Treatment
Beverage effluent sits in a high-strength, highly variable envelope that conventional activated sludge handles poorly: COD typically 1,000–10,000 mg/L, BOD/COD ratio 0.5–0.7, TSS 200–1,500 mg/L, FOG up to several hundred mg/L, and pH swings of 3–11 driven by clean-in-place (CIP) chemicals (HydropureWater field data, 2026). Brewery and distillery waste can run even higher during fermentation blowdowns; dairy waste adds lactose and butterfat loads; soft-drink bottling lines contribute sugar surges from line start-ups and product changeovers.
CIP surges are the main upset source. Hot alkaline and acidic rinse water can shift effluent temperature 10–30 °C and pH across the full range within minutes, and the same sequence can dump 50–200 mg/L of residual caustic or nitric acid into the drain. Sugar and starch loads from bottling start-ups and batch fermenter discharges produce shock organic loading that conventional floc-and-settle biology cannot buffer without large equalization volume.
Discharge drivers are tightening on three fronts. China's GB 19821—2005 sets brewery-specific pollutant limits; the EU Urban Waste Water Directive 91/271/EEC applies to food and beverage discharges above the population-equivalent threshold; and most US POTW pretreatment programs enforce local limits typically BOD < 250–500 mg/L and TSS < 250 mg/L before accepting discharge. Plants that exceed surcharge thresholds pay penalties, and plants in nutrient-sensitive watersheds may need biological nitrogen and phosphorus removal before surface water discharge. For pretreatment rule detail applicable to food and beverage sites in the US Midwest, see the food and beverage pretreatment compliance guide.
How MABR Works in a Beverage Plant Context
A membrane aerated biofilm reactor (MABR) treats beverage wastewater by passively diffusing oxygen through spirally wound hollow-fiber membranes at near-atmospheric pressure, growing a nitrifying biofilm on the wastewater side of the membrane while the surrounding anoxic bulk liquor hosts denitrifying bacteria. Because oxygen and substrate move into the biofilm from opposite sides, the geometry is counter-diffusional — different from co-diffusional air diffusers where O₂ and BOD meet inside the floc from the same direction (per Fluence MABR technology documentation, 2025).
The counter-diffusional geometry is what makes simultaneous nitrification-denitrification (SND) work in a single tank. The aerobic nitrifying layer sits on the membrane surface where O₂ is highest; denitrification completes in the anoxic bulk using BOD from the influent as the carbon source. For beverage plants, this consolidation matters: a duty that historically required separate aerobic, anoxic, and often tertiary denitrification stages collapses into one reactor with one blower.
Documented performance from pilots and commercial sites: MABR cuts aeration energy by up to 90% and overall plant energy by up to 50% compared to conventional activated sludge (Fluence MABR product documentation, 2025). At Stanford University's Codiga Resource Recovery Center (CR2C), a yearlong pilot produced effluent total nitrogen (TN) below 3 mg/L and total phosphorus (TP) below 0.3 mg/L, meeting California Title 22 reuse criteria. At the CENTA research center in Spain, an Aspiral S1 unit recorded TN of 4.1 mg/L and TP of 0.4 mg/L after startup, with the system left unattended for nearly two months during the 2020 COVID lockdown and continuing to deliver compliant effluent. Pretreatment upstream of the MABR zone is still required — typically a DAF system for sugar, starch, and FOG removal plus screening and equalization.
MABR Design Parameters for Beverage Effluent
The design envelope for a beverage-duty MABR draws on the SUBRE retrofit range and the Aspiral packaged range. For brownfield upgrades of existing aeration basins, the SUBRE class is rated for 2,000–100,000 m³/d retrofit capacity with basin depths of 1.5–6 m, modules containing up to 4 levels of MABR spirals, and a separate low-pressure low-flow blower for membrane aeration (Fluence MABR product documentation, 2025). For satellite beverage lines, packaged Aspiral units start at 20 m³/d and can be paralleled in shipping containers for larger flows.
| Parameter | Typical design range (beverage duty) | Notes |
|---|---|---|
| HRT (MABR basin) | 6–18 h | Driven by influent COD and target effluent |
| SRT | Biofilm — not controlled by wasting; MLSS SRT 8–20 d | Biofilm self-regulates on membrane surface |
| Membrane airflow rate | Low-pressure, low-flow; per module | Near-atmospheric passive diffusion |
| Mixed-liquor temperature | 10–35 °C operating band | Biofilm activity drops below ~10 °C |
| F/M ratio (bulk) | 0.1–0.3 kg BOD/kg MLVSS·d | Lower than conventional AS for SND stability |
| Membrane surface area | Vendor-specific per module | Sets nitrification capacity |
| Target effluent COD/BOD | < 100 / < 20 mg/L (with pretreatment) | Beverage reuse or sensitive discharge |
| Target effluent TN / TP | < 5 / < 0.5 mg/L | Per Stanford and CENTA pilots |
Pretreatment is non-negotiable for beverage duty. A rotary bar screen for headworks removes bottle caps, label fragments, and pulp fiber before they reach the basin. An equalization basin sized for 24–48 hours of flow damps CIP temperature and pH peaks and protects the biofilm from excursions below pH 5 or above pH 9, which can cause nitrifier kill events. A DAF unit ahead of the MABR handles residual sugars, starch, and emulsified FOG — skipping this step allows heterotrophic overgrowth on the membrane that outcompetes the slow-growing nitrifiers and collapses ammonia removal. For greenfield or remote sites where civil work is constrained, a WSZ underground package plant can house preliminary treatment in a buried footprint.
MABR vs MBR vs SBR: Which Fits Your Beverage Plant?
No single technology wins every beverage scenario. The honest comparison for a brewery, dairy, soft-drink, or distillery procurement team looks at energy, footprint, effluent quality, sensitivity to load swings, sludge yield, CAPEX, OPEX, and best-fit duty.
| Criterion | MABR | MBR | SBR |
|---|---|---|---|
| Energy use | Lowest — up to 90% aeration energy cut | High — membrane scouring + aeration | Moderate — intermittent aeration |
| Footprint | Smallest — single tank SND | Moderate — separate membrane tank | Largest — batch volume required |
| Effluent quality (TN/TP) | TN < 5, TP < 0.5 mg/L achievable | TN < 10, TP < 1 mg/L with chemical P | TN < 8, TP < 1 mg/L with chemical P |
| Sensitivity to FOG/sugar shock | Moderate — pretreatment essential | High — membrane fouling risk | High — settling failure on shock load |
| Sludge yield | Low — biofilm retention | Moderate — high MLSS wasting | Moderate to high |
| CAPEX (order-of-magnitude) | Moderate — module-driven | High — membrane replacement | Low to moderate — civil only |
| OPEX (energy-dominated) | Lowest | Highest | Moderate |
| Best-fit beverage scenario | Variable-flow, energy-sensitive, brownfield upgrades | Tight space, reuse-grade effluent | Small batch brewery under 200 m³/d, intermittent flow |
For tight footprint and reuse-grade effluent, an MBR membrane bioreactor alternative using a DF series PVDF flat sheet membrane module remains the conventional choice — but expect membrane fouling risk on FOG and sugar spikes unless pretreatment is bulletproof. SBR is well suited to small batch breweries and intermittent discharges, with the design detail covered in the SBR for yeast wastewater guide. MABR earns its place where energy cost is a line-item concern, where the existing aeration basin can be retrofitted in 1–3 weeks, and where SND in a single tank simplifies operations. Decision rule: COD above 5,000 mg/L with consistent flow points toward anaerobic pretreatment followed by MABR polishing; COD 1,000–3,000 mg/L with variable flow points toward standalone MABR with equalization; tight space and reuse demand pushes toward MBR; small batch brewery under 200 m³/d is well served by SBR or packaged Aspiral-class MABR.
Retrofit vs Greenfield: CAPEX and OPEX Reality Check
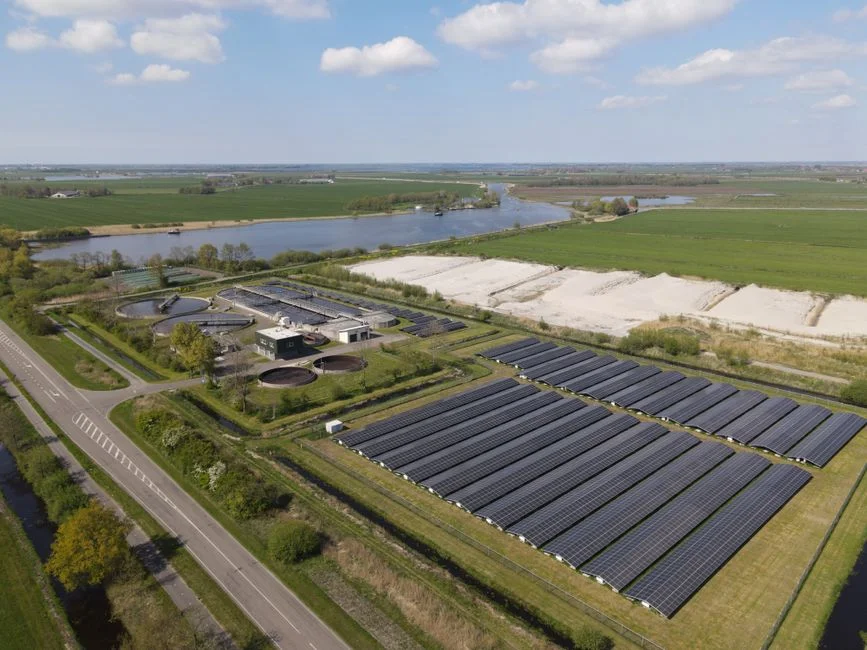
The retrofit case is the strongest economic argument for MABR at an operating beverage plant. SUBRE modules are submerged in the existing anoxic zone of the aeration basin (or in a fully aerobic basin after a separating wall is added), reuse the existing basin geometry at depths 1.5–6 m, and connect to a separate low-pressure low-flow blower. Per Fluence documentation (2025), measurable effluent improvement and up to 30% overall energy reduction are typically seen within 1–3 weeks, with the retrofit performed one basin at a time to minimize plant interruption. Coarse-bubble diffusers already in the basin can be repurposed for periodic mixing of suspended biomass.
The greenfield case is dominated by packaged Aspiral units for satellite or remote beverage lines, with treatment capacities starting at 20 m³/d and multiple containers parallelable for larger flows. Commissioning speed is a documented advantage — a 300 m³/d Aspiral plant was installed and commissioned within 10 days at Taiping village in Henan Province (Fluence case data, 2025), though that site is non-beverage duty and should be read as a deployment-speed benchmark, not a beverage reference. Starch-load pretreatment sizing for DAF in food plants is covered in the DAF cost guide for starch wastewater.
Order-of-magnitude CAPEX for planning purposes only — project-specific, not a quote: packaged MABR systems in 2026 typically fall in the USD 1,500–4,000 per m³/d installed range, while retrofits reusing existing basins fall in the USD 800–2,500 per m³/d range. The dominant OPEX line is aeration energy, which typically accounts for 40–70% of total wastewater treatment energy in a conventional activated sludge plant — cutting that line by up to 90% is the single largest payback driver. Chemical dosing for pH correction and phosphorus polishing is supported by an automatic chemical dosing system; downstream solids handling uses a high-efficiency sedimentation tank for clarifier upgrades.
2026 Compliance Map for Beverage Effluent Discharges
MABR pilot data maps cleanly onto the three regulatory frameworks that govern beverage effluent in 2026. MABR's documented TN below 3 mg/L and TP below 0.3 mg/L (Stanford CR2C) sits well inside China GB 18918—2002 Class 1A limits of TN < 15 mg/L and TP < 0.5 mg/L for surface water discharge. Under the EU Urban Waste Water Directive 91/271/EEC, total nitrogen and phosphorus requirements depend on whether the receiving waterbody is designated sensitive; in sensitive catchments MABR polishing after anaerobic pretreatment can meet the < 10–15 mg/L N and < 1–2 mg/L P bands without a tertiary denitrification filter. US POTW pretreatment typically caps BOD and TSS at 250–500 mg/L for indirect discharge; MABR's lower sludge yield and tighter effluent reduce municipal surcharges even when full biological nutrient removal is not required.
The compliance decision branches on the discharge path. For direct surface water discharge in TN/TP-sensitive catchments, MABR polishing after anaerobic pretreatment meets Class 1A without tertiary denitrification filters — a significant capital saving over conventional nitrification-denitrification with methanol dosing. For direct discharge in non-sensitive watersheds, beverage plants rarely need full biological nitrogen removal, and MABR's value proposition shifts to footprint reduction and aeration energy savings rather than nitrogen compliance. For indirect discharge to municipal sewer, MABR's lower sludge yield and tighter effluent reduce POTW surcharges and pretreatment program violations.
Deployment Checklist and Common Pitfalls
- Influent characterization — composite sampling over 7–14 days covering at least two full CIP cycles; measure COD, BOD, TSS, FOG, pH, temperature, TKN, and TP at hourly resolution.
- Pretreatment sizing — rotary bar screen, equalization basin sized for 24–48 h, DAF for residual sugars/starch/FOG.
- MABR sizing — run vendor hydraulic model with your composite data; confirm HRT, biofilm surface area, and blower sizing against the design envelope.
- Integration — for brownfield, confirm basin depth (1.5–6 m), anoxic zone geometry, and separating wall requirement; for greenfield, lay out packaged plant footprint and container access.
- Instrumentation — DO, pH, temperature, MLSS, influent and effluent flow; remote monitoring and control for unattended operation.
- Commissioning — seeded startup, gradual influent introduction, 1–3 week stabilization window before full-load operation.
Common pitfalls: skipping equalization and allowing pH 3 CIP liquor to reach the biofilm is a kill event for nitrifiers and a multi-week recovery. Under-sizing DAF leaves residual sugars that drive heterotrophic overgrowth on the membrane, outcompeting the slow-growing nitrifiers and collapsing ammonia removal. Ignoring winter low-temperature drops in unheated basins — MABR tolerates lower temperatures than activated sludge, but biofilm activity still drops meaningfully below 10 °C and should be modeled into the design. Missing the periodic mixing-air design for SUBRE retrofits, where coarse-bubble diffusers in the existing basin are repurposed to keep suspended biomass in motion (Fluence MABR product documentation, 2025). For polishing and disinfection downstream, integrate a chlorine dioxide generator for reuse-grade effluent, and a plate-frame filter press for sludge dewatering that keeps the waste-handling footprint predictable.
Frequently Asked Questions
Is MABR proven enough for a beverage plant in 2026?
Yes for the duty envelope it fits. Commercial MABR deployment began in 2016 and exceeds 200 commercial projects globally; pilots at Stanford CR2C and CENTA Spain recorded TN below 4.1 mg/L and TP below 0.5 mg/L (Fluence MABR documentation, 2025). Beverage-specific full-scale references are still building, so the conservative move is to specify MABR with piloting on the actual plant effluent before full CAPEX commitment.
How much aeration energy does MABR actually save on beverage duty?
Up to 90% on the aeration line and up to 50% on overall plant energy versus conventional activated sludge, based on Fluence MABR product documentation (2025). Because aeration is typically 40–70% of total wastewater treatment energy at a conventional beverage plant, the absolute OPEX impact is material and is the primary payback driver in retrofit economics.
Can MABR handle CIP surges and pH swings from alkaline and acid rinse?
Only with 24–48 hours of equalization upstream. MABR biofilm tolerates gradual variability well, but pH excursions below 5 or above 9 can knock out nitrifiers for days. A rotary bar screen and a properly sized equalization basin, both standard pretreatment, are the difference between stable operation and a recurring kill event.
What is the realistic CAPEX for an MABR retrofit versus a packaged MABR system?
Order-of-magnitude planning ranges for 2026 — not quotes: packaged MABR systems at USD 1,500–4,000 per m³/d installed, retrofits reusing existing aeration basins at USD 800–2,500 per m³/d. Retrofit economics are stronger when the existing basin geometry falls inside the 1.5–6 m depth envelope and a separating wall can create the anoxic zone.