Why Seafood Processing Wastewater Is a High-Strength BOD/COD Stream
Seafood processing wastewater is not a "dilute food stream" — it is a high-strength industrial effluent that routinely exceeds 4,000 mg/L COD at the plant outlet. The CORA pilot characterization on a fish-processing line measured raw water at COD 4,275 mg/L, BOD5 2,050 mg/L, TSS 1,850 mg/L, oils & fats 942 mg/L, pH 5.5. Discharging that stream without treatment is a guaranteed permit violation under any 2026 EU Urban Wastewater Treatment Directive (91/271/EEC) implementing rule or EPA Effluent Limitations Guideline (40 CFR 408) fish-processing category.
Across the sector, raw influent from fish and shellfish plants typically lands in the bands below (source: CORA characterization, 2024-2025). The wide COD range (2,000-5,000 mg/L) reflects sub-process variation, not measurement noise — a wash-water floor drain and a surimi press liquor are fundamentally different wastewaters.
| Parameter | Typical Range (mg/L) | Common Discharge Limit (mg/L) |
|---|---|---|
| COD | 2,000 - 5,000 | ≤ 125 - 150 |
| BOD5 | 800 - 2,500 | ≤ 30 - 40 |
| TSS | 700 - 2,000 | ≤ 50 |
| Oils & Fats (FOG) | 100 - 1,000 | ≤ 10 - 15 |
| pH | 5.5 - 9.0 | 6.0 - 9.0 |
Sub-process drives the spread. Washing, refrigeration, and ice-melt streams stay dilute (BOD5 200-500 mg/L) — mostly blood, slime, and residual protein. Canning, surimi, and smoked-fish lines push COD past 3,000 mg/L because brines, protein hydrolysates, smoke condensates, and edible oils concentrate in the process water. A single batch-cook drain can swing pH from 5.5 to 8.5 in 20 minutes. Combined with FOG at 1,000 mg/L, this stream is incompatible with conventional activated sludge as a stand-alone treatment — emulsified oil coats biomass, drives filamentous bulking, and crashes settleability. Physical pre-treatment — a dissolved air flotation system sized for the FOG load — is non-negotiable before any biological step.
Three-Stage Treatment Train for COD and BOD Removal
A reliable treatment train for fish and shellfish effluent has five unit operations in fixed order: screening, DAF, equalization, biological reactor, membrane separation. Skipping any of them either wrecks downstream equipment or pushes effluent above permit.
Stage 1 — Screening and grit removal. A GX series rotary mechanical bar screen with 3-5 mm openings protects downstream pumps from fish solids, scales, shells, and packaging debris. Without it, DAF scum pumps lose prime within hours during peak processing.
Stage 2 — DAF for FOG and floatables. Coagulant dosing with PAC at 50-150 mg/L and anionic polyacrylamide at 2-5 mg/L destabilizes emulsified oil; dissolved air injection at 4-6 bar floats the oil-solids complex to the surface. The CORA pilot recorded 95.6% FOG removal and 60-70% BOD5 capture in this stage alone. DAF also knocks out 50-60% of TSS, lightening the load on the biological stage.
Stage 3 — Equalization basin. Sized for 8-12 hours of average daily flow, the EQ basin dampens pH swings (5.5 → 7.0) and load surges from batch cooking and CIP cycles. Aerated EQ also provides 10-15% additional BOD5 reduction through pre-aeration, stabilizing influent to the bioreactor.
Stage 4 — Biological reactor. Conventional activated sludge (CAS) struggles on this stream: MLSS is lost to oil-washed floc, SVI runs above 200 mL/g, and washouts follow every cook cycle. An integrated MBR membrane bioreactor decouples solids retention from hydraulic retention — biomass stays in the tank at 8,000-12,000 mg/L regardless of hydraulic spikes, while treated water passes through a submerged PVDF membrane at 0.1 µm pore size. For a deeper look at the food-grade MBR case, see Hollow Fiber MBR for Food Processing: 2026 Engineering Guide.
Stage 5 — MBR membrane module. The DF series PVDF flat sheet membrane modules operate at 10-20 LMH with a 99% solids rejection, producing a TSS <10 mg/L permeate. Backwash every 15-30 minutes and CIP every 30-90 days maintain flux. Compare the design approach to emulsified-oil streams in How to Treat Emulsified Oil Wastewater: 2026 Process Guide, and the microbubble physics behind DAF in DAF Clarifier Working Principle: Engineering Specs & Microbubble Physics 2026.
Pilot-Scale Performance Data: DAF + MBR
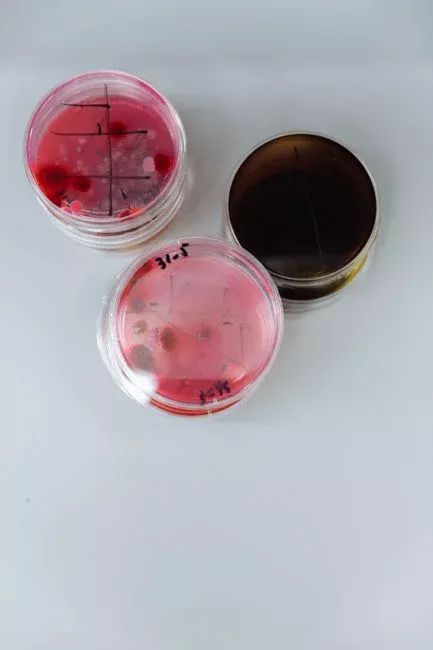
The CORA pilot run paired the DAF with a submerged MBR and produced the dataset below (source: CORA, 2024-2025). This is the single most defensible proof point a process engineer can put in front of a plant manager or regulator.
| Parameter | Raw (mg/L) | DAF + MBR Effluent (mg/L) | Reduction (%) |
|---|---|---|---|
| BOD5 | 2,050 | 40 | 98.0 |
| COD | 4,275 | 128 | 97.0 |
| TSS | 1,850 | 9.3 | 99.5 |
| Oils & Fats | 942 | 41 | 95.6 |
| pH | 5.5 | 6.5 | — |
What each stage contributed: DAF handled 95.6% of FOG and roughly 60-70% of BOD5 by removing oil-bound and floatable organics; the biological reactor converted the remaining soluble BOD/COD to biomass and CO2; the MBR membrane polished out non-settleable solids and ensured TSS below 10 mg/L regardless of biomass settleability — eliminating the bulking failures common to CAS on food streams.
Operating parameters from the pilot: MLSS 8,000-12,000 mg/L in the MBR tank, SRT 25-40 days, HRT 6-10 hours in the bioreactor, and DO 2-3 mg/L in the aerobic zone. The 0.1 µm membrane pore size guarantees a TSS <10 mg/L permeate and a 2-3 log reduction in fecal coliforms, which materially simplifies downstream disinfection.
Sizing Each Unit Operation for Your Plant
Pilot numbers translate into a sized equipment list through four rules of thumb. The table below maps design flow to unit-operation capacity for a typical 200 m³/d fish-processing plant.
| Unit Operation | Design Parameter | Typical Range | 200 m³/d Example |
|---|---|---|---|
| DAF | HRT / Surface loading | 20-30 min / 10-20 m³/m²·h | 1-2 m³ unit, 0.1-0.2 m² surface |
| Equalization | HRT | 8-12 h of ADF | 67-100 m³ basin |
| MBR Tank | MLSS / HRT / F:M | 10,000 mg/L / 6-8 h / 0.08-0.15 | 50-70 m³ tank volume |
| DF Membrane Modules | Membrane area / Flux | 0.6-0.8 m² per m³/d / 10-20 LMH | 120-160 m² total area |
DAF sizing: hydraulic retention of 20-30 minutes, surface loading of 10-20 m³/m²·h, and an air-to-solid ratio of 0.02-0.05 kg air/kg TSS. The DAF line covers 4-300 m³/h in packaged units. Equalization: provide 8-12 hours of average daily flow to absorb canning-cook cycle peaks. MBR tank volume: target MLSS 10,000 mg/L and HRT 6-8 hours to keep the food-to-microorganism ratio at 0.08-0.15 kg BOD/kg MLSS·day. Membrane area: 0.6-0.8 m² per m³/d of design flow; the DF series ships 80-225 m² modules producing 32-135 m³/d each. A high-rate lamella sedimentation tank in front of the MBR is optional but reduces membrane fouling by 20-30% on streams with variable TSS.
2026 Effluent Compliance and Reuse Targets
For 2026, food and seafood processors face COD limits of ≤125-150 mg/L, BOD5 ≤30-40 mg/L, TSS ≤50 mg/L, and FOG ≤10-15 mg/L under most regional implementations of the EU UWWTD and EPA 40 CFR 408 (regional variance: Mediterranean EU and Quebec impose the tighter end; US Pacific Northwest follows EPA cluster rules). The CORA pilot effluent of 128 mg/L COD and 40 mg/L BOD5 sits at the borderline — passable on COD with a polishing step, marginal on BOD5 without it.
Polishing closes the gap. Chlorination to a 0.5-1.0 mg/L residual handles fecal coliform compliance, and a chlorine dioxide generator avoids the trihalomethane formation associated with chlorine on protein-rich streams. UV at 40 mJ/cm² provides a chemical-free alternative for plants with reuse goals.
Reuse math is where MBR pays back. MBR permeate typically supports on-site reuse for wash-down, CIP pre-rinse, or boiler feed after RO polishing — cutting freshwater draw by 60-80% (HydropureWater field data, 2026). For a 200 m³/d plant operating 250 days/year, that is 30,000-40,000 m³ of avoided freshwater cost annually, plus reduced discharge fees.
Sludge Handling and Chemical Optimization
Closing the mass balance means handling two sludge streams: the FOG-rich DAF float and the waste-activated sludge from the MBR. MBR with high SRT (25-40 days) produces 0.3-0.5 kg DS/kg BOD5 removed, dewaterable to 25-35% dry solids with a plate-and-frame filter press. A decanter centrifuge is faster but loses more FOG to the centrate; the plate press retains it in the cake.
Chemical OPEX runs 15-25% of total treatment cost on food streams. Optimizing coagulant and polymer dosing with an automatic chemical dosing system tied to influent flow and streaming-current measurement typically cuts PAC consumption by 15-25% without losing removal performance. Jar testing every quarter keeps the dose matched to seasonal shifts in fish species and product mix.
Frequently Asked Questions
What COD and BOD5 removal can a DAF + MBR train achieve on seafood processing wastewater? The CORA pilot recorded 97% COD removal (4,275 → 128 mg/L) and 98% BOD5 removal (2,050 → 40 mg/L) on raw fish-processing effluent. DAF contributes roughly 60-70% of total BOD5 capture through FOG and floatable-solids removal; the MBR biological stage converts the remaining soluble COD and BOD5.
Why is MBR preferred over conventional activated sludge for fish processing wastewater? High FOG (up to 1,000 mg/L) coats biomass and triggers filamentous bulking in CAS, driving SVI above 200 mL/g and causing washouts. MBR decouples SRT from HRT, holds MLSS at 8,000-12,000 mg/L, and uses a 0.1 µm membrane to guarantee TSS <10 mg/L permeate regardless of settleability.
How much membrane area is needed per cubic meter of daily design flow? For food-grade MBR on seafood effluent, allocate 0.6-0.8 m² of membrane area per m³/d of design flow at 10-20 LMH flux. A 200 m³/d plant needs 120-160 m² total area, typically delivered by two DF series modules of 80-100 m² each operating in parallel with one in standby.
Does MBR permeate meet 2026 reuse standards for wash-down and boiler feed? MBR permeate alone meets non-potable reuse criteria for wash-down and CIP pre-rinse. Boiler feed requires an additional RO pass to bring conductivity below 10 µS/cm. Plants reusing MBR permeate typically cut freshwater draw by 60-80%.