Why Food Processing Wastewater Pushes Conventional Treatment Past Its Limits
Food processing wastewater arrives at the treatment plant with 3–30× the organic load of municipal sewage, and the swings between batches make it harder to treat than the headline numbers suggest. Influent COD commonly runs 1,000–15,000 mg/L versus 250–500 mg/L for domestic sewage (per typical food-industry characterisation surveys, 2024–2025), and FOG frequently reaches 500–3,000 mg/L in dairy, meat and edible-oil streams. A fruit-canning line can swing from 800 mg/L COD on a water-only day to 18,000 mg/L during a tomato or pineapple campaign, often within 12 hours.
Conventional activated sludge tolerates these swings poorly. FOG shocks coat biomass and cause foaming, bulking and loss of settling; secondary clarifiers cannot reliably hold the 8,000–12,000 mg/L MLSS that high-rate food plants need to maintain nitrification, and washout events follow. Discharge limits are tightening in parallel: China's GB 26131-2010 sets ≤50 mg/L COD for food processing, and most provincial permits are now stricter in practice. The engineered answer is to decouple solids retention from hydraulic retention by combining activated-sludge biology with physical membrane separation — a membrane bioreactor, where the clarifier failure mode disappears because mixed liquor is filtered, not settled.
How a Hollow Fiber MBR Works in a Food Plant
A food-plant hollow fiber MBR uses a two-zone configuration: an aeration basin running the biological process at high MLSS (typically 8,000–12,000 mg/L) with submerged reinforced PVDF membrane cassettes hanging below the liquid level, and a permeate extraction system pulling treated water through the fiber walls. The outside-in flow path is the dominant food-industry configuration — mixed liquor contacts the outer wall of each fiber, and permeate is drawn through the wall into the fiber lumen under suction (typically 10–50 kPa TMP) from a permeate pump or gravity siphon. The rejected solids stay in the basin, where they are continuously recycled back to the aeration zone.
Design flux for submerged hollow fiber MBR on food streams runs 10–25 L/m²·h at 15–25 °C — lower than flat-sheet MBR on a per-area basis, but the higher packing density of fiber cassettes (typically 250–400 m² of membrane per 100 m³ of aeration volume) more than compensates at the tank level. Coarse-bubble aeration beneath the modules does the heavy lifting on fouling control: continuous air scour at 0.1–0.3 m³ air per m² membrane area per minute keeps cake from forming and strips biofilm before it consolidates. The trade-off is energy — aeration accounts for 60–70% of total MBR power draw, and that single line item drives most of the OPEX discussion that follows.
Sub-Sector Influent vs. Effluent Performance — The Food-Plant Reality
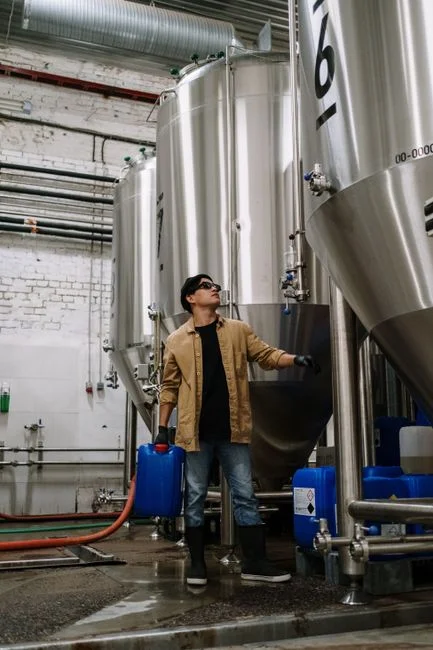
Food wastewater is not one stream — it is at least five, and each has a different signature load. The matrix below is built from full-scale operating data across the major sub-sectors, including the 2026 North Sumatra coconut-processing MBR dataset (three plants, five years) where >99.5% COD/BOD/TSS removal was reported across all sites. The numbers are typical influent ranges an engineer will see in a process audit, paired with the effluent quality a well-designed hollow fiber MBR can hold as a 30-day average.
| Sub-sector | Influent COD (mg/L) | Influent BOD (mg/L) | Influent FOG (mg/L) | MBR effluent COD (mg/L) | MBR effluent TSS (mg/L) | Key challenge |
|---|---|---|---|---|---|---|
| Dairy (cheese, milk, whey) | 3,000–10,000 | 1,500–5,000 | 200–1,000 | <50 | <5 | FOG + high nitrogen from whey |
| Brewery / beverage | 2,000–6,000 | 1,200–3,000 | <100 | <50 | <1 | C:N ratio imbalance; TN often limits |
| Meat processing / slaughterhouse | 2,500–8,000 | 1,500–4,000 | 500–2,000 | <80 | <10 | Blood + fat; DAF pretreatment strongly recommended |
| Fruit & vegetable (incl. coconut, juice) | 2,000–12,000 (peaks 18,000) | 1,000–6,000 | <200 | <50 | <5 | Seasonal/campaign peaks (HydropureWater field data, 2026) |
| Edible oils and fats | 5,000–30,000 | 2,500–15,000 | 1,000–5,000 | <100 (post-DAF) | <10 | Extreme FOG; UF/RO polishing standard for reuse |
Three observations from the table. First, FOG is the single biggest design driver — it dictates whether DAF is a nice-to-have or a must-have upstream of the MBR basin. Second, brewery streams look easy on carbon but the C:N:P ratio is often 100:5:1 versus the 100:5:1 metabolic optimum, so a separate denitrification stage may be needed. Third, edible-oil refining sits well outside the comfort zone of any submerged MBR geometry and is the one food sub-sector where an external cross-flow MBR is the defensible choice.
Membrane Specs That Actually Matter for Food Applications
Vendor datasheets list twenty parameters; the food-plant engineer only needs to lock in six to eight. The table below is what a defensible purchase spec looks like, with food-specific tolerances that have been validated against full-scale operating data rather than lab brochures.
| Parameter | Spec for food service | Why it matters |
|---|---|---|
| Membrane material | Reinforced PVDF | Tolerates NaOCl up to 5,000 mg/L during CIP; PES/PP degrade faster in food CIP service |
| Nominal pore size | 0.1–0.4 μm (UF range) | Tighter than MF flat-sheet; produces near-reuse effluent without tertiary filtration |
| Fiber outer diameter | 1.0–2.5 mm | Thicker fibers are mechanically robust under backwash but offer less area per cassette |
| Tensile strength | ≥4 MPa | Food-plant rags and debris occasionally enter the basin; below 4 MPa fibres break |
| Operating TMP envelope | 10–50 kPa normal; clean-water ≤5 kPa | CIP triggered at TMP inflection point, not calendar |
| Module geometry | Rack/cassette, individually isolatable | Allows in-situ cleaning and replacement without draining the tank |
| Packing density | 250–400 m² membrane per 100 m³ aeration volume | Food plants typically target this range for footprint & capital efficiency |
The operating TMP envelope deserves emphasis. Clean PVDF membrane runs at ≤5 kPa on potable water at design flux; an MBR that sits at 8–10 kPa on day one is already fouled or undersized. Normal operation drifts up to 20–40 kPa between CIPs; the 50 kPa ceiling is the alarm threshold, not the operating point. The TMP inflection-point rule — trigger CIP at the first upward kink in the TMP-vs-time curve — is the single most actionable spec in the list, and it is validated by an 18-year full-scale PVDF operating record (HydropureWater field data, 2026).
Fouling Control and CIP Protocol for Food-Plant MBR
Fouling in a food MBR comes in two flavours. Reversible cake is the day-to-day layer that coarse-bubble aeration and periodic relaxation (1–2 minutes of permeate-off every 10–15 minutes) keep in check. Irreversible fouling is the consolidated biofilm and inorganic scale that only chemical cleaning removes, and it is what kills membranes early if the cleaning regime is wrong.
The TMP inflection-point rule is the cleaning trigger: monitor TMP at constant flux and act at the first upward inflection on the curve, typically every 2–8 weeks in food service depending on feed strength. The 18-year full-scale PVDF study validates this approach — calendar-based CIP wastes chemical, shortens membrane life, and on average under-cleans during the high-load months. Standard CIP chemistry is a two-step soak: (1) NaOCl 2,000–5,000 mg/L for 2–4 hours to strip organic and biologic fouling, then a potable-water rinse, then (2) citric acid 1–2% for 1–2 hours to dissolve inorganic scaling; never mix the two chemicals in the same step, and always rinse to neutral pH (6.5–7.5) before returning the cassette to service. Food-safety constraints are non-negotiable: CIP residuals must be flushed to documented limits before the basin is used for any in-process water reuse, and the cleaning event must be logged in the plant HACCP record. Budget a maintenance CIP of 1–2× per year per module, plus a recovery clean if flux drops more than 30% from baseline despite routine CIP.
Hollow Fiber vs. Flat Sheet vs. External Cross-Flow MBR — Choosing the Right Geometry
Membrane geometry is not a marketing choice — it is a constraint set by the influent. The decision framework below maps the three commercial MBR geometries against food-plant operating envelopes, and it is the framework missing from every generic MBR explainer currently ranking for this keyword.
| Geometry | Best fit (food sub-sector) | Influent envelope after pre-treatment | Energy intensity | Watch-outs |
|---|---|---|---|---|
| Hollow fiber submerged | Dairy, brewery, beverage, fruit/veg, coconut | TSS <5,000 mg/L; FOG <500 mg/L | 0.4–1.2 kWh/kg COD removed | Sensitive to rag fouling; needs ≤2 mm bar screen upstream |
| Flat sheet submerged (DF-style) | Slaughterhouse, primary meat, mixed food | TSS <8,000 mg/L; FOG 500–2,000 mg/L | Similar to hollow fiber | Individually replaceable elements; easier to clean; lower packing density |
| External cross-flow (sidestream) | Edible-oil refining, fishmeal, extreme FOG | Any TSS or FOG; tolerates >40 °C | 10–20× higher than submerged | Reserved for streams submerged MBR cannot handle |
Rule of thumb: pair MBR with appropriate pre-treatment first, then pick the geometry. A rotary bar screen at ≤2 mm upstream of the MBR basin is mandatory for all submerged geometries; DAF pre-treatment for FOG removal is required when influent FOG exceeds 200 mg/L. An integrated hollow fiber MBR system is the right call for the majority of food plants — dairy, brewery, beverage, fruit and vegetable processing — because it delivers the highest packing density and the lowest civil cost per m³ of permeate. Reach for flat-sheet submerged MBR when FOG sits between 500 and 2,000 mg/L and rags are a known issue. Only specify an external cross-flow MBR for edible-oil refining or fishmeal, where the influent simply will not behave in a submerged basin. If nitrogen removal is the binding constraint, particularly for brewery effluent, an upstream starch wastewater nitrogen removal process configuration can be adapted as a template for the A/O or post-denitrification stage.
CAPEX, OPEX and Membrane Replacement — A 2026 Budget Framework
Budget defensibly means quoting ranges, not a single number. The 2026 bands below are built from packaged hollow fiber MBR equipment pricing, typical civil and installation mark-ups, and operating data from full-scale food MBR plants reporting energy and chemical intensity per kg of COD removed.
| Cost line | 2026 budget band (USD) | Notes |
|---|---|---|
| Equipment + membranes (packaged 100–500 m³/day) | 150,000–600,000 | Scales with flow and reuse target |
| Total installed CAPEX (with civil) | 400,000–1,500,000 | Includes DAF, screening, blowers, controls |
| Electricity | 6–10 kWh/m³ treated | Aeration is 60–70% of total (HydropureWater field data, 2026) |
| CIP chemicals | 0.05–0.15 USD/m³ | NaOCl + citric acid, routine CIP only |
| Energy intensity | 0.4–1.2 kWh/kg COD removed | Full-scale food MBR operating range |
| Membrane replacement | 30–60 USD/m² of installed area | 8–10 year service life when TMP-inflection CIP rule is followed |
Flat-sheet MBR OPEX runs 10–20% higher on membrane replacement over a 10-year horizon but typically lower on CIP chemical use, so the geometries are roughly cost-neutral over a full life cycle when correctly specified. The real economic argument for hollow fiber MBR is the balance sheet line, not the chemistry line: roughly 60% footprint reduction versus a conventional activated-sludge plant at the same load, lower sludge yield (0.2–0.4 kg TSS per kg COD removed versus 0.4–0.6 for CAS), and reuse-quality effluent that displaces fresh-water draw. With discharge fees and water-scarcity reuse value included, payback against a conventional CAS + clarifier baseline typically lands at 3–5 years. For comparison points on a related high-strength stream, the fruit juice wastewater treatment plant price guide breaks down CAPEX/OPEX for a closely adjacent sub-sector.
Frequently Asked Questions
What pore size and material should a food-plant hollow fiber MBR use?
Reinforced PVDF with a nominal pore size of 0.1–0.4 μm is the de facto standard; it tolerates NaOCl up to 5,000 mg/L during CIP and delivers near-reuse effluent with turbidity below 1 NTU, removing the need for tertiary filtration in most food applications.
How often should a food-plant MBR be chemically cleaned?
Trigger CIP at the first upward inflection on the TMP-vs-time curve — typically every 2–8 weeks depending on feed strength. The 18-year full-scale PVDF operating record shows calendar-based CIP shortens membrane life and under-cleans during high-load months.
What influent FOG level can a submerged hollow fiber MBR handle?
With a DAF upstream, submerged hollow fiber MBR runs reliably on streams with FOG below 500 mg/L post-DAF. Between 500 and 2,000 mg/L, switch to flat-sheet submerged MBR; above 2,000 mg/L, an external cross-flow MBR is the defensible geometry.
What is the realistic 2026 CAPEX for a packaged food-plant hollow fiber MBR?
Equipment and membranes for a 100–500 m³/day packaged system run USD 150,000–600,000; total installed CAPEX including civil and pre-treatment typically lands between USD 400,000 and USD 1,500,000 depending on influent strength and reuse target.
What effluent quality can be guaranteed from a well-designed food-plant MBR?
COD below 50 mg/L, BOD below 10 mg/L, TSS below 5 mg/L, and turbidity below 1 NTU are achievable as 30-day averages across dairy, brewery, fruit and vegetable streams, with >99.5% COD/BOD/TSS removal reported across three full-scale coconut-processing MBR plants over five years (HydropureWater field data, 2026).